Tuesday June 6th: Rotational Trading Strategy for Stock-Based ETFs
Wednesday June 7th: Market/ETF Report and Video
Thursday June 8th: Stock Trading Strategy
Video and Report Headlines
CBM Remains at +5 and SPX in Uptrend
Yields Spreads Showing No Signs of Stress
Fed Balance Sheet also Showing No Signs of Stress
Large-caps and S&P MidCap 400 Lead Upturn in Breadth
SPX %Above 20-day SMA Surges above 60%
SPY: An Uptrend Since October and Flag Breakout
S&P 500 EW ETF Reflects Broadening Participation
S&P MidCap 400 SPDR Breaks Out with Big Surge
QQQ Extends Parabolic Move
SOXX Pulls Back after Sharp Advance
ITB Leads New High List
Finance SPDR Joins the Breakout Parade
Fintech ETF Plays Catch Up with a Delayed Breakout
Mobile Payments ETF Surges towards Resistance
Aerospace & Defense ETFs Bounce off Support
Airline ETF Follows Higher Low with a Breakout
Energy ETFs Firm at Support
ARK 3D Printing ETF Breaks Out of Big Wedge
BLOK Forms Bullish Cup-with-handle
Dollar Bullish ETF Surges to Resistance
GLD Pulls Back within Bigger Uptrend
Platinum ETF Firms in Key Retracement Zone
Lithium Battery Tech ETF Surges from Support to Resistance
Large-caps and S&P MidCap 400 Lead Upturn in Breadth
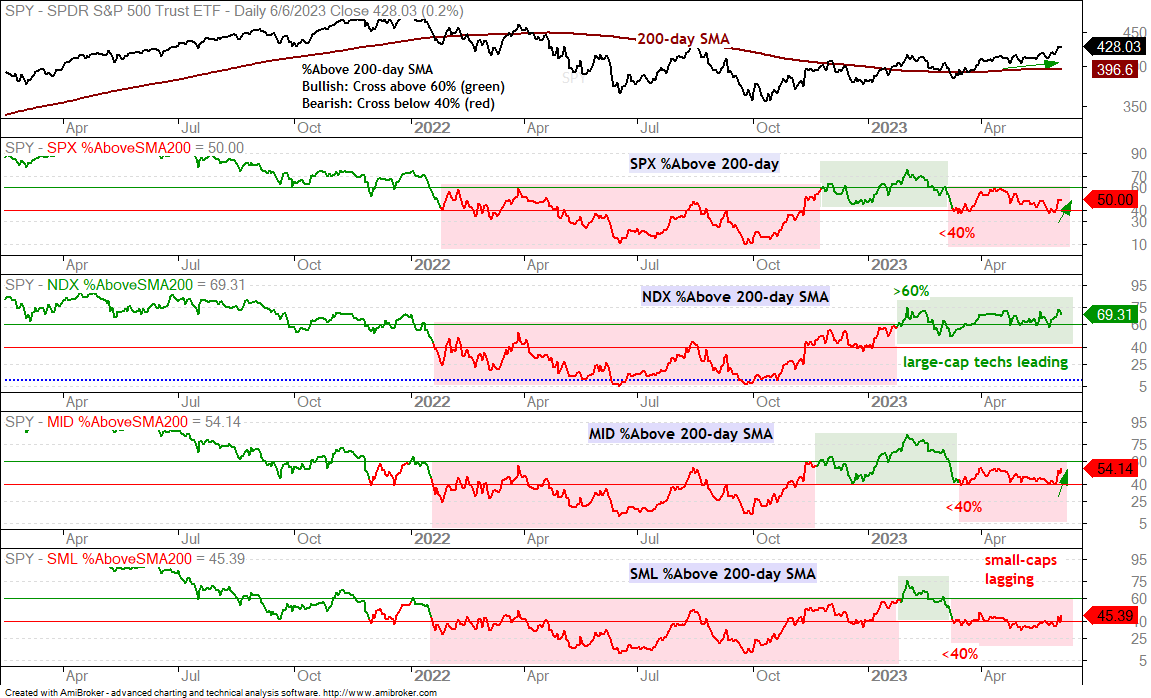
The percentage of stocks above the 200-day SMA increased for the S&P 500 and S&P MidCap 400. $SPX %Above 200-day SMA was below 40% last week and moved to 50%. $MID $Above 200-day SMA was at 40% last week and moved to 54% (green arrows). This shows a sharp increase in upside participation and this is positive. Small-caps remain the laggard overall because just 45.39% of S&P SmallCap 600 components are above their 200-day SMAs. Large-cap techs remain the leaders because almost 70% of Nasdaq 100 components are above their 200-day SMAs.
Short-term Breadth Indicators Pop
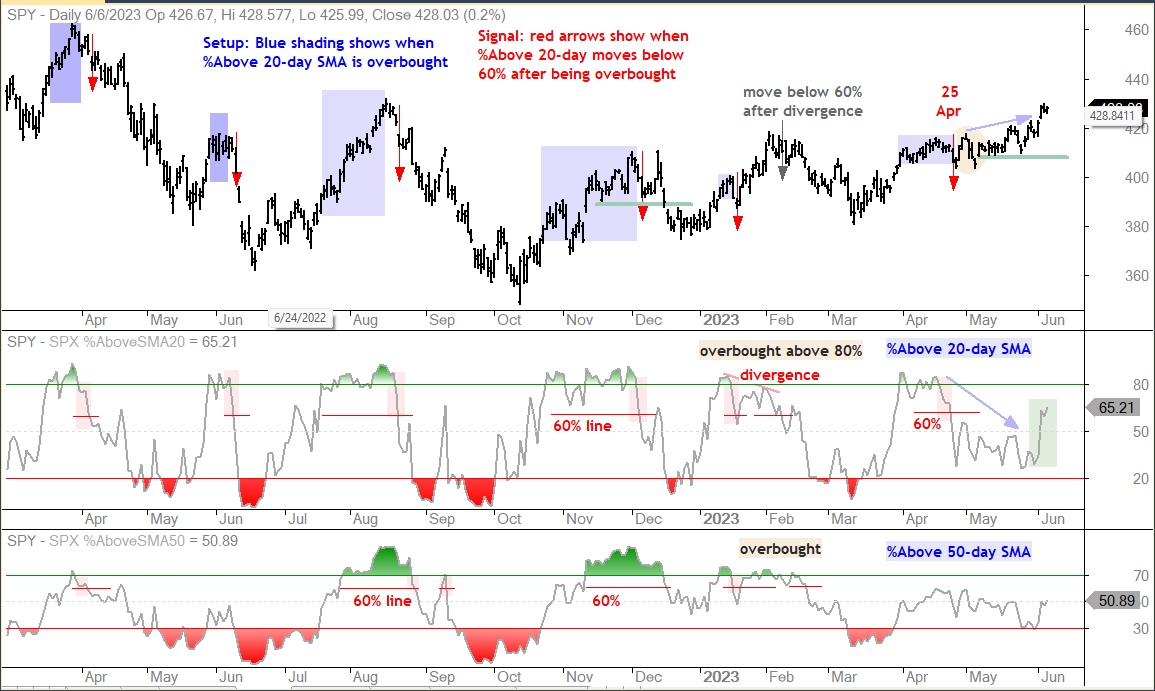
The bearish signal in SPX %Above 20-day SMA did not work as the indicator surged above 60% and the index extended its gains. SPX %Above 50-day SMA also popped with a move above 50%. There are two lessons here. First, the Composite Breadth Model was bullish and the 5-day SMA was above the 200-day SMA for SPY. Thus, the bigger trend and bullish CBM held the trump cards. Second, making money on the downside is very difficult and often not worth the hassle.
SPY: An Uptrend Since October and Flag Breakout
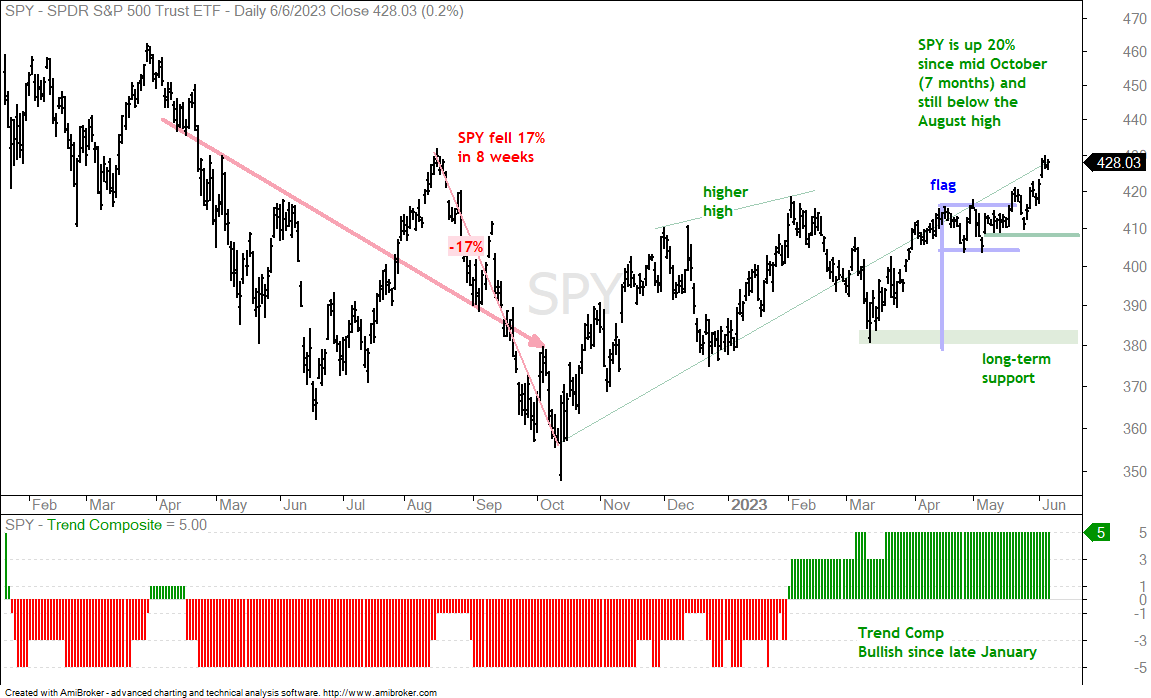
The S&P 500 SPDR (SPY) extended on its flag breakout with a move above 420 the last few days. Overall, the big trend is up with higher lows and higher highs since the first higher high (early February). Short-term, SPY surged from mid March to mid April, formed a flat flag and broke out to signal a continuation higher. The lows from mid to late May mark first support at 408. The March lows mark long-term support at 380.
S&P 500 EW ETF Reflects Broadening Participation
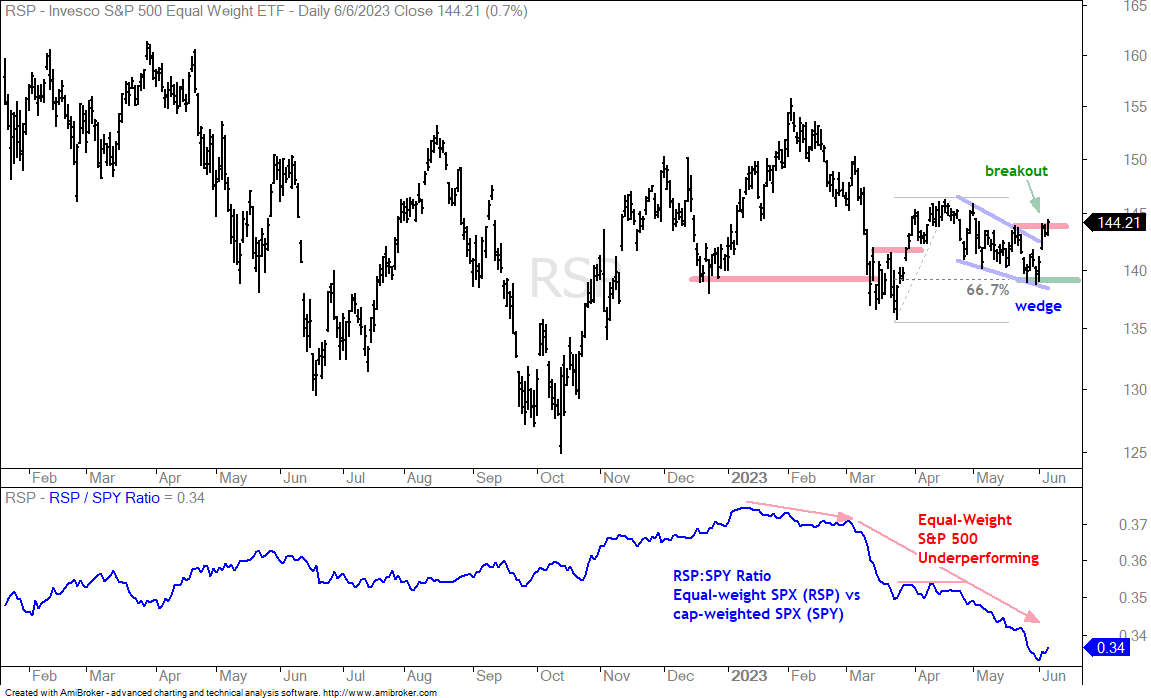
The S&P 500 EW ETF (RSP) is showing signs of life with a wedge breakout the last few days. This also signals that upside participation is expanding. The falling wedge retraced around 66.7% of the prior advance. The pattern and the retracement amount are typical for corrections. The breakout signals a continuation of the March-April advance with the late May lows marking first support.
S&P MidCap 400 SPDR Breaks Out with Big Surge
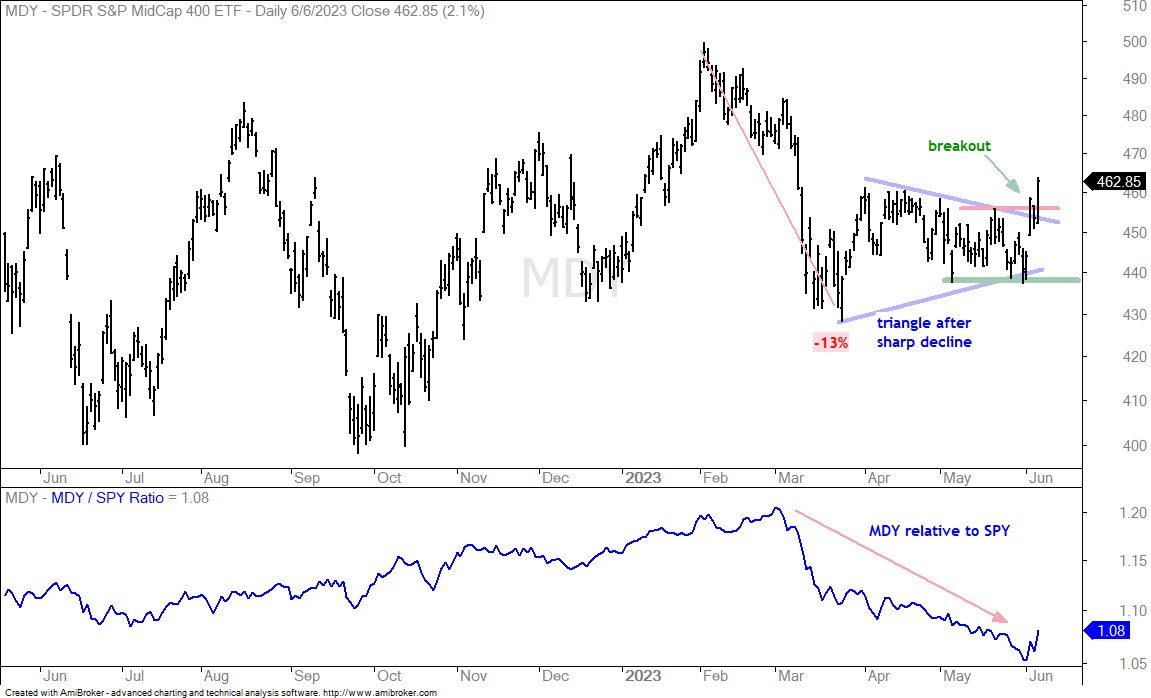
The S&P MidCap 400 SPDR (MDY) shot higher with a 5% surge the last four days. Overall, MDY fell sharply into mid March and then consolidated with a triangle. These are typically continuation patterns, but sometimes break out the other way. MDY clearly broke resistance and this is bullish.
QQQ Extends Parabolic Move
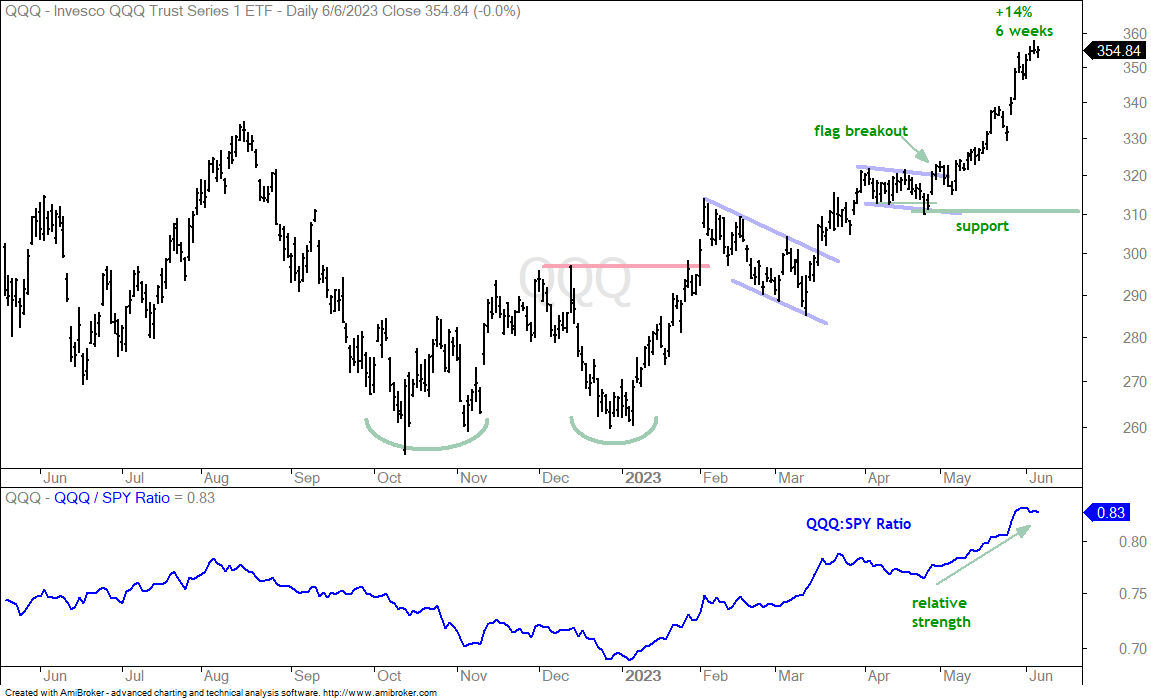
QQQ is in an uptrend since the double bottom breakout in early February. Short-term, the ETF is up over 14% in six weeks and going parabolic. Even though the steepness of the advance is unsustainable, nobody knows how far it will extend and when it will correct.
SOXX Pulls Back after Sharp Advance
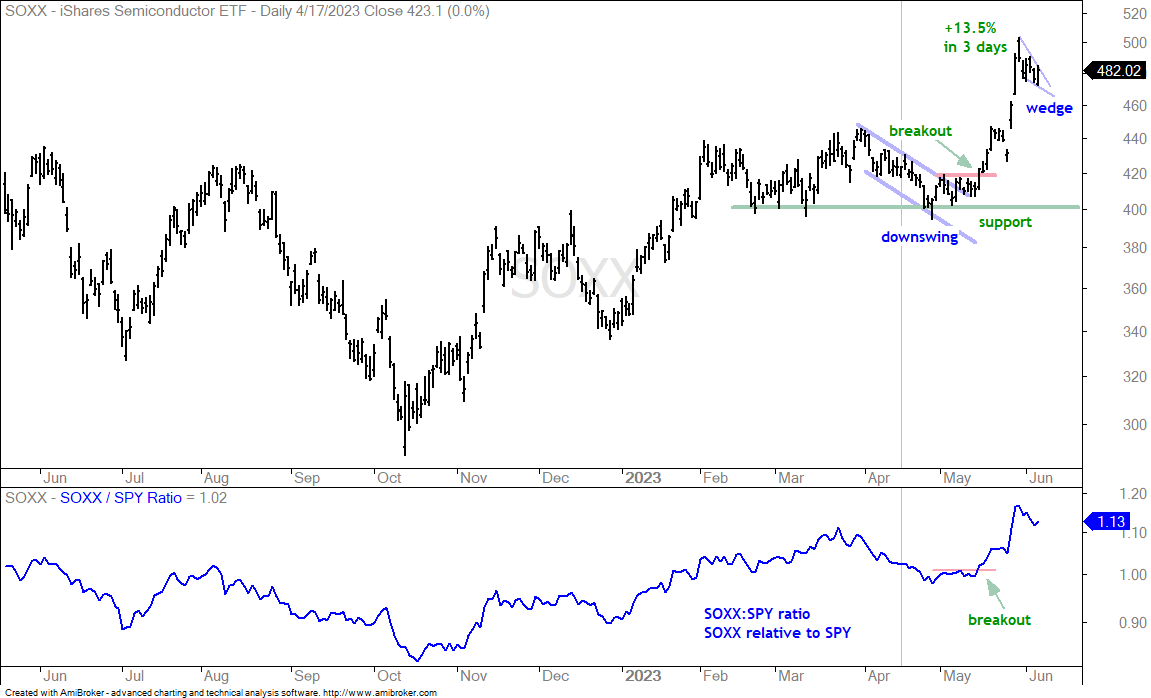
Several tech-related ETFs are in the same condition as QQQ. They are very extended short-term and ripe for a rest or corrective period. Over the last five weeks, the Cloud Computing ETF (SKYY) is up 24%, the Cybersecurity ETF (CIBR) is up 14.5%, the Internet ETF (FDN) is up 17% and the Software ETF (IGV) is up 16%. These are big moves in short timeframes and there are no setups on the charts. The chart below shows the Semiconductor ETF (SOXX) with a very short-term setup because the ETF pulled back the last six days. This setup is too short-term for my taste though.
ITB Leads New High List
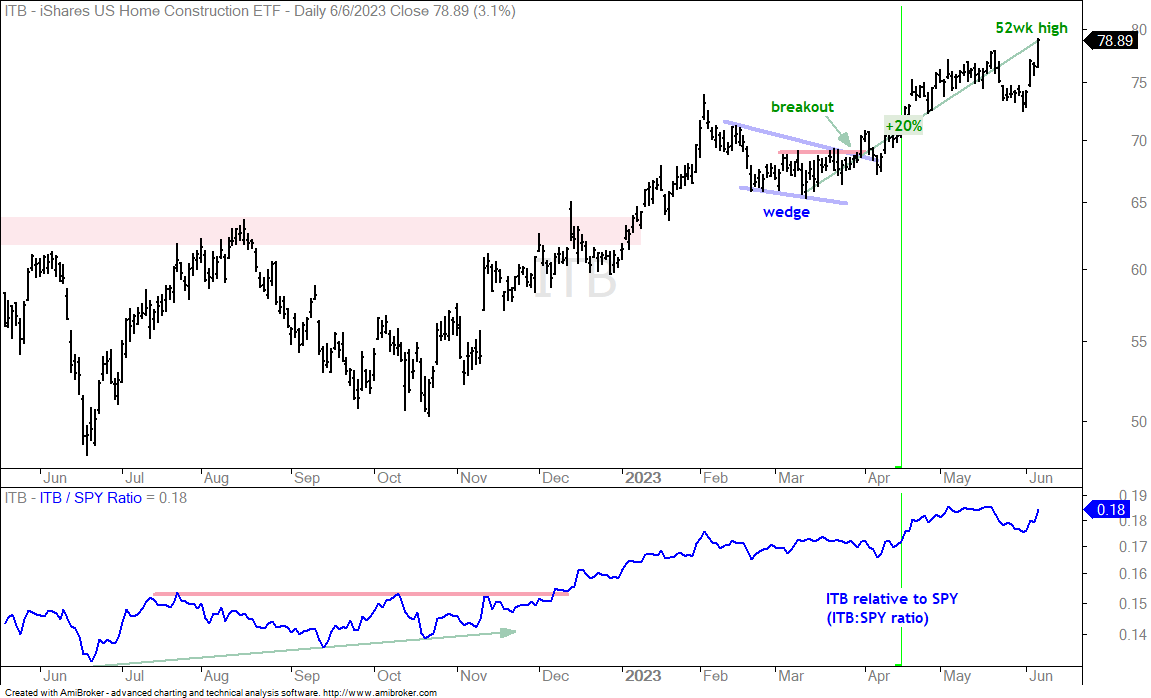
Of the 138 stock-based ETFs in the Master List, 16 recorded new highs over the last five trading days. This list includes: QQQ, SPHQ, QUAL, IWF, XLC, FDN, QTUM, ROBO, BOTZ, IRBO, IGV, ITB, XHB, ESPO, CARZ, TMFC. We see representatives from tech (QQQ, XLC, IGV, QTUM), housing (ITB, XHB) and autos (CARZ).
Finance SPDR Joins the Breakout Parade
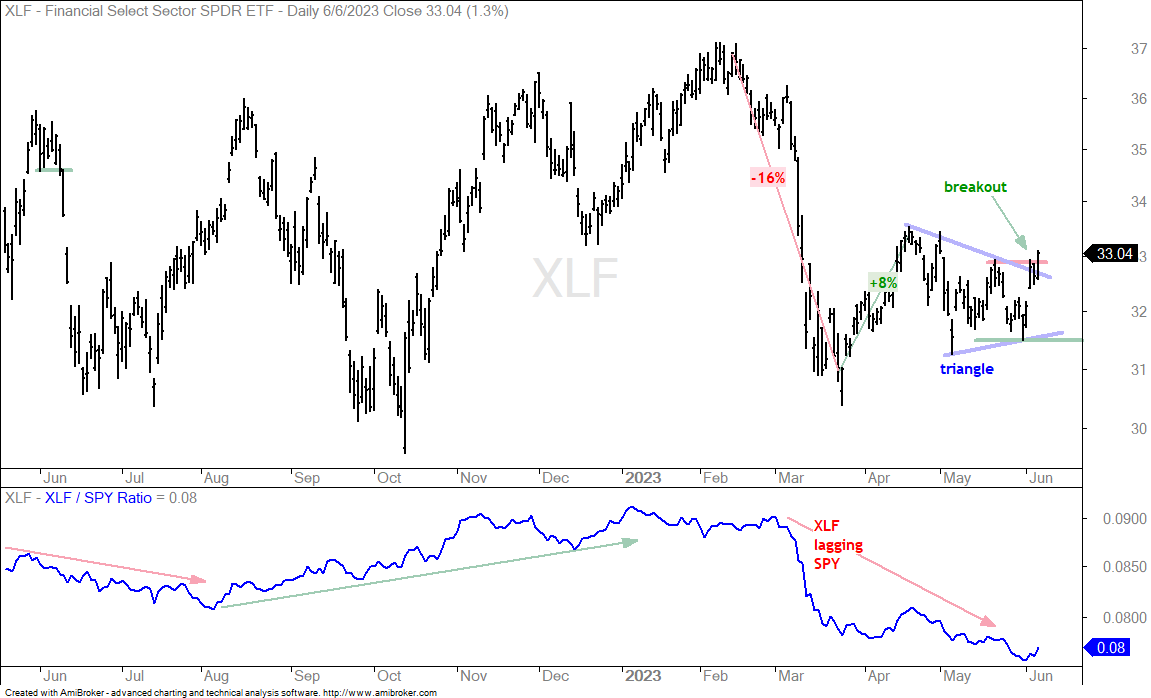
The Finance SPDR (XLF) bore the brunt of the selling pressure in March as it fell over 15%. The ETF got an oversold bounce from mid March to Mid April and then consolidated with a triangle. XLF is now showing signs of life as it gapped up last Friday and followed through this week for a triangle breakout.
Fintech ETF Plays Catch Up with a Delayed Breakout
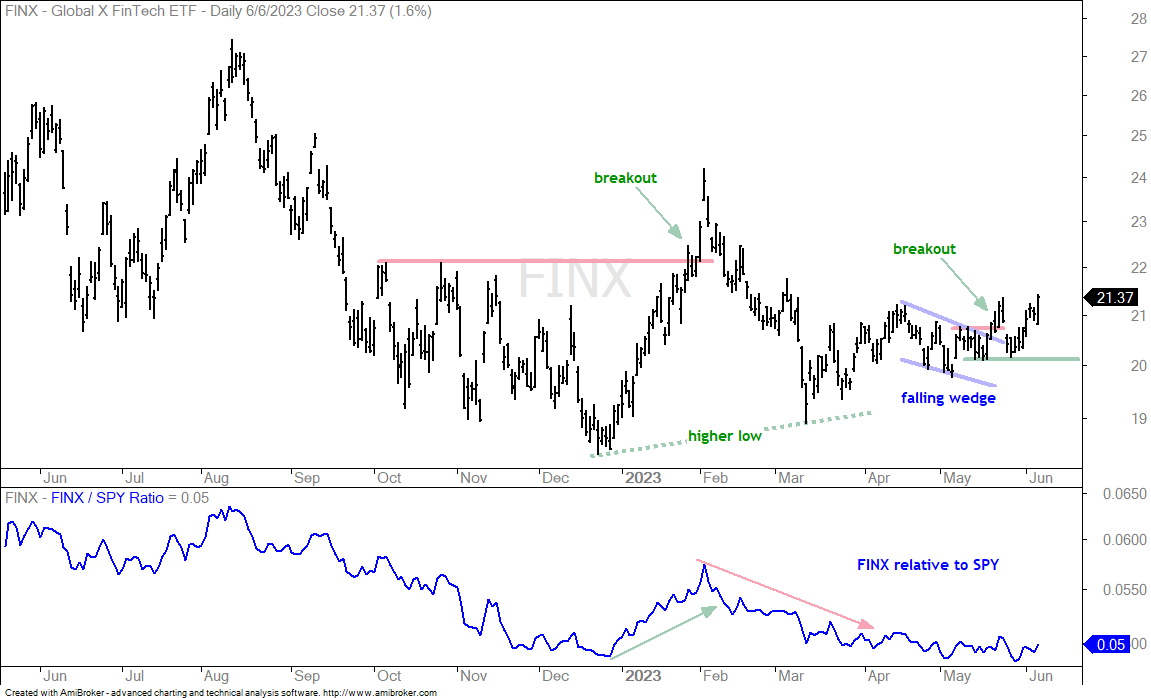
The FinTech ETF (FINX) is perhaps ready to play catch up with the rest of the tech-related ETFs. FINX formed a falling wedge from mid April to mid May and broke out in the second half of May. Notice the short and sharp pullback immediately after the breakout. Support at 20 held and the ETF is on the move again.
Mobile Payments ETF Surges towards Resistance
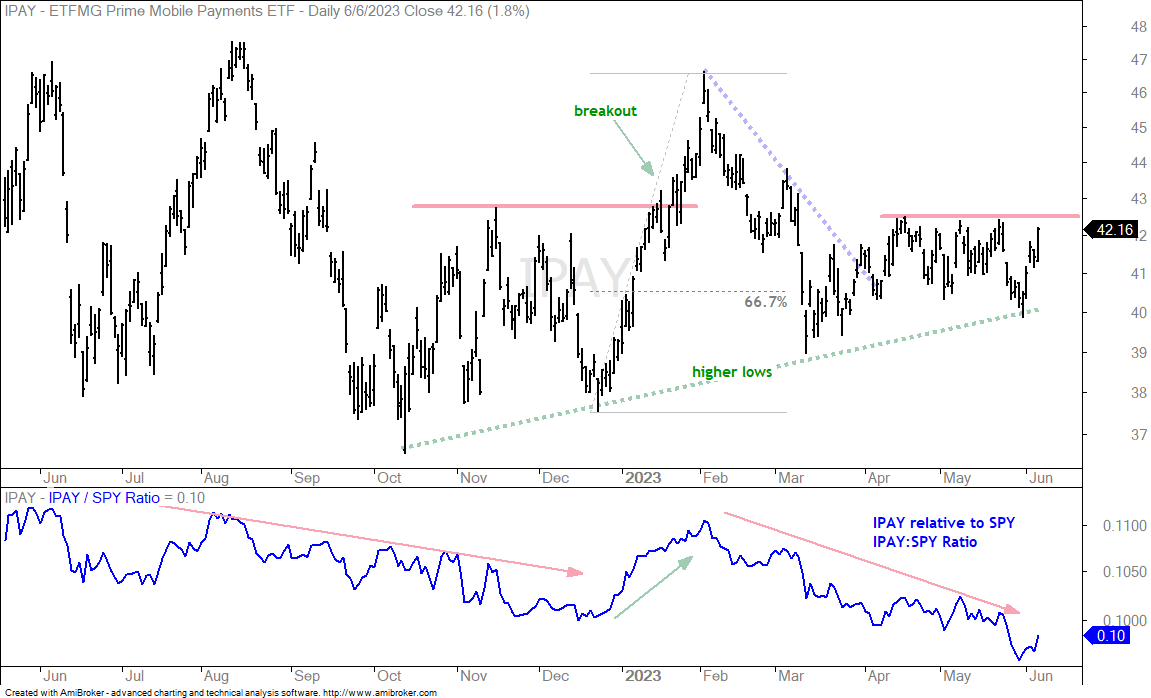
The Mobile Payments ETF (IPAY) is a relative of FINX. IPAY sports rising lows since the first higher low in December. The ETF stalled most of April and May with resistance marked at 42.50. A breakout here would be bullish and signal a continuation of the bigger uptrend.
Aerospace & Defense ETFs Bounce off Support
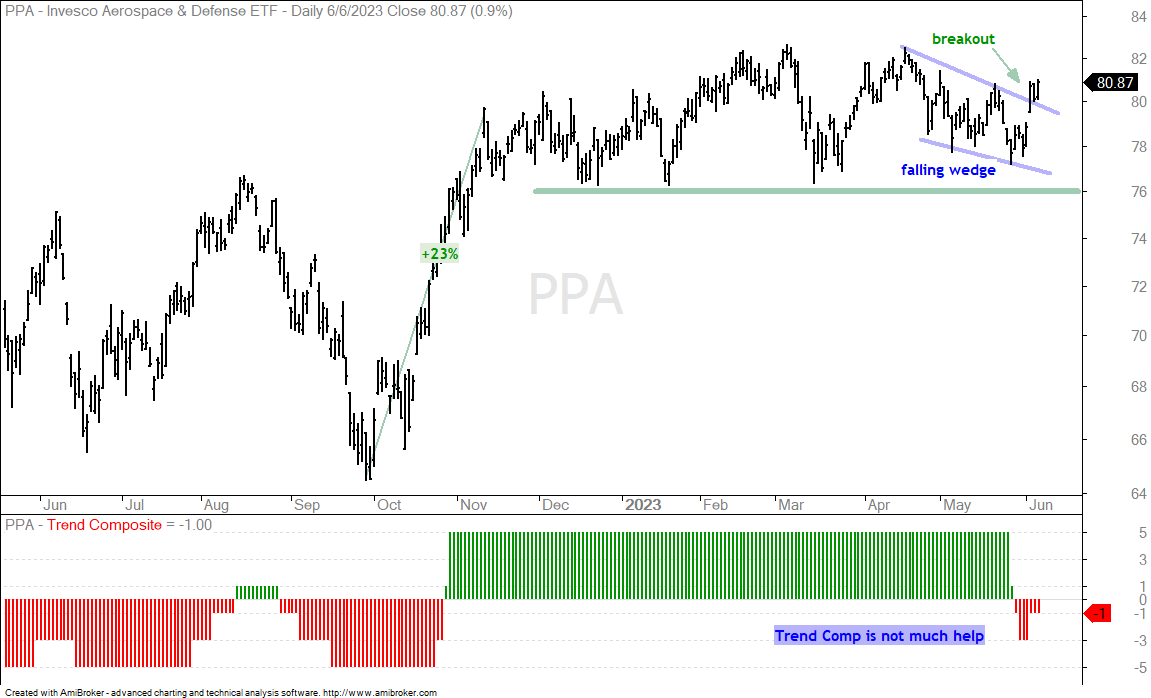
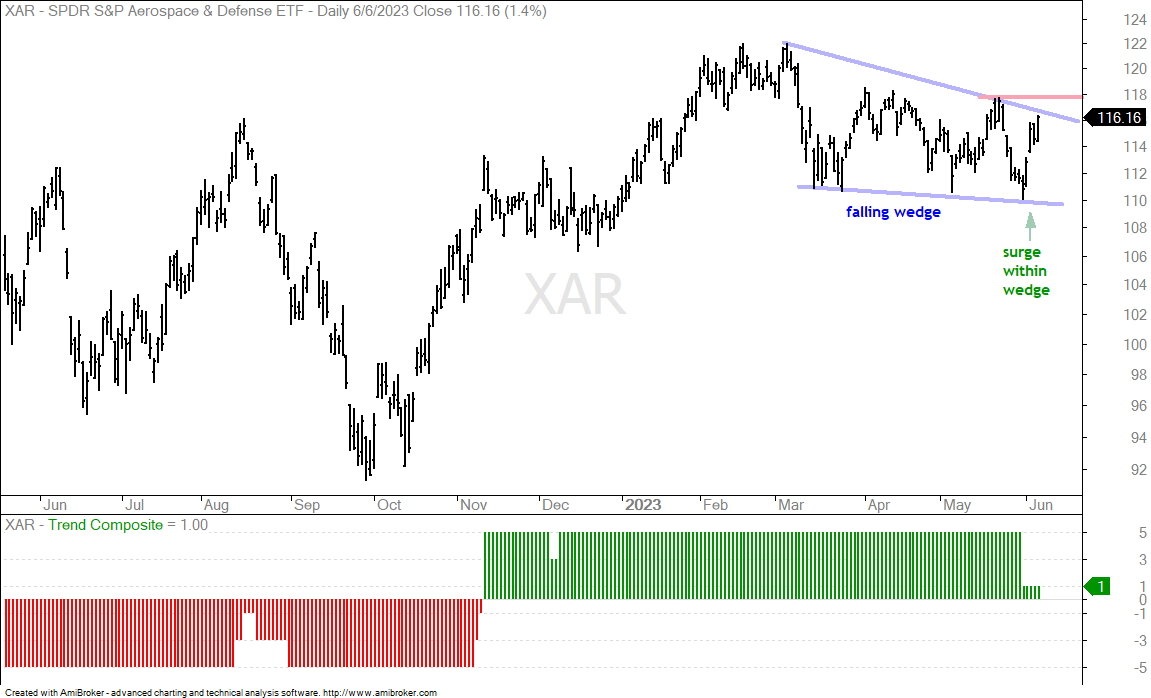
The Aerospace & Defense ETFs are getting bounces off support (ITA, PPA, XAR). The Trend Composite is not much help for ITA and PPA because it keeps whipsawing. Both ETFs surged in October-November and traded flat from December to June. The Trend Composite was positive from late October to late May, but turned negative on May 26th. Trend following indicators do not work well in trading ranges. Even though the Trend Composite turned negative, PPA did not break support and remained within its range. The ETF surged with the market from mid March to mid April, corrected with a falling wedge and broke out with a surge the last three days.
The next chart shows the Aerospace & Defense ETF (XAR) with a surge from late September to mid February and a falling wedge into June. This wedge represents a correction after the big advance. The recent surge above 116 is the first sign that XAR is going for a wedge breakout.
Airline ETF Follows Higher Low with a Breakout
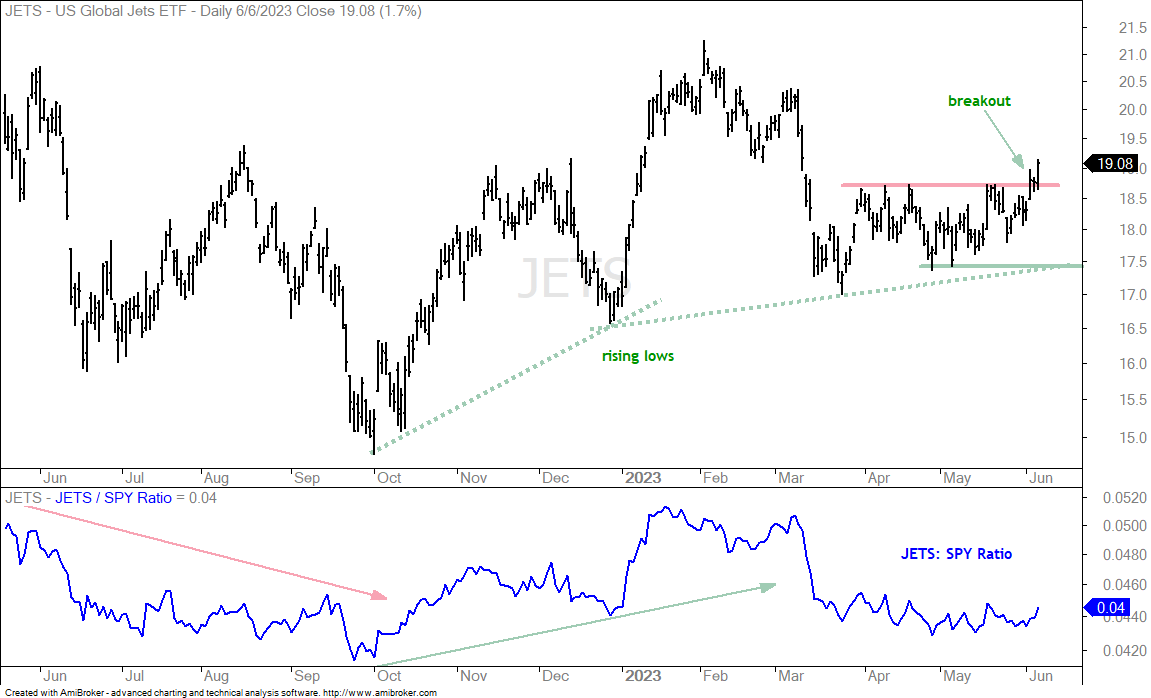
The Airline ETF (JETS) is starting to fly again with a breakout the last few days. Overall, the big trend is up with the first higher low in December and another higher low in March (green dashed lines). JETS fell sharply with the rest of the market in March, firmed into late May and broke resistance. This breakout is bullish.
Energy ETFs Firm at Support
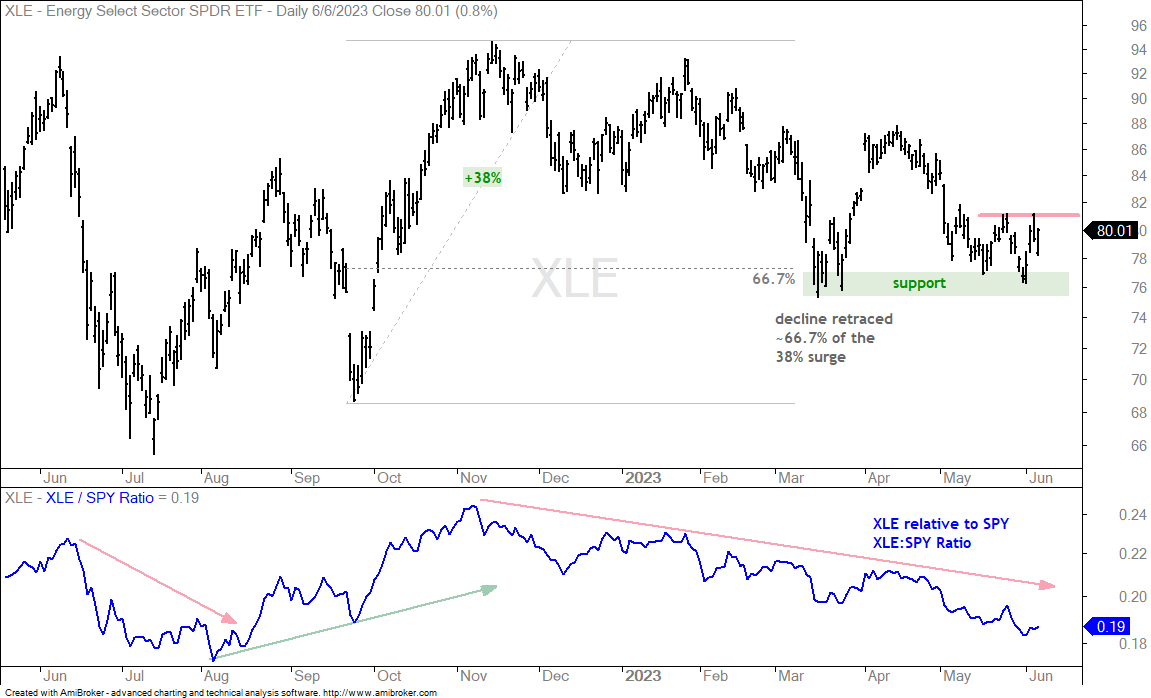
The energy ETFs could be setting up for breakouts. The first chart shows the Energy SPDR (XLE) retracing around 66.7% of the September-November advance with a decline into mid March. The ETF bounced into April and then fell back to the March lows (support). XLE firmed the last few weeks and a breakout at 81 would be bullish.
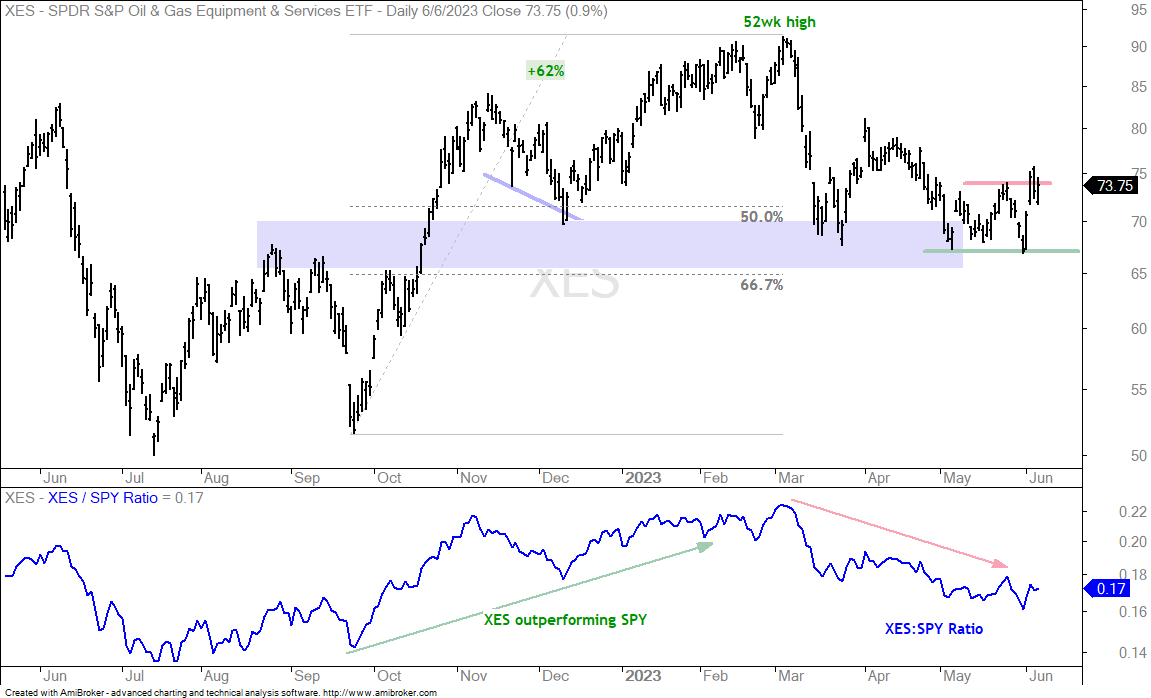
The next chart shows the Oil & Gas Equipment & Services ETF (XES) retracing 50-67% of the September to April surge with a sharp decline in March. The ETF also bounced into April and then tested the March lows in May-June. XES is already going for a breakout with the move above resistance at 74 on Friday.
ARK 3D Printing ETF Breaks Out of Big Wedge
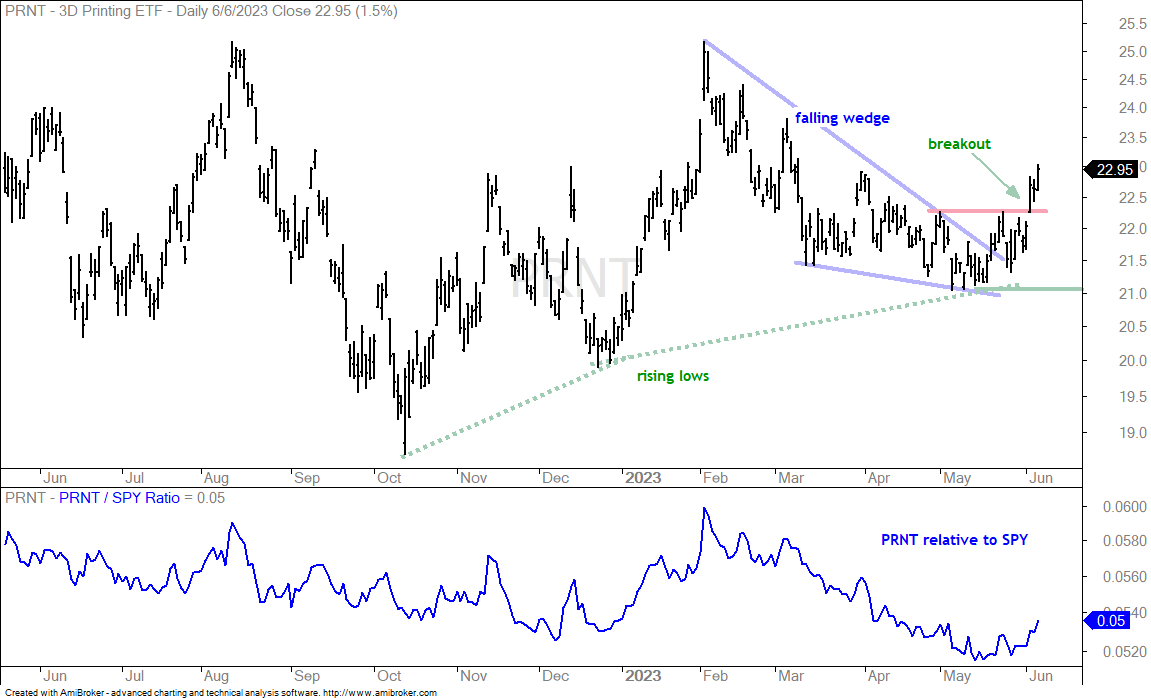
The ARK 3D Printing ETF (PRNT) shows a move towards risk with a big surge and breakout over the last three days. The chart shows a rather steep falling wedge correction that ultimately reversed above the December low. Thus, we have rising lows over the last six to nine months. The wedge is considered a correction within the bigger uptrend and the breakout is bullish.
BLOK Forms Bullish Cup-with-handle
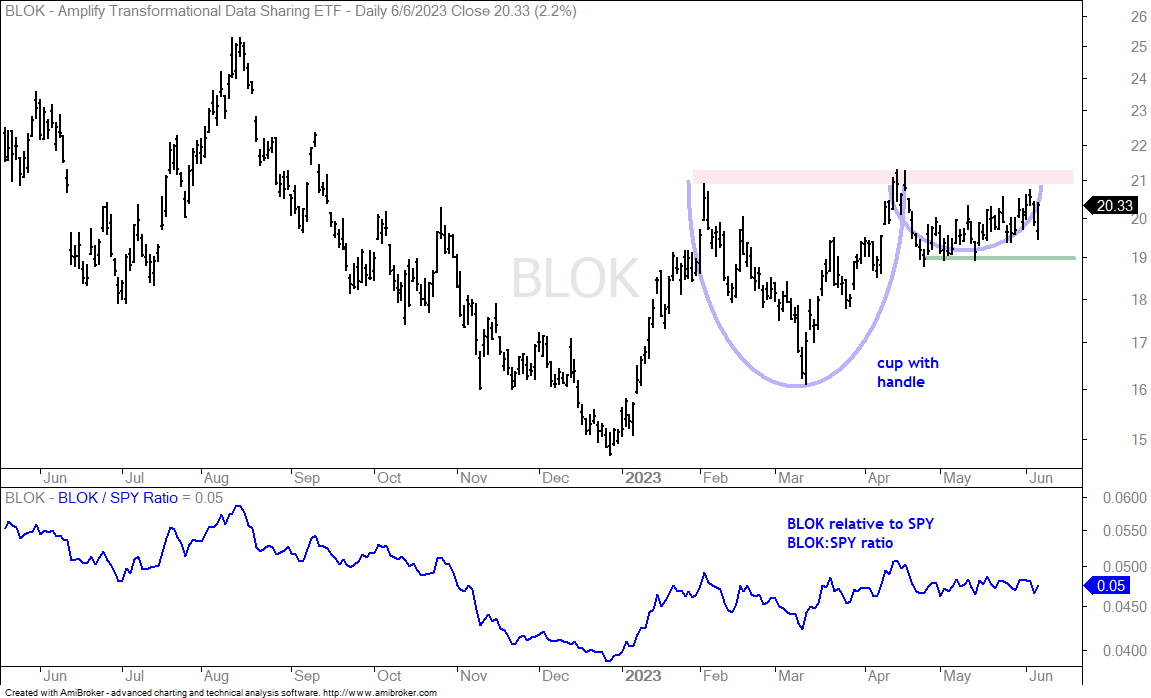
BLOK is the Transformational Data Sharing ETF, whatever the heck that means. It holds stocks related to blockchain and crypto. The chart shows BLOK forming a cup-with-handle, which is a bullish continuation pattern. Bullish continuation patterns must form after an advance or within an uptrend. The red shading marks rim resistance and a breakout here would signal a continuation higher.
Dollar Bullish ETF Surges to Resistance
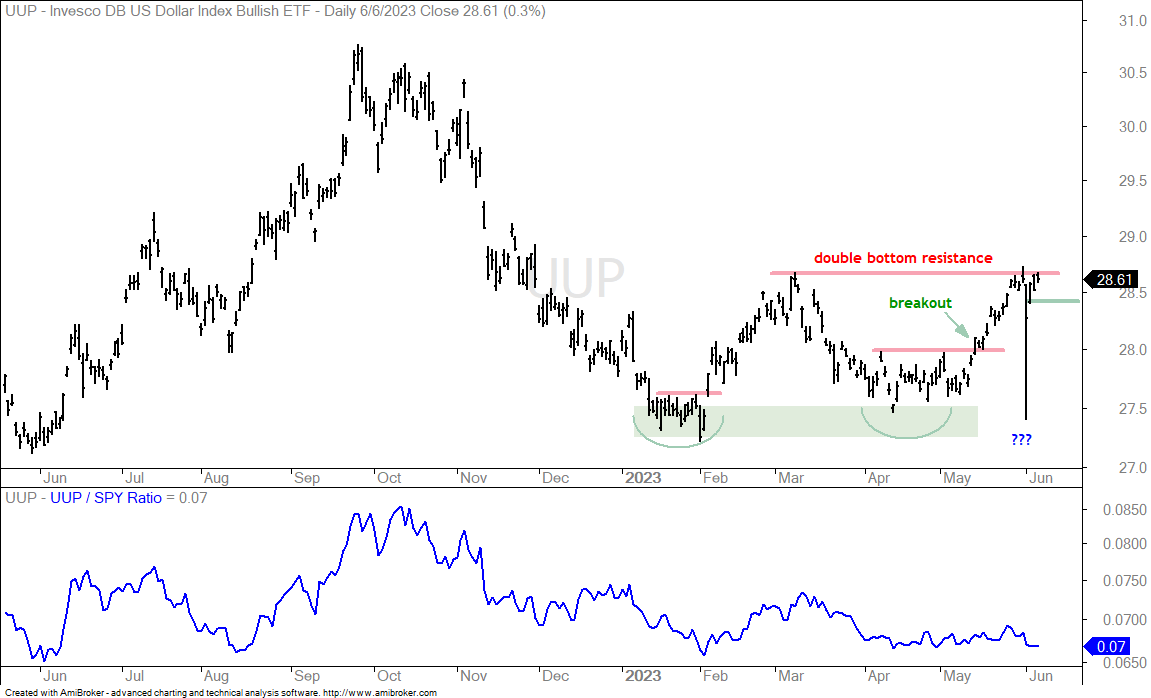
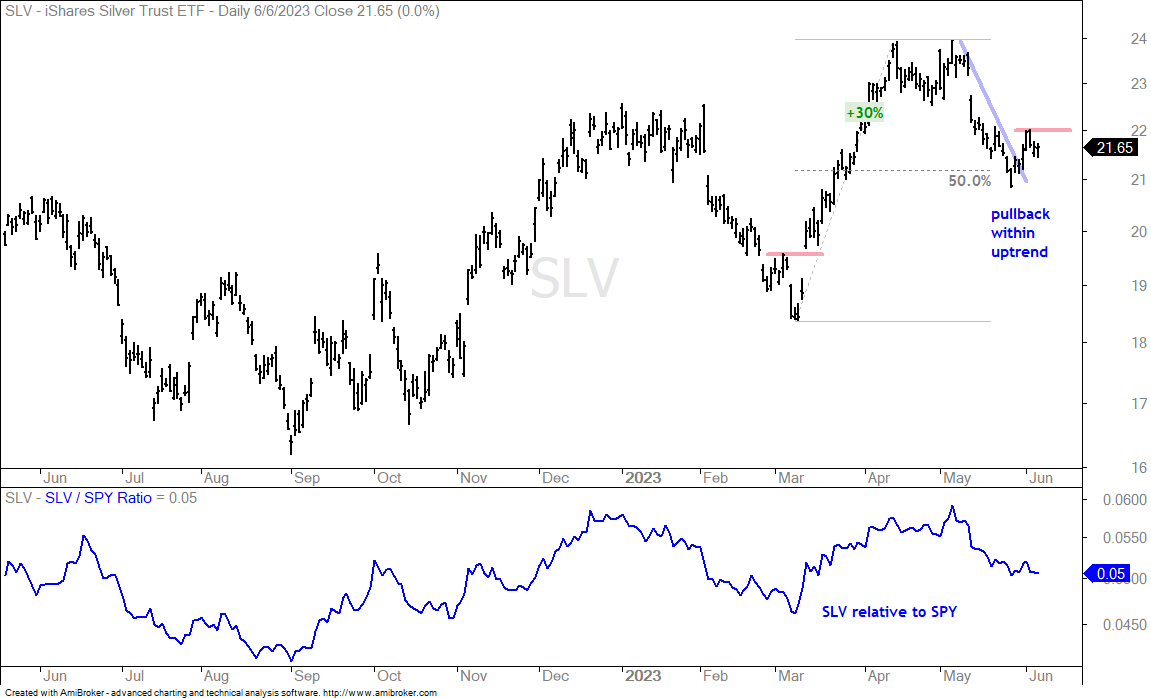
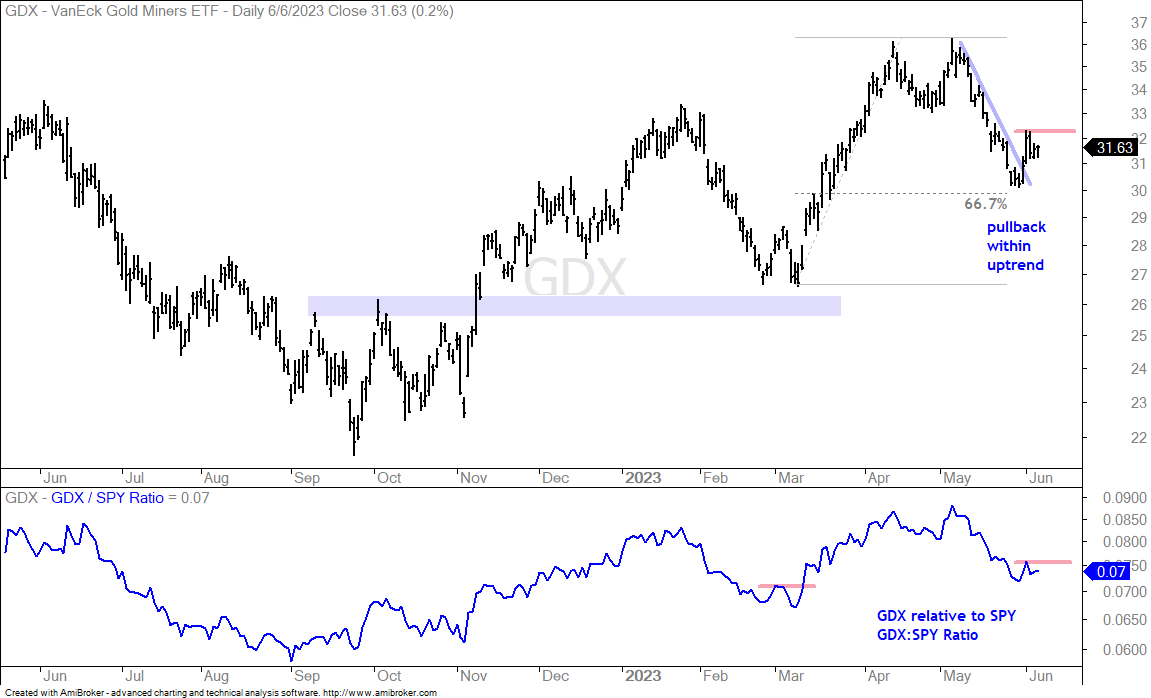
Before looking at some metals-related ETFs, I will cover the Dollar Bullish ETF (UUP) because there is an inverse relationship. Gold usually falls when the Dollar rises and rises when the Dollar falls. UUP was up 3.1% in May and the Gold SPDR (GLD) fell 1.3%. The chart shows UUP with a double bottom taking shape and a break above the March high would confirm this pattern. As long as UUP is short of a breakout, I will be watching the upswing since early May for clues. Ignoring the spike below 27.5, I am setting short-term support at 28.35 and a break here would be short-term bearish. Such a move could be positive for metals-related ETFs.
GLD Pulls Back within Bigger Uptrend
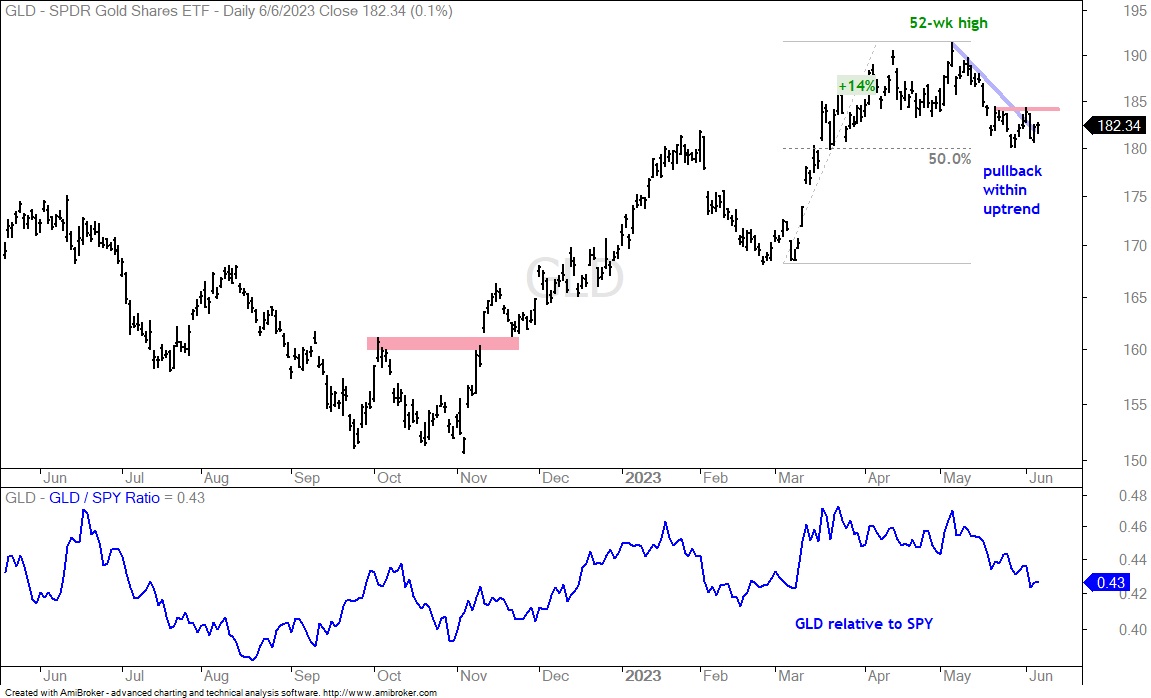
The next chart shows GLD hitting a 52-week high in early May and then retracing 50% of the 14% prior advance. This looks like a pullback within a bigger uptrend and GLD made its first breakout attempt last week. The ETF fell back sharply on Friday and this could be the post-breakout pullback. A second surge and break above resistance at 184 would be bullish.
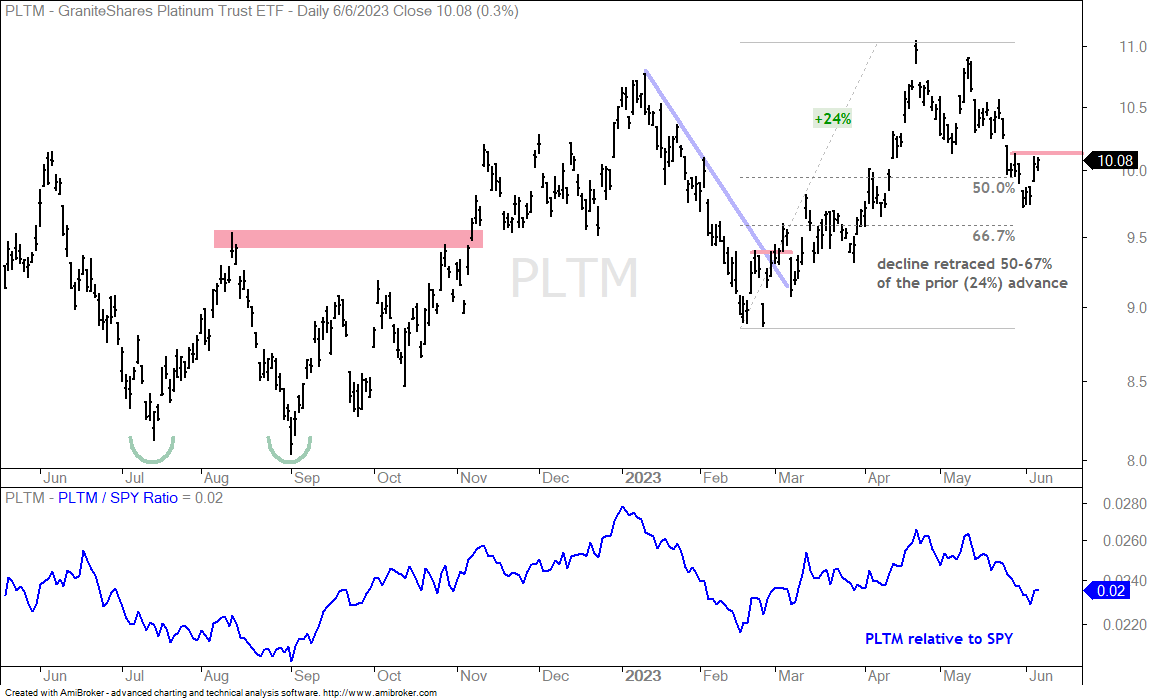
Platinum ETF Firms in Key Retracement Zone
The next chart shows the Platinum ETF (PLTM) retracing 50-67% of the prior advance and surging the last two days. The decline started from a 52-week high and looks like a pullback within a bigger uptrend. A breakout above the late May high (resistance) would be short-term bullish.
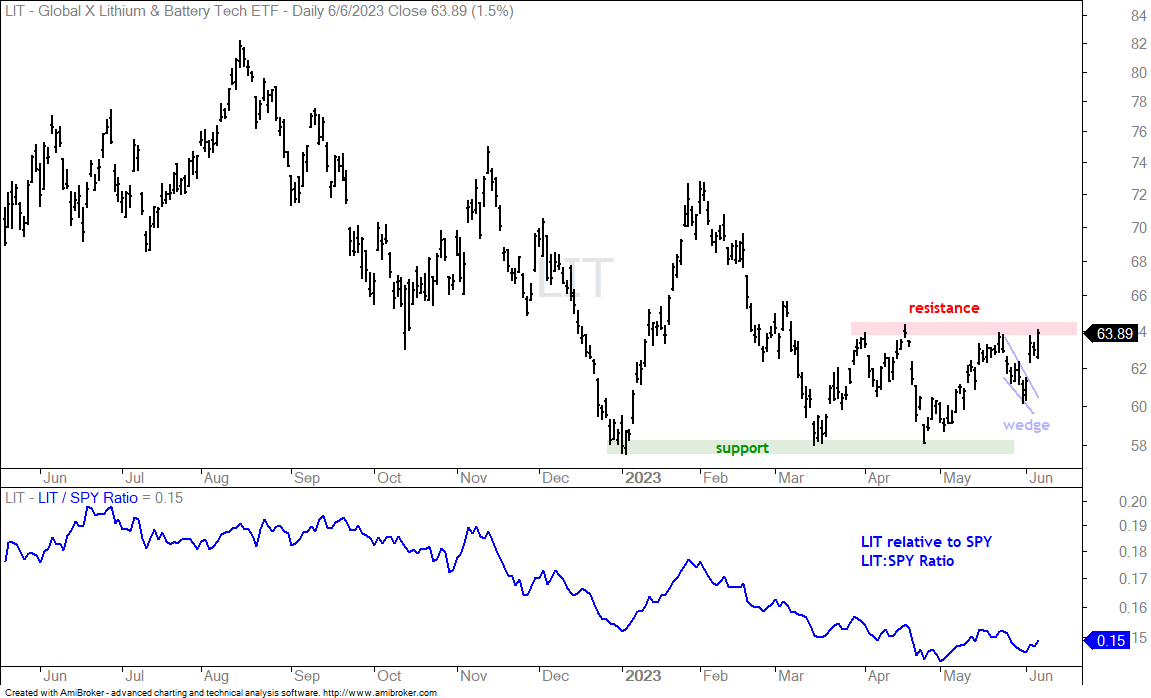
Lithium Battery Tech ETF Surges from Support to Resistance
The Lithium Battery Tech ETF (LIT) found support in the 58 area from early January to April. The ETF advanced to resistance and then fell back into June with a small wedge. LIT broke out of this wedge and is challenging resistance. A breakout would be bullish.