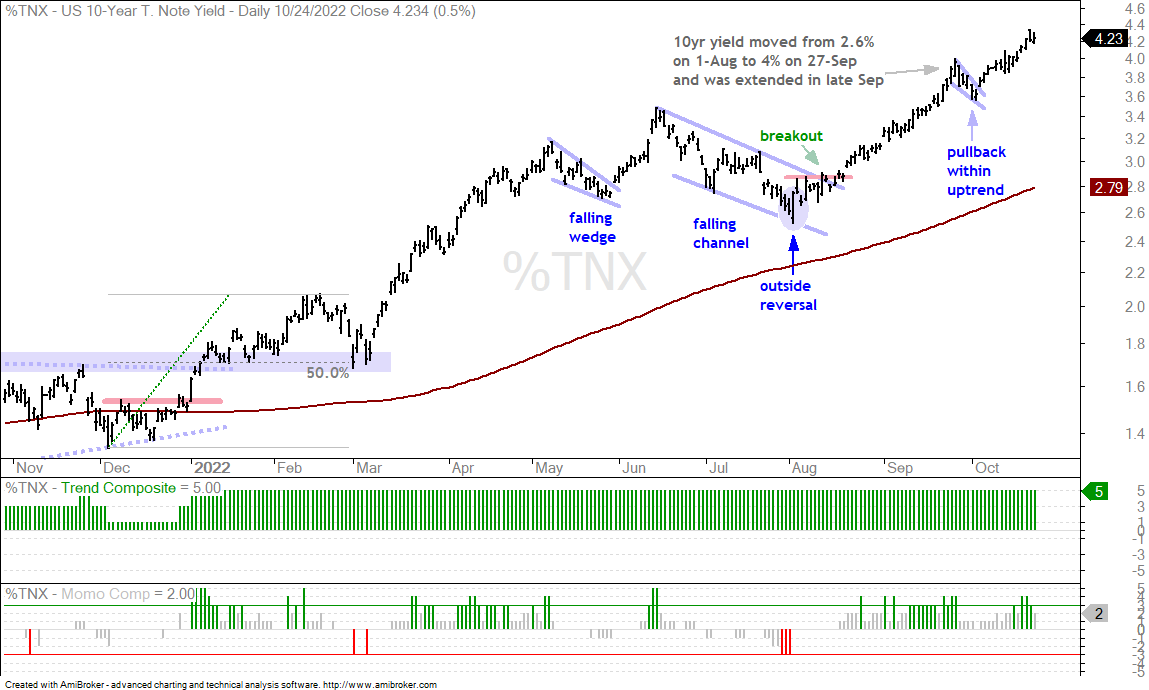
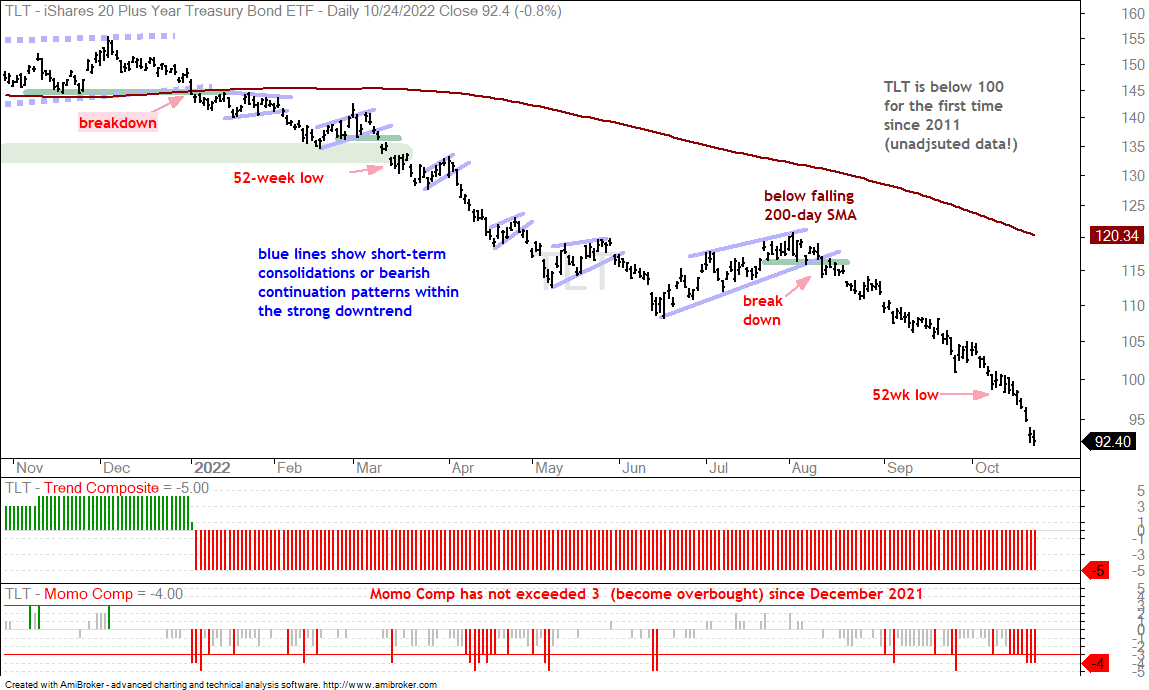
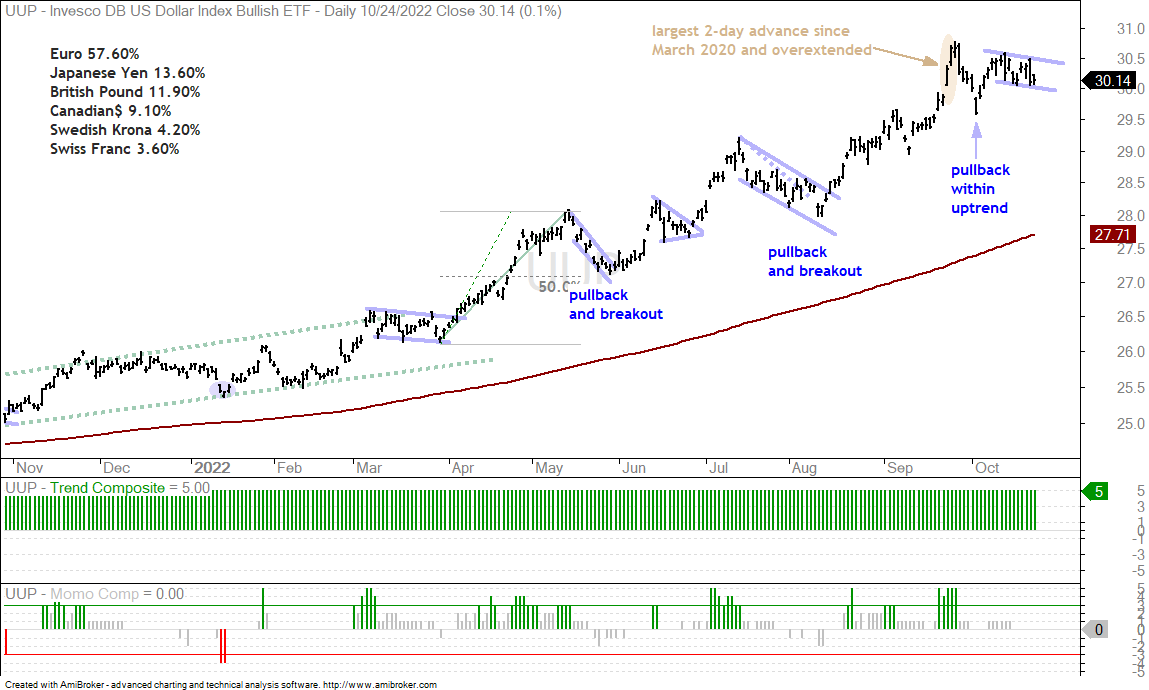
It’s a bit of a mess out there, both fundamentally and technically. Technically, we have new lows in Chinese stock indexes after sharp declines on Monday, and the major US and European indexes are in downtrends. The major index ETFs here in the US became oversold in late September and turned choppy in October. Perhaps oversold conditions and bullish seasonal patterns for Q4 set the stage for a bear market bounce. It looks more like a volatile consolidation within a downtrend than an actual bounce to me. Volatility could continue the next few weeks with earnings season underway. I will just keep the bigger trends in mind. It is a bear market for stocks, a bear market for US Treasury bonds, Treasury yields are rising with the 10-year exceeding 4.2% and the Dollar remains in an uptrend (risk off).
About the ETF Trends, Patterns and Setups Report
This report contains discretionary chart analysis based on my interpretation of the price charts. This is different from the fully systematic approach in the Trend Composite strategy series. In this ETF Trends, Patterns and Setups report, I am looking for leading uptrends and tradable setups within these uptrends. While I use indicators to help define the trend and identify oversold conditions within uptrends, the assessments are mostly based on price action and the price chart (higher highs, higher lows, patterns in play). Sometimes the chart assessment can be at odds with the indicators.
This Week's Commentary Schedule
Tuesday – 25 October: Market-ETF Report and Signal-Rank Table Update
Wednesday – 26 October Market-ETF Video and Market Regime Update
Thursday – 27 October: Market-ETF Report and Signal-Rank Table Update
Saturday – 29 October: ETF Signal and Rank Table
Composite Breadth Model Remains Bearish
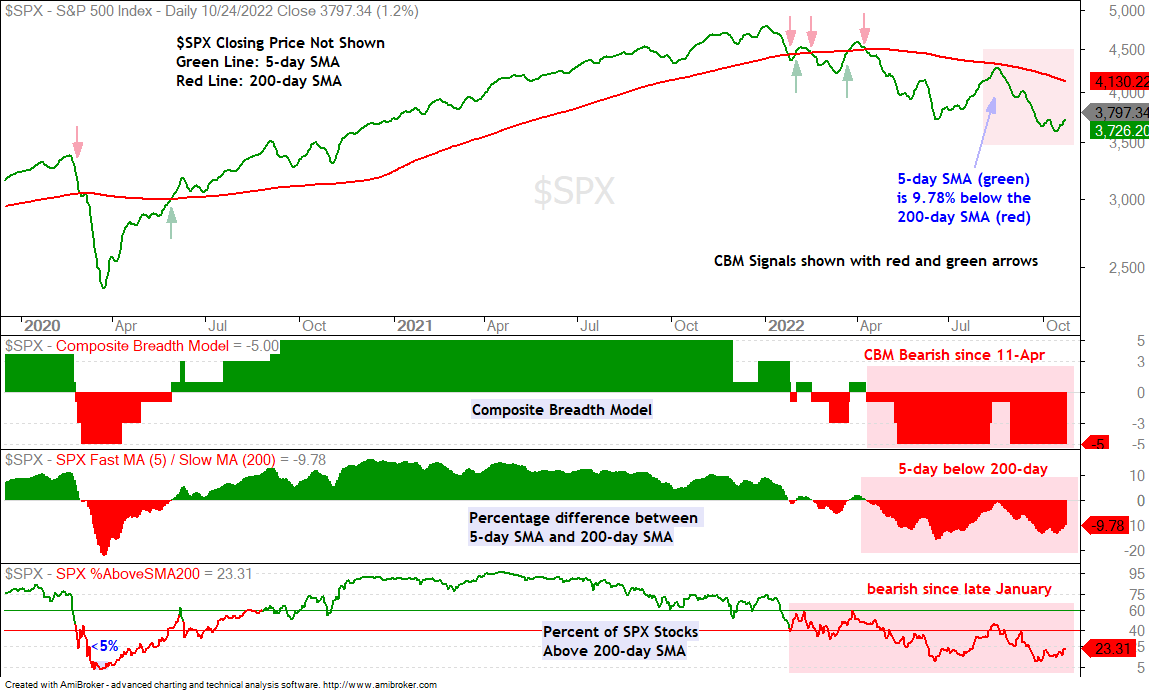
The Composite Breadth Model (CBM) remains at -5, which means all five inputs are bearish. Breadth and the tape are bearish. The 5-day SMA for the S&P 500 is around 10% below the falling 200-day. The long-term trend for the most important US benchmark is down. Around 23.3% of S&P 500 stocks are above their 200-day SMAs, which means more than 75% of S&P 500 components are in long-term downtrends. Clearly, the weight of the evidence is bearish.
You can learn more about my chart strategy in this article[1] covering the different timeframes, chart settings, StochClose, RSI and StochRSI.
Energy ETFs and Brazil Trigger Bullish
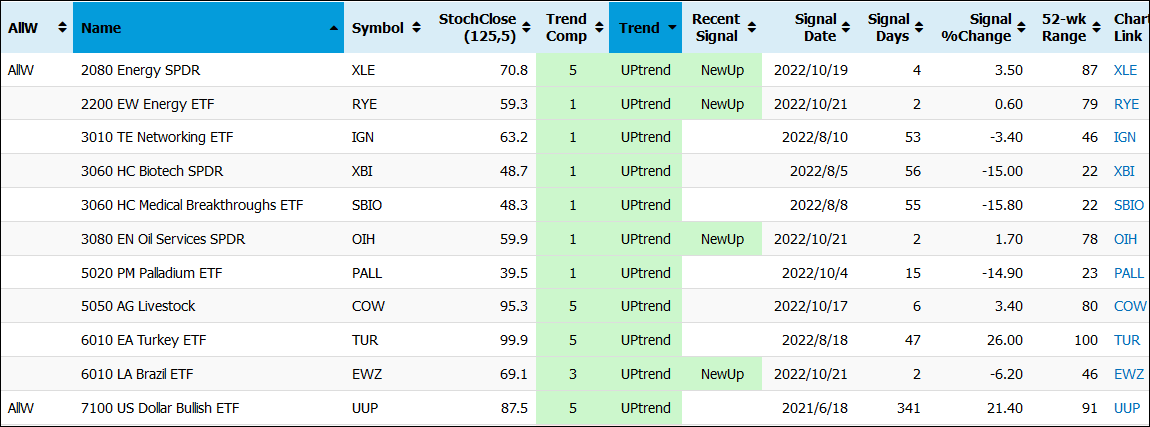
There were some new uptrend signals over the past week with the Trend Composite turning positive for the Energy SPDR (XLE), Oil Services ETF (OIH) and EW Energy ETF (RYE). All three broke above their August highs with big moves the last five days. There will be more on energy later in this report.
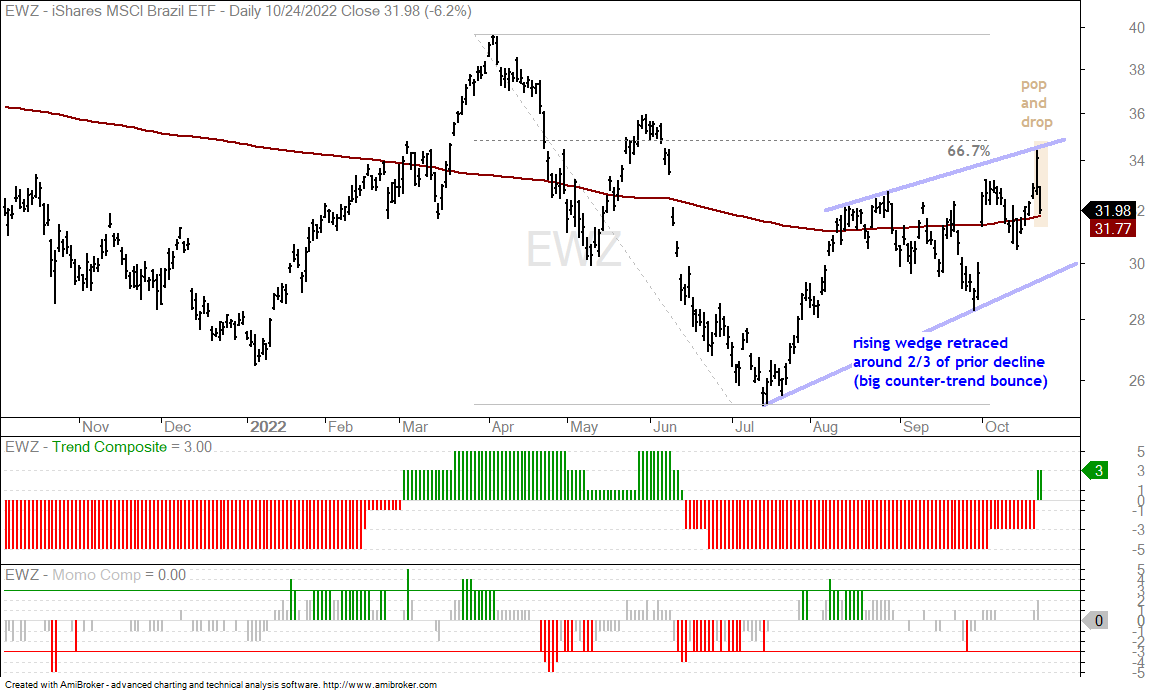
The Brazil ETF (EWZ) also triggered bullish last week, but did a sharp pop and drop over the last two days. Almost all country index ETFs are in downtrends and it is pretty much a global bear market for stocks. EWZ and TUR are holding up better than the rest, but trying to pick the winner in a global bear market is similar to picking a winning stock-based ETF in a bear market environment. The global bear market is the dominant force at work and often affects all stock-based ETFs, regardless of country or industry group.
The Momentum Composite aggregates signals in five momentum-type indicators to identify short-term overbought and oversold conditions. This indicator is part of the TIP Indicator Edge Plugin for StockCharts ACP[2]
QQQ Leads Lower as IWM Stalls
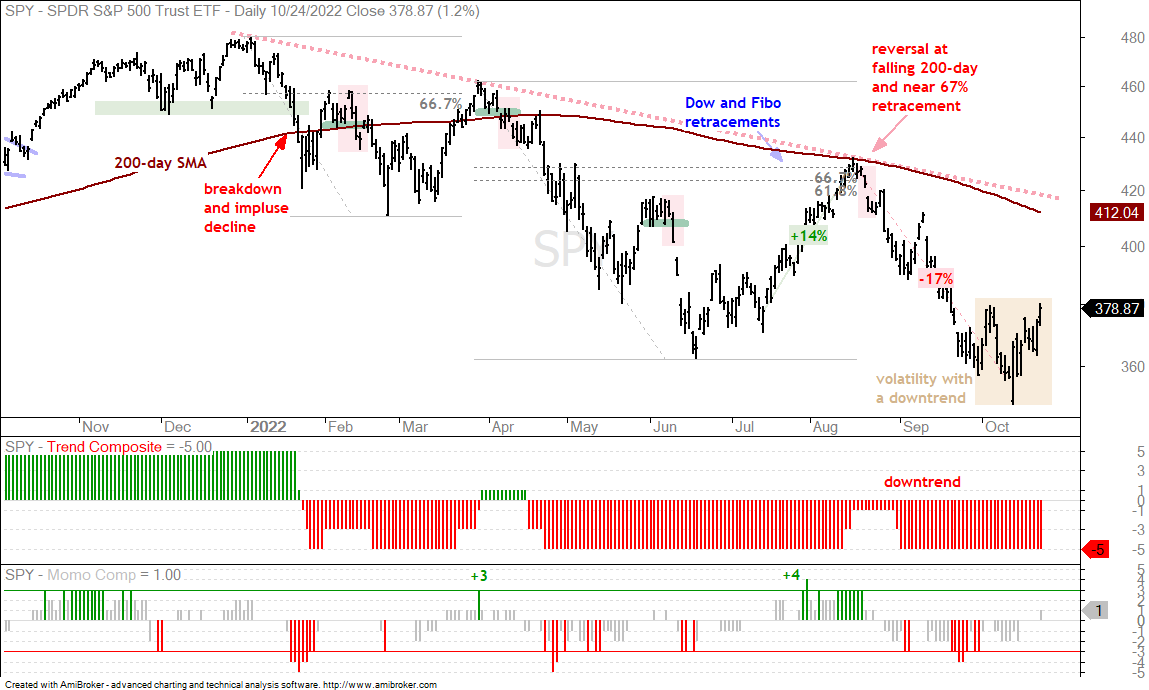
SPY advanced 6.26% the last eight days and closed above its early October closing high. While this is technically a higher high, it comes after a lower low from late September to mid October. As such, this bounce is still considered a counter-trend bounce within a bigger downtrend. We have also seen an uptick in volatility over the last four weeks with a 5% surge in early October, a 6% plunge into mid October and a 6% bounce the last eight days (yellow shading). SPY is getting short-term overbought after the latest bounce so the going could soon become tougher for the bulls.
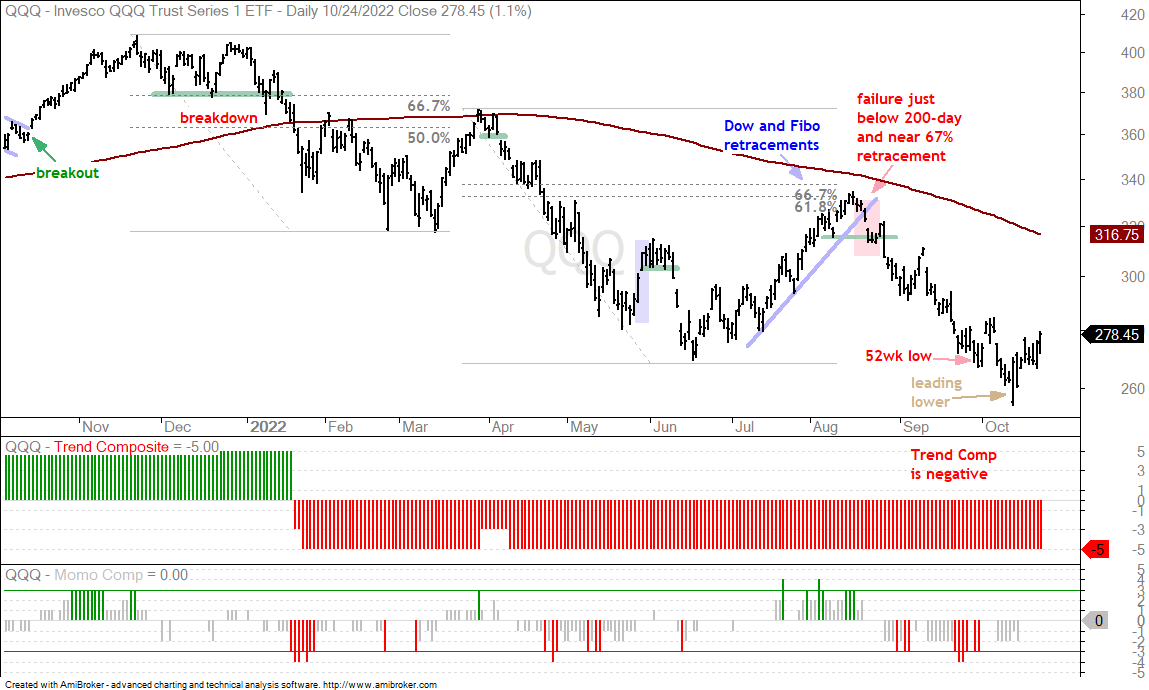
QQQ also bounced the last eight days, but it led the way lower into mid October and has yet to exceed its early October high. QQQ shows relative weakness and this is weighing on the broader market because Nasdaq 100 stocks still account for some 35% of the S&P 500. The Technology sector accounts for 26.36% and the Communication Services sector weighs in at 8%. Amazon and Tesla are part of the Consumer Discretionary sector. Overall, QQQ is also in a long-term downtrend with the Trend Composite negative and the price chart showing lower lows and lower highs since the January breakdown.
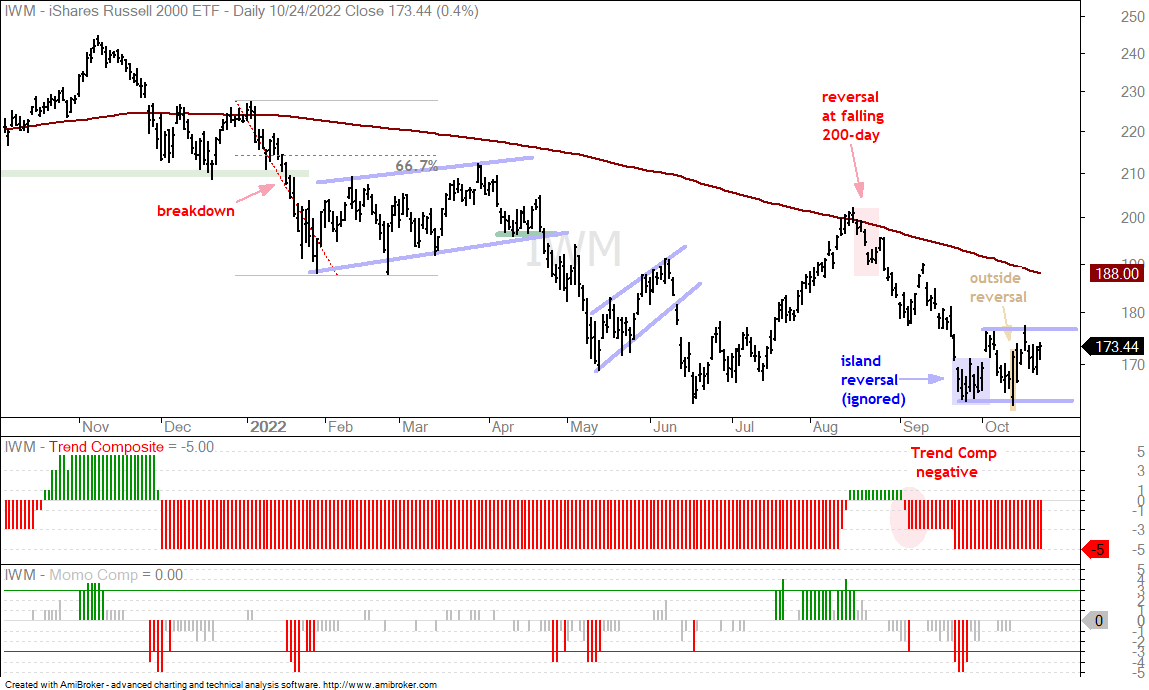
The Russell 2000 ETF (IWM) is consolidating within a downtrend. The ETF hit a new low in late September and then moved sideways the last five weeks (blue lines). There was an island reversal in early October and no follow through. There was a big outside reversal in mid October and again no follow through. While a break above the consolidation highs would be short-term positive, it would still be a counter-trend bounce within a bigger downtrend. It is risky to buy short-term breakouts when the bigger trend is down.
Downtrend in Oil Hinders Breakout Attempt (plus DBE)
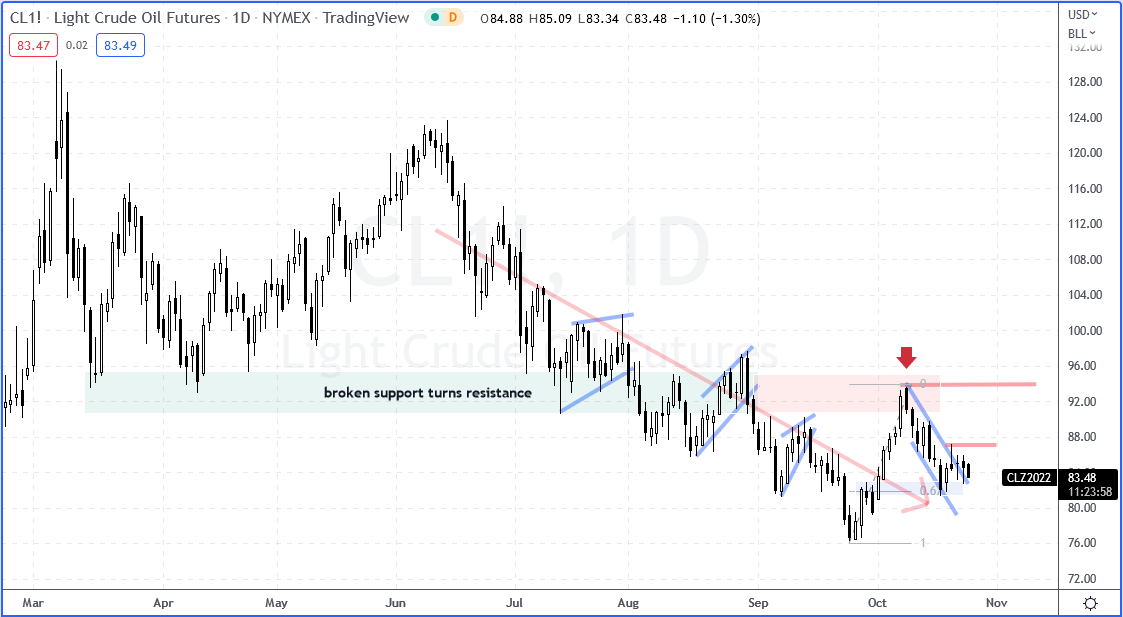
Oil remains in a long-term downtrend and its short-term breakout is struggling. Light Crude Futures (CL1!) have been trending lower since mid June with a series of lower lows and lower highs (red arrow-line). The last low was in late September and oil then surged over 20% on the heels of an “announcement” that OPEC would cut supply (5-Oct). Oil then fell and retraced around 2/3 of this surge with a flag. There was a breakout attempt, but this breakout is not gaining traction, perhaps because the bigger trend is down and we are in a global bear market for stocks. This does not bode well for demand. Oil needs to clear 88 to get this breakout back on track.
The Trend Composite aggregates signals in five trend indicators: Bollinger Bands (125,1), Keltner Channels (125,2), 5-day Rate-of-Change of 125-day SMA, StochClose (125,5) and CCI-Close (125). The Trend Composite and ten other indicators are part of the TIP Indicator Edge Plugin for StockCharts ACP[2]
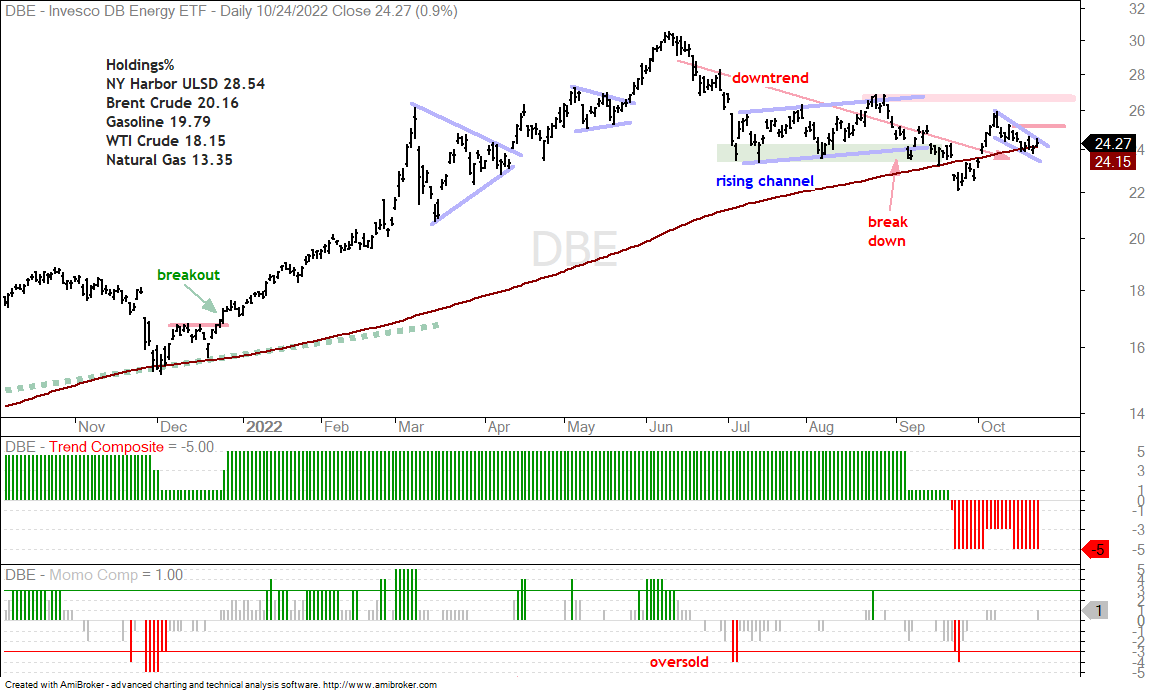
The DB Energy ETF (DBE) has also been in a downtrend since summer (red arrow-line). The ETF surged along with oil into early October and then fell back with a small falling wedge. This is perhaps a small correction after the surge, but the bigger downtrend is the dominant force at work. Note that the Trend Composite is also negative and DBE is testing its 200-day SMA. At this stage, I would need to see a strong surge-breakout from the wedge to turn bullish on DBE. A close above 25.13 would turn my stance from bearish to bullish.
You can learn more about exit strategies in this post[3], which includes a video and charting options for everyone.
Energy ETFs Break Out and Lead (XLE, XES, FCG)
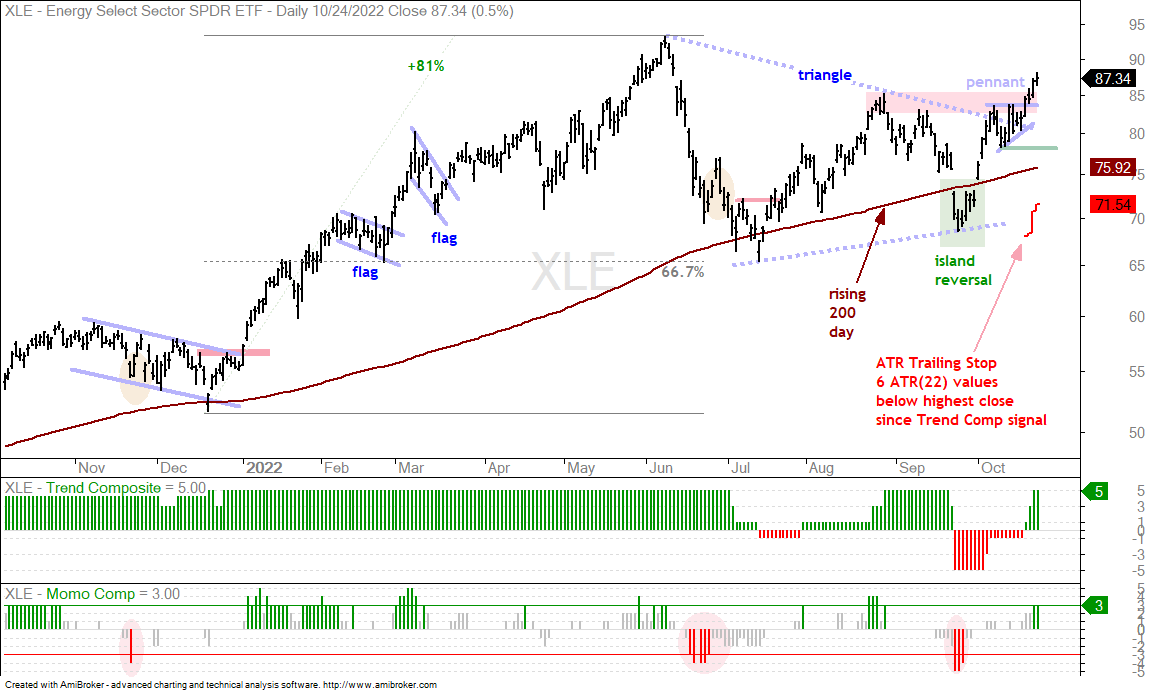
The Energy SPDR (XLE) is leading the sector SPDRs because it is the only one trading above its August high and 200-day SMA. Overall, XLE advanced some 81% from December to June, formed a large triangle consolidation and broke out in October. This triangle is viewed as a large consolidation after a big advance, which makes it a bullish continuation pattern. The Trend Composite also turned bullish on the breakout and I placed the ATR Trailing Stop for reference (red line). Volatility is high and the stop is quite a ways away, which means above average downside risk. Short-term, XLE broke out of a pennant and this breakout is holding. The pennant lows mark first support (green line) and a close below this level would argue for a re-evaluation. A close below the pennant low would also show cold feet on the triangle breakout.
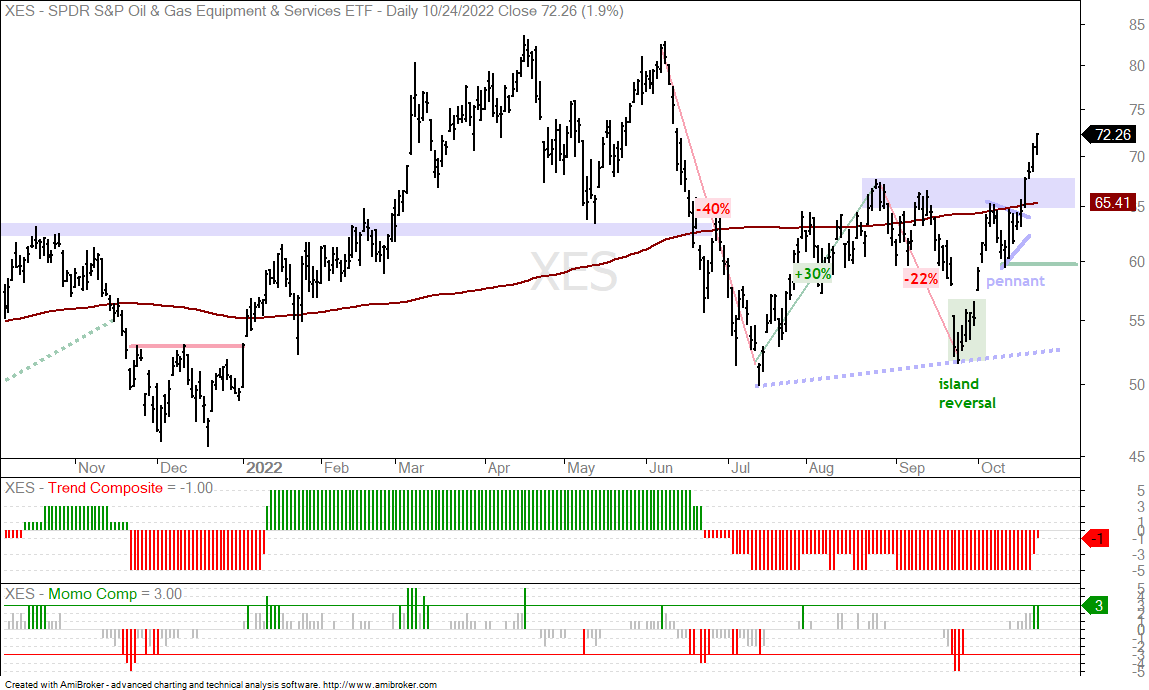
The Oil & Gas Equipment & Services ETF (XES) represents the energy sector on steroids. It will lead on the way up and on the way down with bigger swings. Overall, XES reversed with an island reversal in early October and surged to the rising 200-day. A pennant formed and the ETF broke out with a surge the last five days. XES is also already overbought, but the breakout is strong and the breakout zone turns first support to watch should we see a throwback (blue zone).
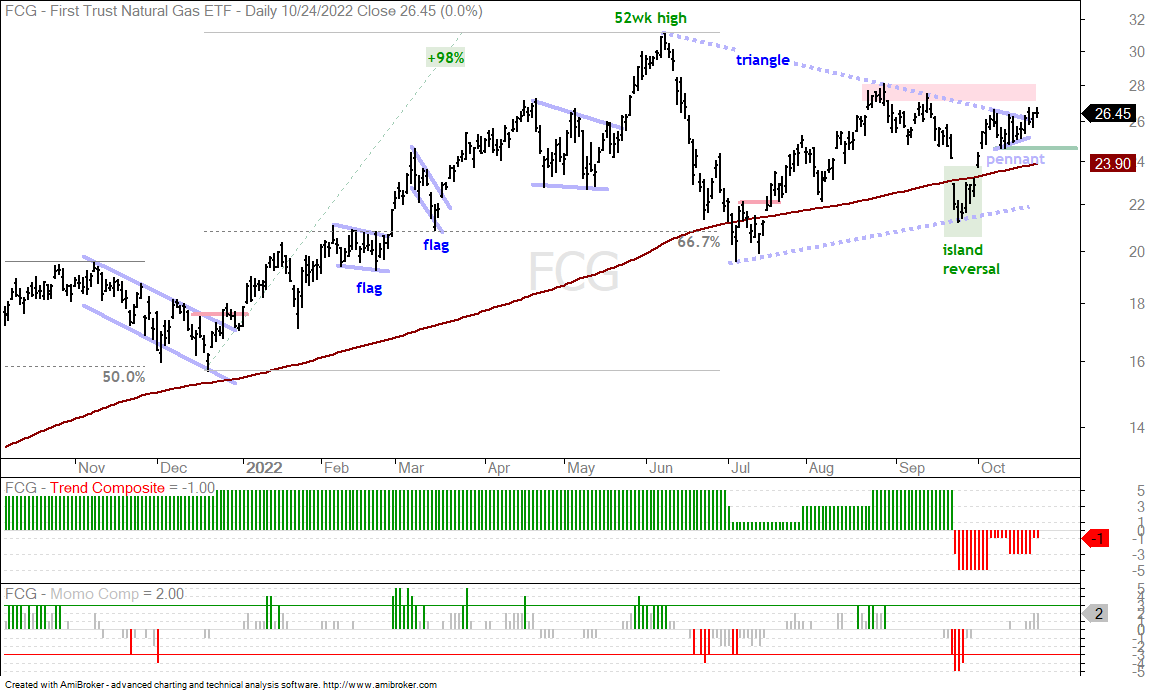
The Natural Gas ETF (FCG) is the weakest of the group because it did not exceed its August highs. The big triangle and small pennant are there, but the breakout has been rather tepid. This is probably because Natural Gas Futures (NG1!) fell 50% from late August to late October. There is clearly a reason why Natural Gas Futures are referred to as the Widow Maker.
You can learn more about exit strategies in this post[3], which includes a video and charting options for everyone.
Healthcare adds Absolute Strength to Relative Strength (XLV)
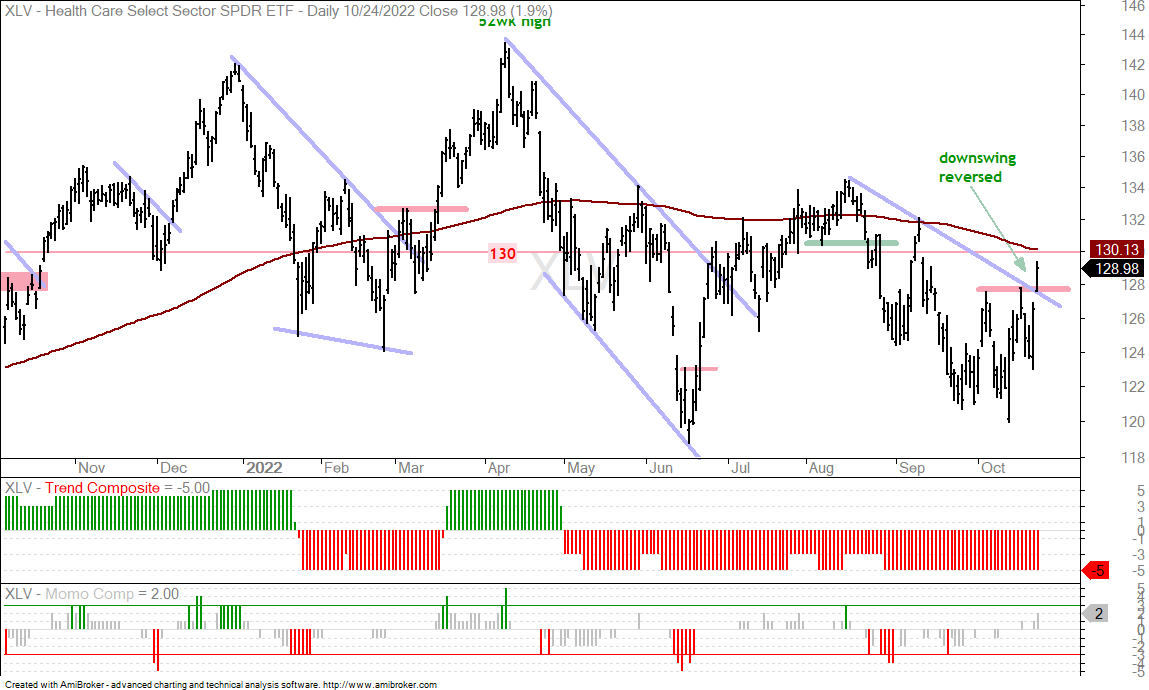
The Energy SPDR (XLE) is the only strong sector and the Healthcare SPDR (XLV) is the least weak of the other ten. Least weak translates into relative strength, which means XLV is holding up better than the others. XLV is around 1 point below the long red line at 130, a level that has been crossed more than a dozen times in the past year. XLV is basically going nowhere with a downward bias since the June breakdown. Most recently, the ETF held above its June low when SPY and the other sectors formed lower lows. The ETF surged above its early October high the last two days and this reverses the downswing that was in place since August. Not many stock-based ETFs are trading above their early October highs right now and this is why XLV is leading.
Biotech ETFs Stall Just below 200-day SMAs (XBI, IBB)
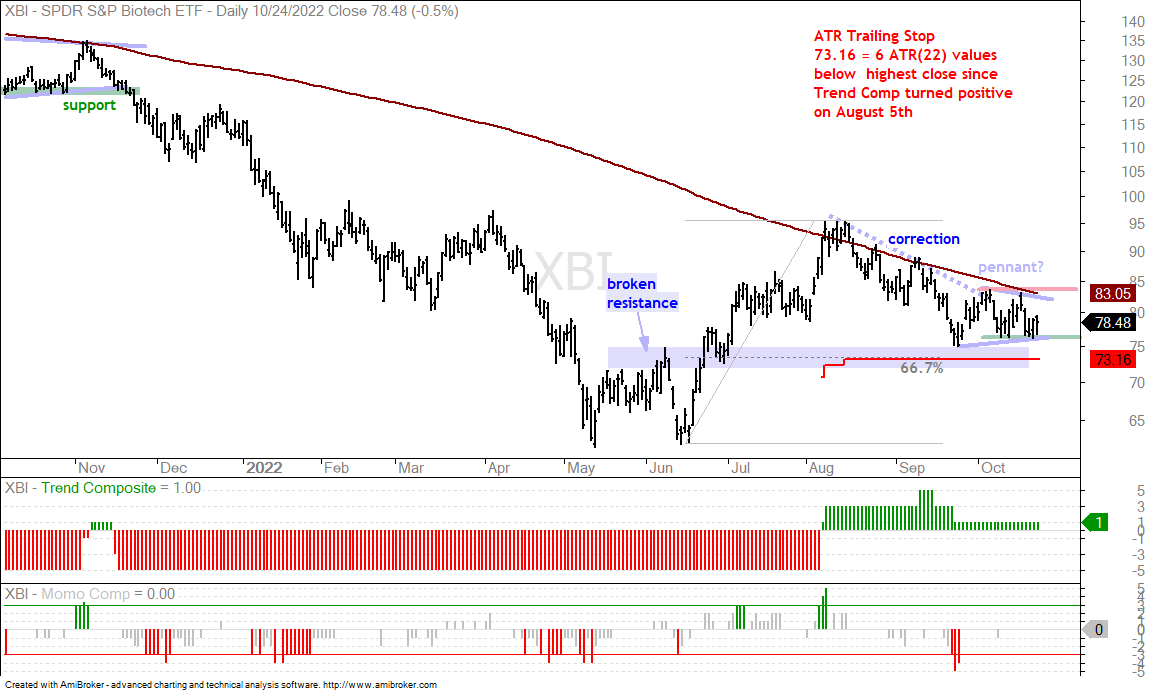
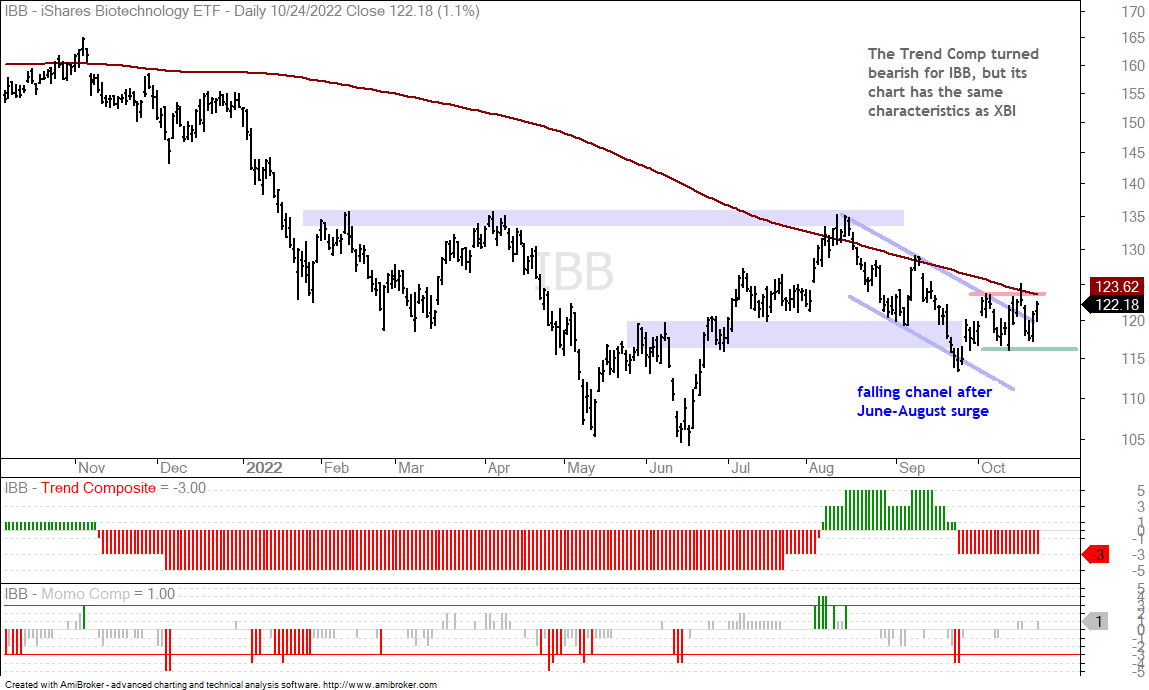
The Biotech SPDR (XBI) is still holding up, but it did not participate in the October surge. SPY is up 6% the last eight days and XBI is down a fraction. I suspect that XBI is more tilted towards small-caps and IWM has been lagging in October. Overall, XBI is still holding above support from broken resistance (blue shading) and the 67% retracement. Thus, this still looks like a correction after the June-August advance. A breakout at 84 is needed to reverse this downswing and signal a resumption of the prior advance. My concern is that a short-term pennant is forming after the August-September decline and a support break at 76 (green line) would lead to further weakness.
The Biotech ETF (IBB) is holding up a little better than XBI in October because it shows a modest gain the last eight days (2.65%), though less than that of SPY. Note that IBB is a market-cap weighted ETF with the top ten stocks accounting for around 50%. IBB has similar chart characteristics with the June-August surge, the correction into September and a breakout attempt in the making. A close above 124 is needed to seal the breakout. On the downside, a breakout failure and close below 116 would be bearish.
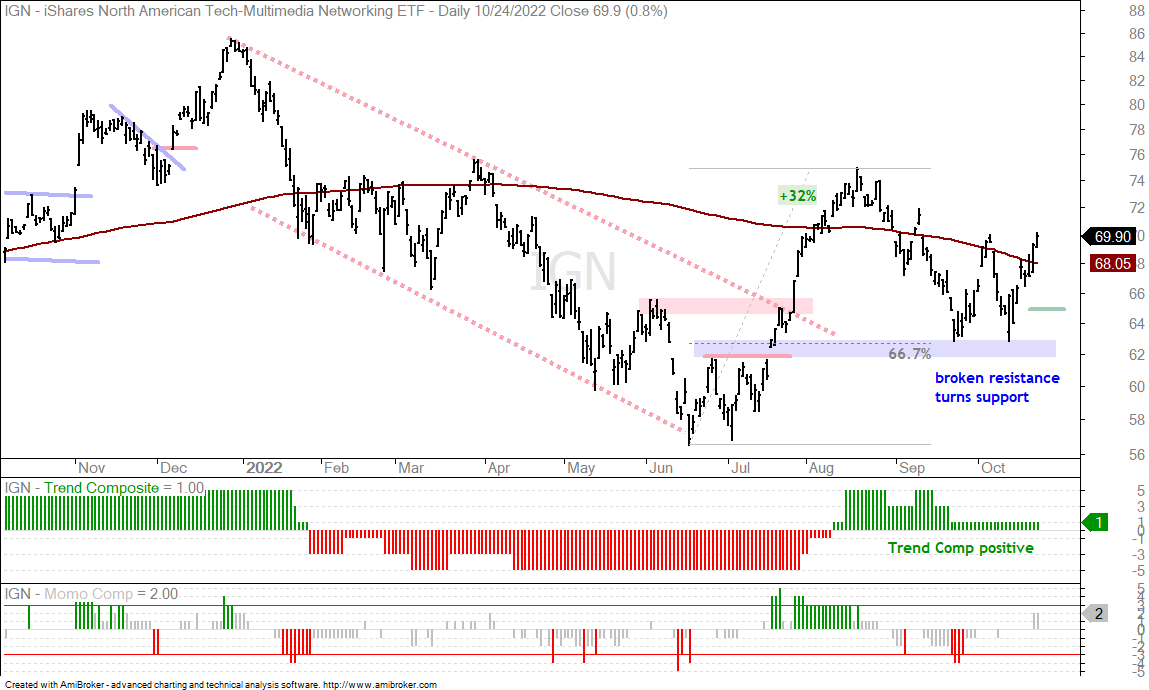
Networking ETF Continues to Lead Tech-Related ETFs (IGN)
Tech-related ETFs are off my radar because the Technology SPDR (XLK) hit a new low in October and remains in a downtrend overall. The Networking ETF (IGN) is the exception because it is holding up much better than the rest. Overall, IGN turned bullish in August with a big move above the 200-day and then corrected back to the breakout zone (blue shading) with a 2/3 retracement. IGN firmed with two lows in the low 60s and surged above the 200-day the last eight days. This is a bullish chart, but we are still in a bear market so a close watch is warranted.
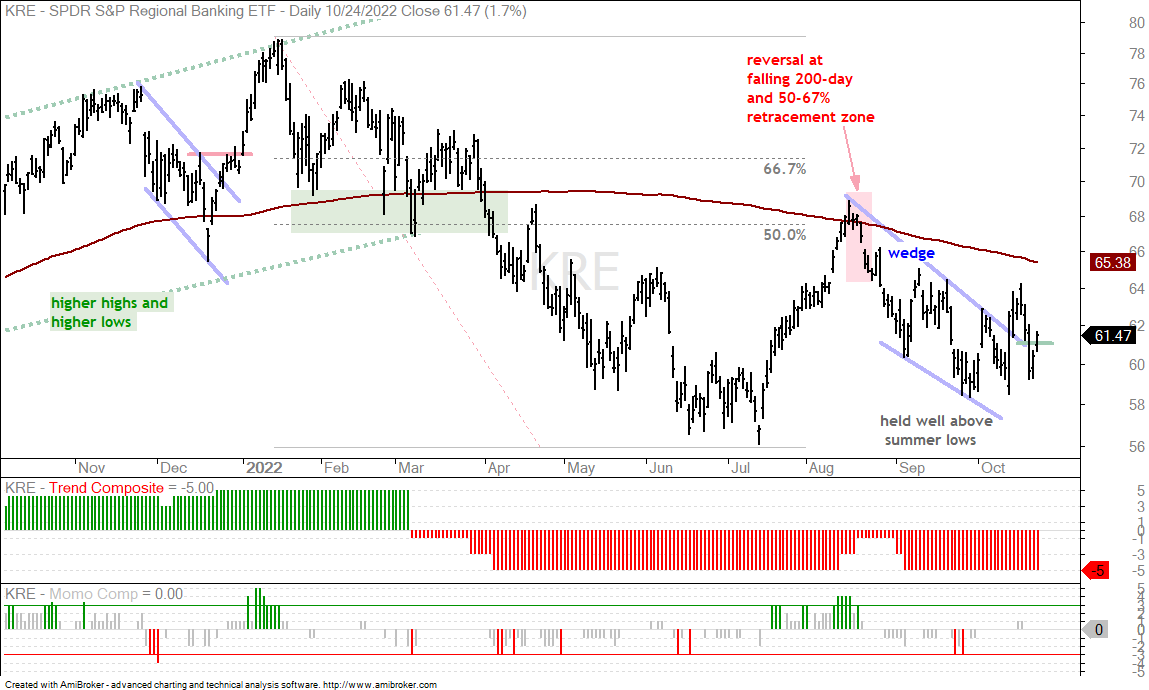
Regional Bank ETF Whipsaws with Volatility (KRE)
The Regional Bank ETF (KRE) shows the danger of taking short-term breakouts in a long-term downtrend (and in a bear market). KRE performed better than the broader market because it held above its June low. It then broke the wedge line and exceeded the early October high in mid October. This breakout did not hold as the ETF fell sharply with a move below 60 last week.
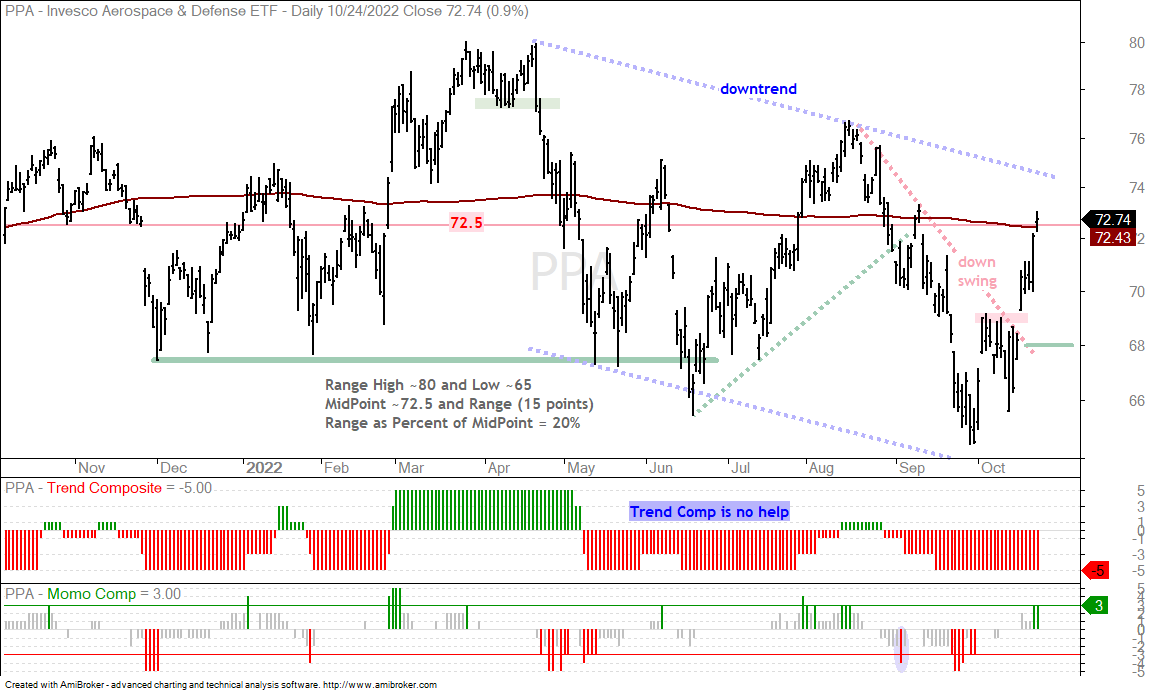
Aerospace & Defense ETF Extends on Breakout (PPA)
The Aerospace & Defense ETF (PPA) is a bit like the Healthcare SPDR (XLV). It is holding up better than the broader market simply because it has gone nowhere the last twelve months. 72.5 (red line) marks the mid point of its 12 year range and PPA crossed this level over a dozen times since November 2021. The most recent cross is to the upside and PPA also closed above its 200-day SMA. There is no real long-term trend on this chart so I was watching the swings. PPA reversed the downswing with a breakout at 69 last week and the breakout zone turns first support. A close below 68 would argue for a re-evaluation.
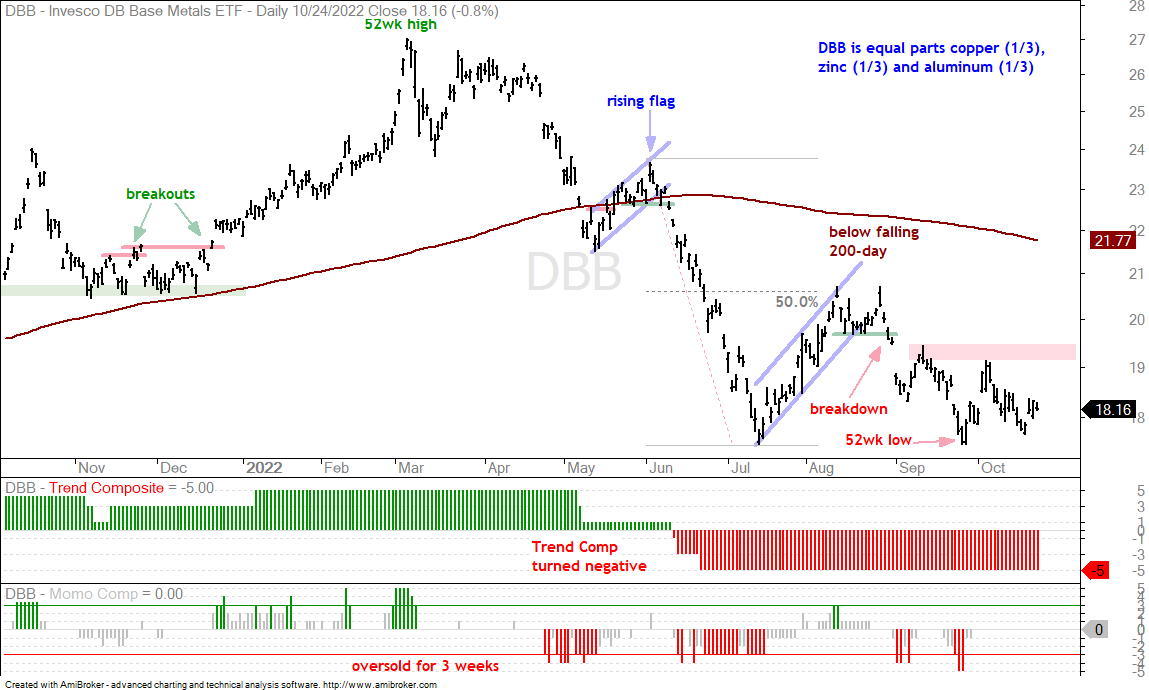
DB Base Metals ETF has a China Problem (DBB)
Industrial metals have a five-letter problem: China. The FTSE China A50 Index is down 20% since July and started hitting new lows in early October. It hit a new low again this week with a 3.9% plunge on Monday. Also note that the major US indexes hit new lows in October and the major European indexes hit new lows in late September. The bear market is global and this could weigh on demand for industrial metals. The chart below shows the DB Base Metals ETF (DBB) breaking down in late August and hitting a 52-week closing low in late September. I am not calling the July-September lows support because the bigger trend is down. Lower lows and support breaks are expected in a downtrend. A break above 19.5 (red shading) is needed before considering a re-evaluation.
Palladium ETF Continues to Sink (PALL)
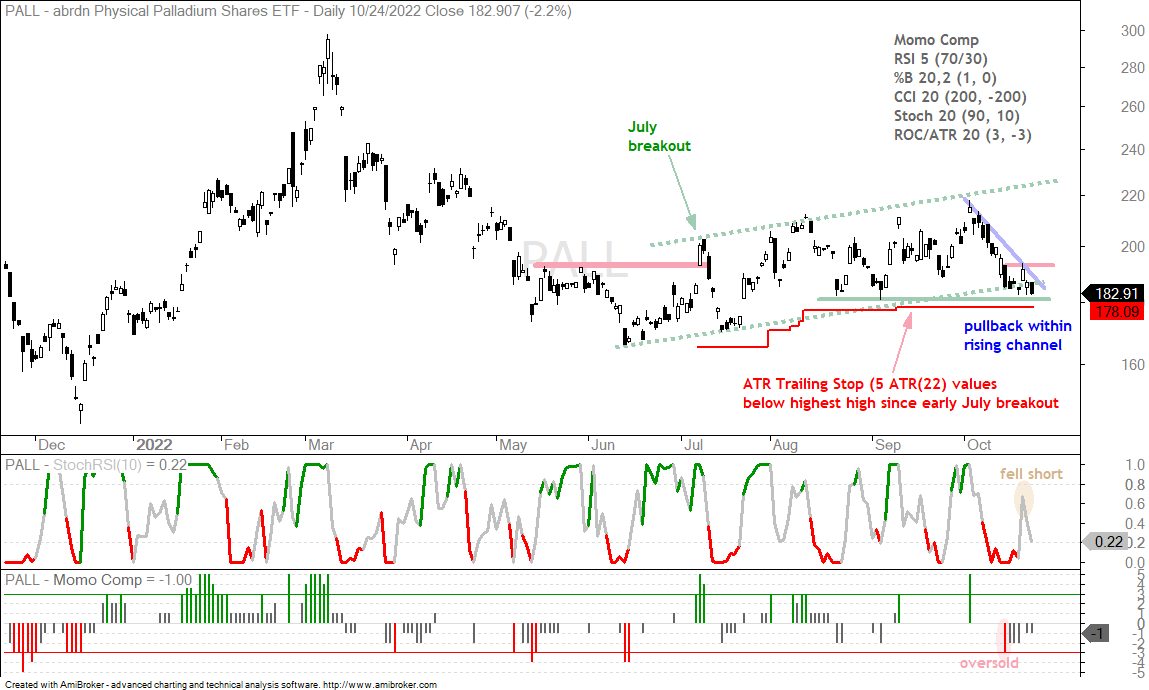
The next chart shows the Palladium ETF (PALL), which was on the radar because it was trending higher since summer (green dashed lines). This uptrend is in jeopardy as the ETF fell to a support zone and failed to follow through on last week’s bounce. A close below 180 would break support and likely trigger the ATR Trailing Stop. I would then interpret the rising channel as a counter-trend bounce after the March-June decline. The channel break would then signal a continuation of this decline and argue for a test of the December low. Ouch.
PALL was on my short-term radar because there was a pullback within the rising channel (blue line). A pullback within an uptrend is deemed an opportunity so I was watching the setup. PALL became oversold as the Momentum Composite hit -3 and was at support. I was watching for a short-term breakout at 193 (red line) or a StochRSI pop above .80 (yellow oval), neither of which happened. The setup is still there, but PALL better hold support and get the trigger soon.
Previous Reports
Friday, October 21st: Fed and Tape versus Seasonality (here[4])