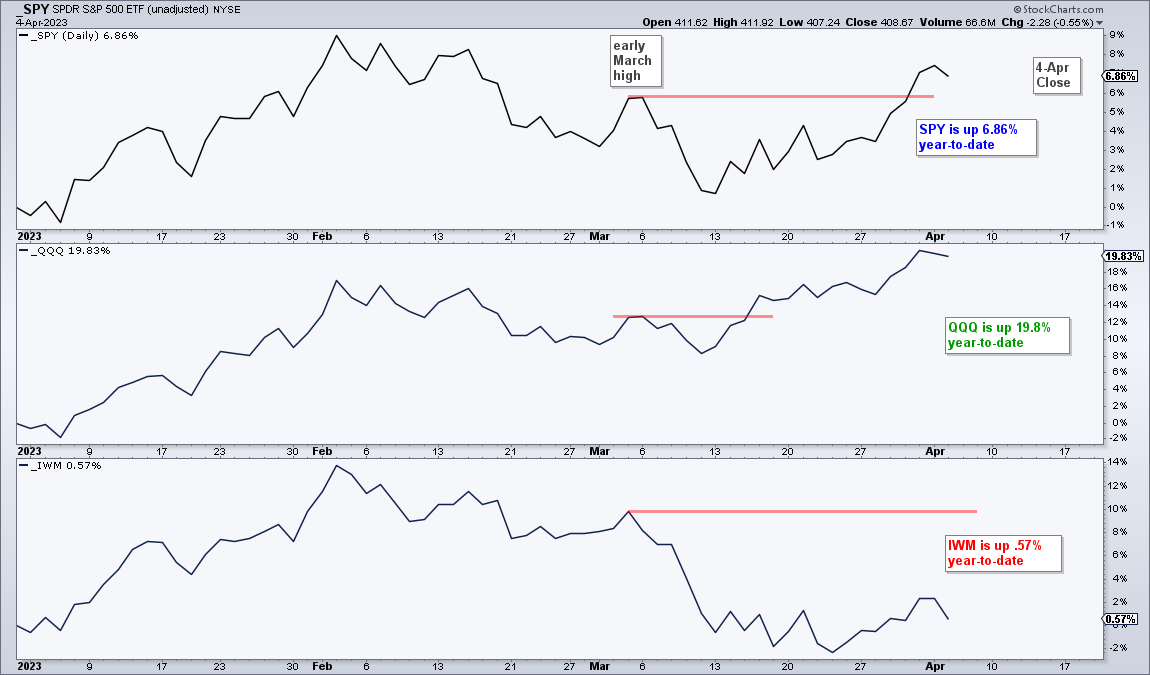
It remains a tale of two markets. Large-caps and large-cap techs are leading, while small-caps are lagging. The chart below shows QQQ exceeding its early March high in mid March and SPY exceeding this high last week. IWM remains some 7% below this high. The performance differentials since March 1st are also large. QQQ is up 9%, SPY is up 3.7% and IWM is down 5.15%. The chart below shows year-to-date performance based on the 4-Apr close. SPY is up 6.86% and QQQ is up 19.8%, but IWM is barely positive (+.57%). Large-caps, large-cap techs and precious metals are leading the market and showing strength. The rest of the stock market is either mixed or weak. This is a selective bull market that does not lift all boats. This report will continue to focus on strongest price charts and highlight some recent breakouts.
About the ETF Trends, Patterns and Setups Report
This report contains discretionary chart analysis based on my interpretation of the price charts. This is different from the fully systematic approach in the Trend Composite strategy series. In this ETF Trends, Patterns and Setups report, I am looking for leading uptrends and tradable setups within these uptrends. While I use indicators to help define the trend and identify oversold conditions within uptrends, the assessments are mostly based on price action and the price chart (higher highs, higher lows, patterns in play). Sometimes the chart assessment can be at odds with the indicators.
Report Schedule
Tuesday – 4-Apr: Market/ETF Report
Wednesday –5-Apr: Market/ETF Video
Thursday – 6-Apr: Strategy Update or Article
Systematic Strategies and Tables
Here are the three active strategies and their respective tables.
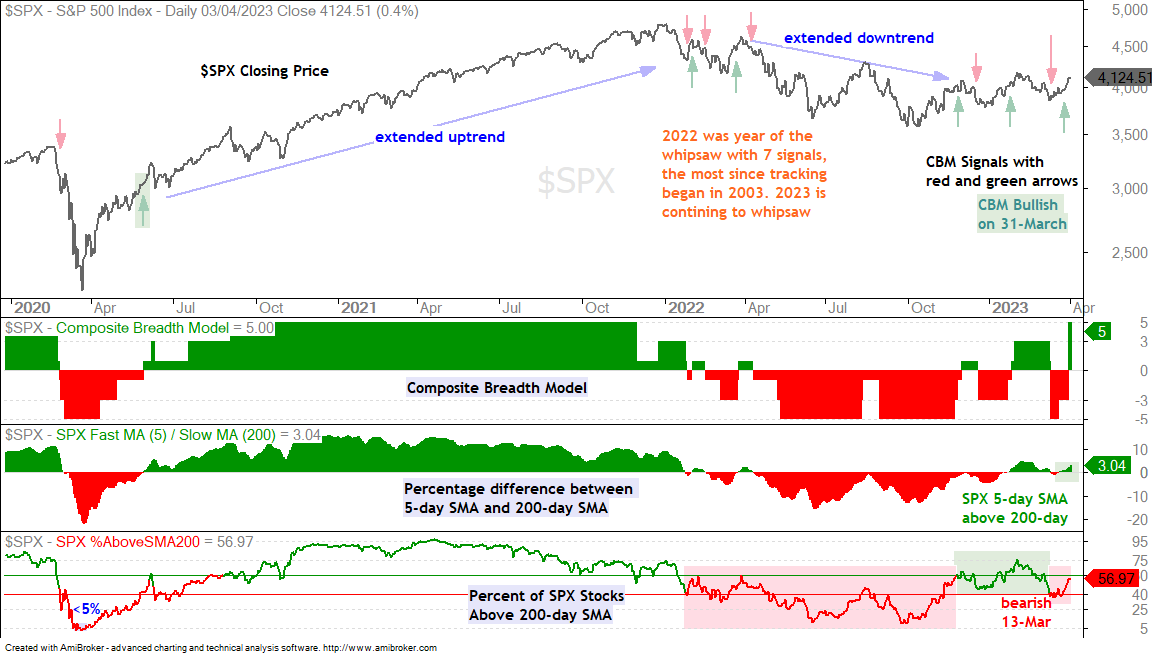
There is a trend, but we are not talking about price trends that extend. Instead, there is an uptrend in the number of whipsaws since January 2022. There were whipsaws the first four months of 2022, an extended downtrend from early April to late November 2022 and whipsaws over the last four months. The rallies show underlying strength with these all-in moves, but peak after becoming short-term overbought. The declines show broad downside participation, but bottom after becoming short-term oversold. There two lessons from the last 15 months. First, don’t count on extended trends. Second, prepare for short-term reversals after becoming overbought or oversold.
Wedge Break Did Not Work for SPY
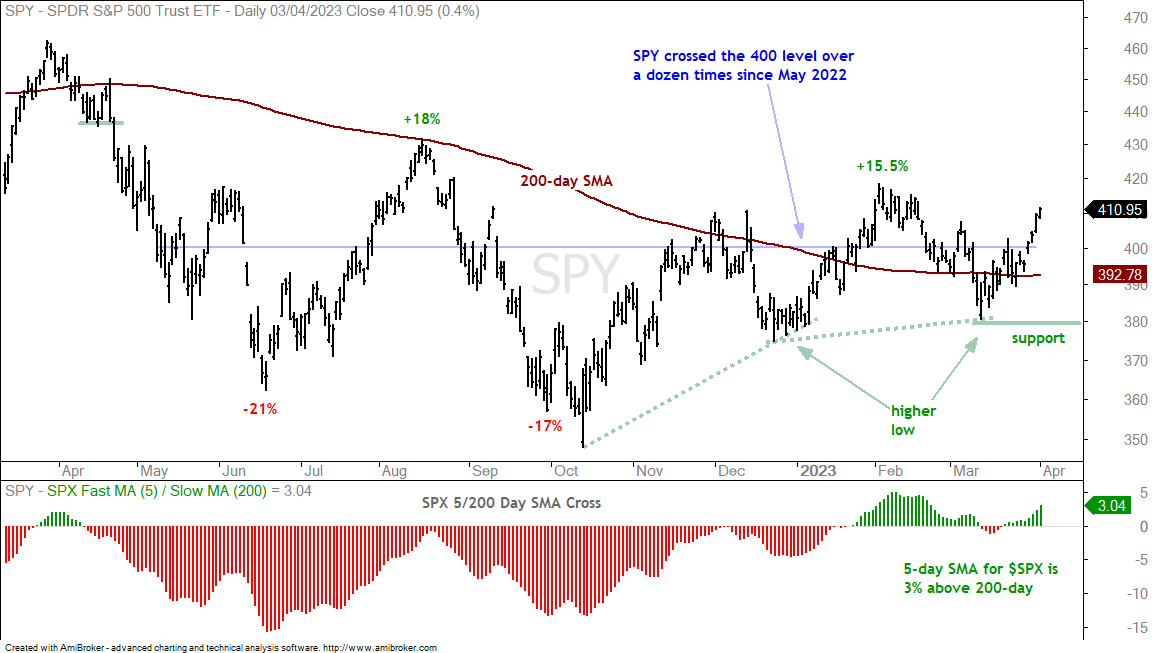
Angled trendlines are very subjective. The longer they extend, the more subjective and unreliable they become. Sure, we can find plenty of long trendlines that worked in hindsight, but real-time trendlines are a different matter. Flag, wedge or triangle lines that extend a few weeks and mark continuation patterns are more robust than trendlines that extend a few months. This is also a subjective opinion! I drew rising wedge trendlines connecting the October-December lows and the December-February highs. SPY broke the lower line and its 200-day SMA in mid March, but this break did not hold as the ETF got a strong oversold bounce. It is time for a redraw and a rethink.
SPY is in an uptrend since the higher high in February. Why? Because an uptrend requires a higher high and a higher low. This is not ground breaking analysis and it will certainly produce lagging signals, but basic high-low analysis is simple and clear. SPY fell sharply from early February to mid March, but did not break the December low and forge a lower low. By this definition, the trend is still up and the March low now marks key support at 380. A break here would forge a lower low and reverse the uptrend.
SPY Breaks Out of Falling Channel
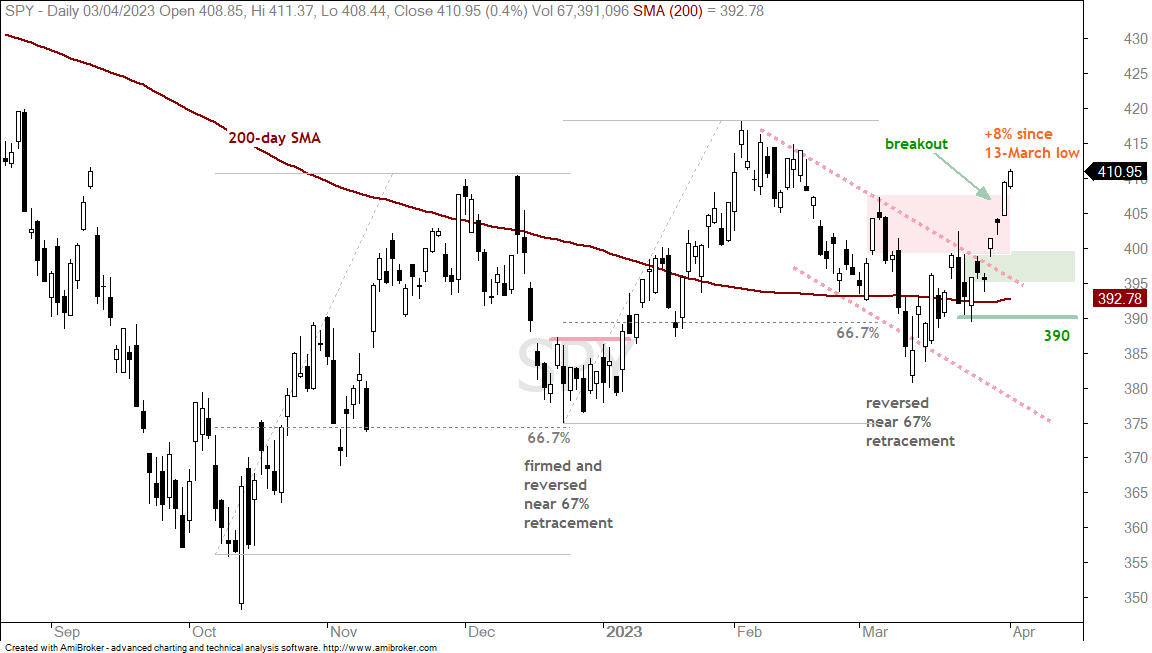
SPY surged from 390 to 410 and broke out of a falling channel the last seven trading days. The ETF is now up around 8% from the March 13th low (three weeks ago). Even though there is a breakout working, SPY is short-term overbought after such a move. Chasing breakouts and overbought conditions is not working right now so I remain cautious when overbought. The breakout zone in the 395-400 area becomes first support to watch should we get a throwback. Such a move would alleviate overbought conditions and improve the reward-to-risk ratio. A close below 390 would negate the breakout.
Short-term, the blue lines define the current bounce, which retraced around 2/3 of the early March decline. This puts SPY in a potential reversal zone because oversold bounces within bigger downtrends are expected to fizzle after retracing 50-67 percent. SPY is also right at the upper trendline of the falling channel (red). A close below 392 would reverse the short-term uptrend and argue for a continuation lower.
20+ Yr T-Bond ETF Stalls with Bullish Pennant (TLT, TNX)
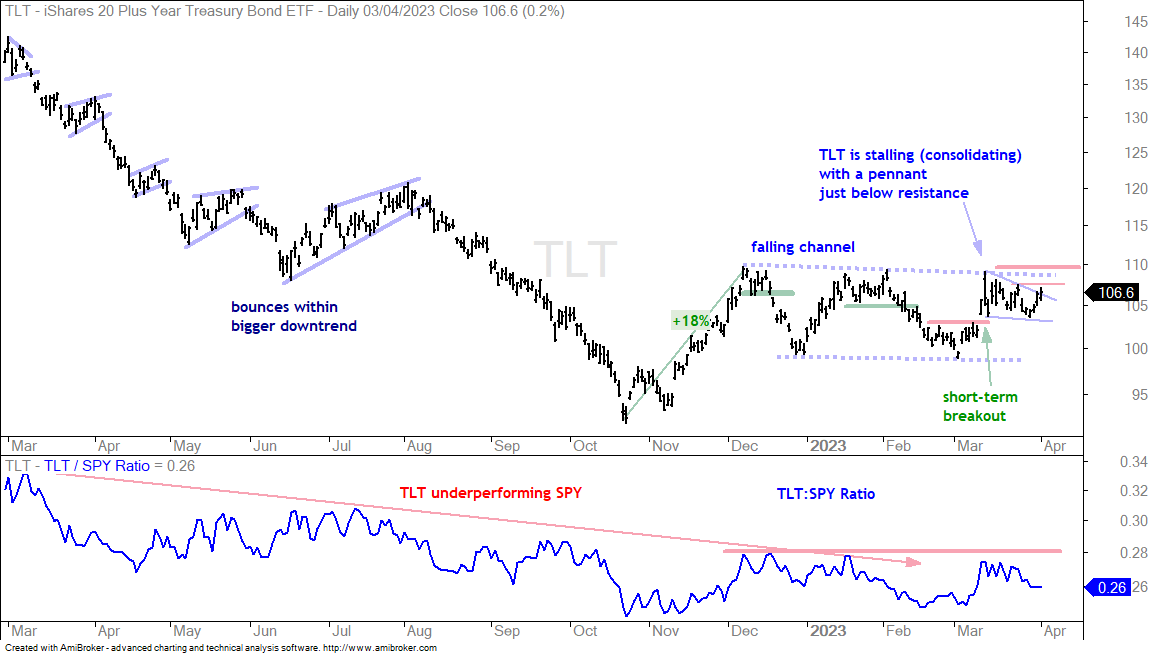
The 20+ Yr Treasury Bond ETF (TLT) has a medium-term bullish continuation pattern and a short-term bullish continuation pattern at work. First, TLT surged 18% and then formed a falling channel with lower lows and lower highs from December to April. A break above 110 would forge a higher high and be bullish. Second, TLT surged in the first half of March and then consolidated with a pennant. This bond ETF bounced the last few days and a pennant breakout would signal a continuation of the early March advance. This would also increase the chances of a channel breakout.
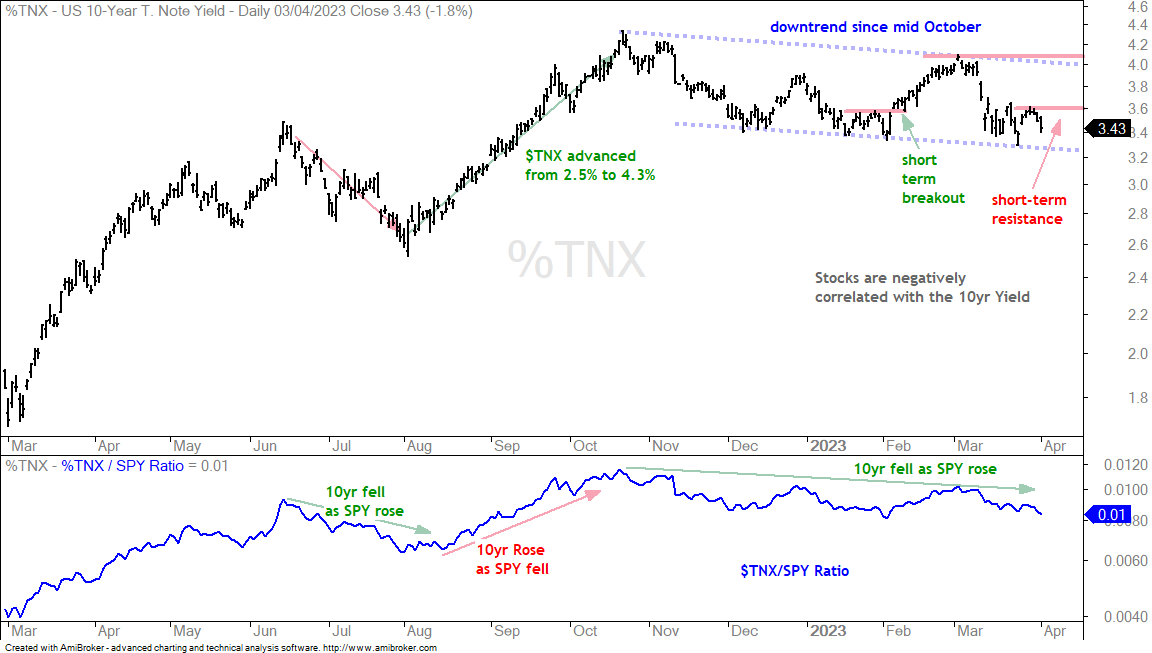
The next chart shows the 10-yr Treasury Yield peaking in mid October and falling into late March. This 5-6 month downtrend coincides with a 5-6 month uptrend in SPY, which means these two are negatively correlated and move in opposite directions. Short-term, $TNX fell to the 3.4% area and stalled the last few weeks. A breakout at 3.6% would signal an upturn and this could be short-term negative for stocks. Longer-term, a break above the March high would reverse the overall downtrend.
Dollar Swings Lower (UUP)
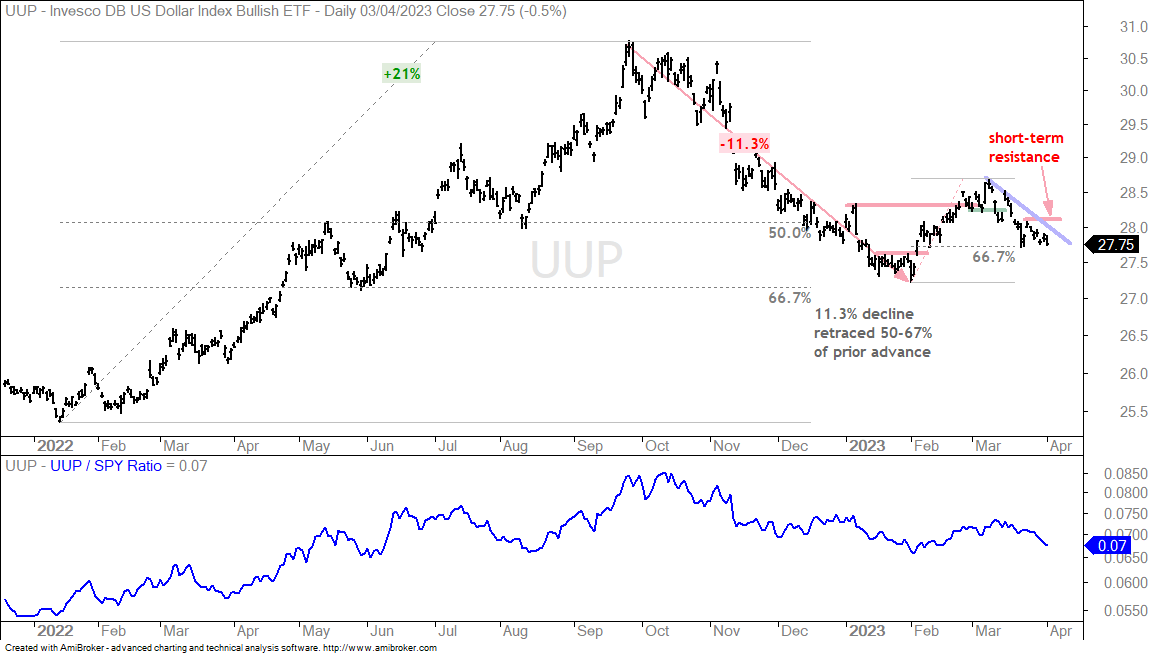
It is a market of swings and the current swing for the Dollar is down. This downtrend started with the support break on March 13th, which is when SPY bottomed. The Dollar fell as SPY advanced and these two are negatively correlated for the most part. The current downswing retraced around 2/3 of the February advance and this could be a reversal zone. Short-term resistance is set at 28.1 and a breakout here would reverse the downswing. It has not happened just yet, but a breakout in the Dollar could weigh on gold.
Gold Holds Strong as Silver Turns Frothy (GLD, SLV, PLTM)
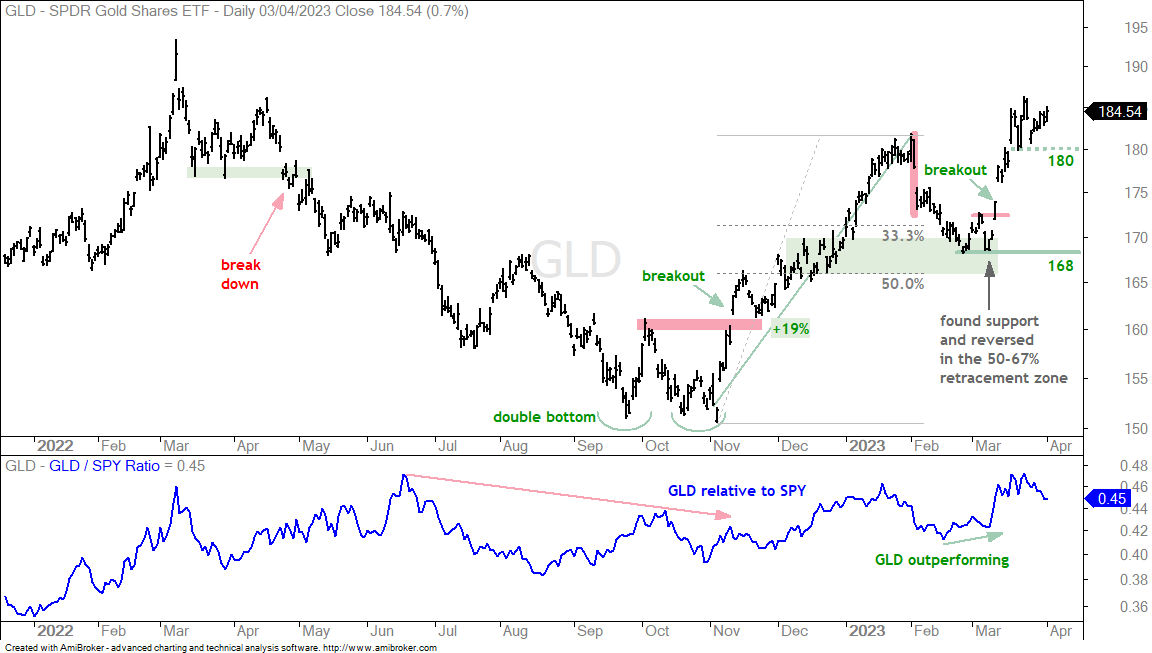
As with most charts, there is a longer term and shorter term trend on the Gold SPDR (GLD) chart. Longer term (3-6 months), the trend is up with the lows in late February and early March marking support. A break here would forge a lower low and reverse the overall uptrend. Short-term, GLD consolidated above the 180 area and established support here. A break would argue for a pullback after the March surge.
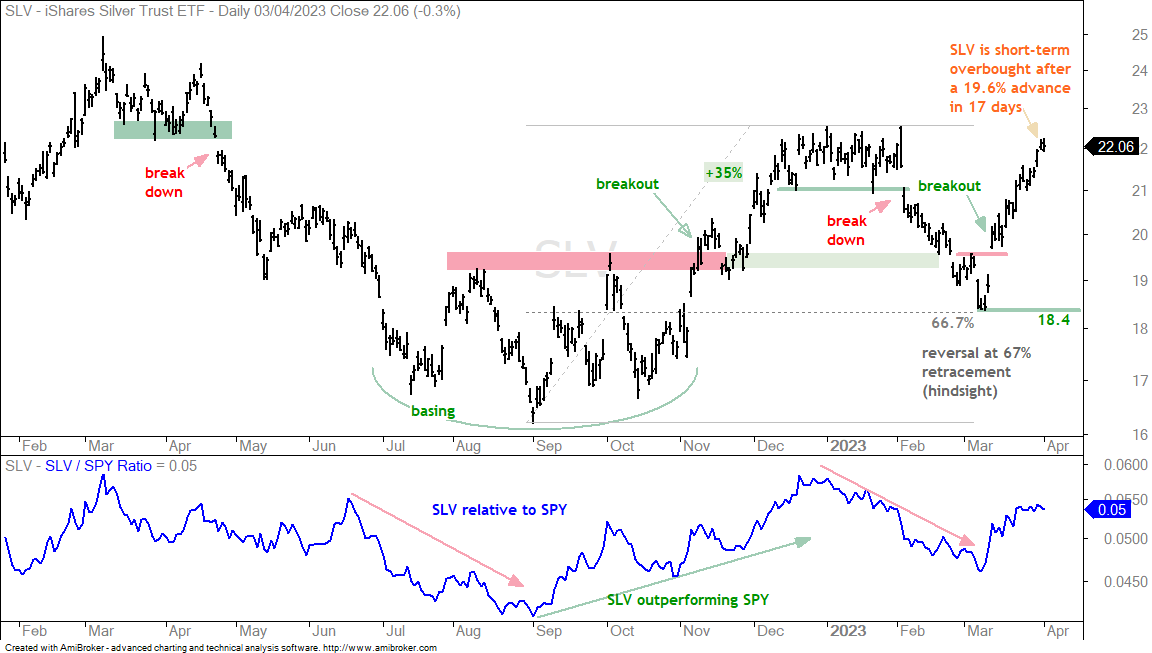
GLD has a clear short-term support level based on a consolidation over the last two weeks. The Silver ETF (SLV), in contrast, continued higher the last two weeks and I do not see a corresponding support level. Even so, I think SLV will follow gold and a short-term support break at 180 in GLD would argue for a pullback in SLV.
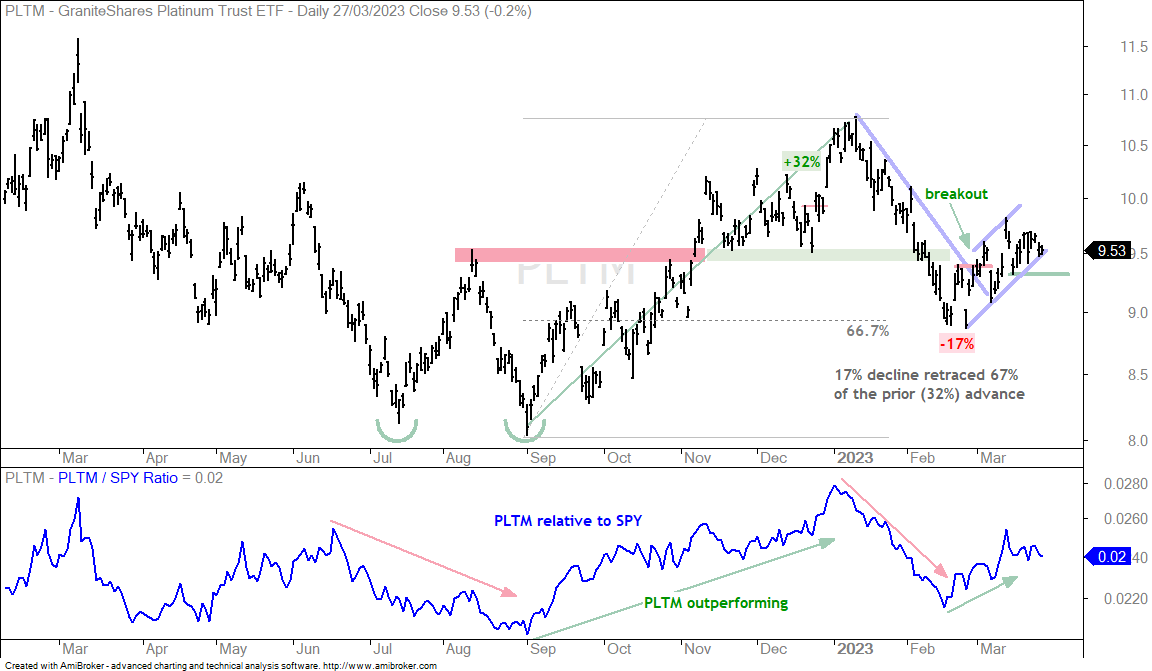
The Platinum ETF (PLTM) is not as strong as GLD and SLV, but prices continue to work their way higher since the early March breakout. Most recently, PLTM bounced the last four days and this bounce affirms support at 9.30 (green line). I will remain bullish as long as 9.3 holds on a closing basis.
Gold and Silver Miners ETFs Become Overbought (GDX, SIL)
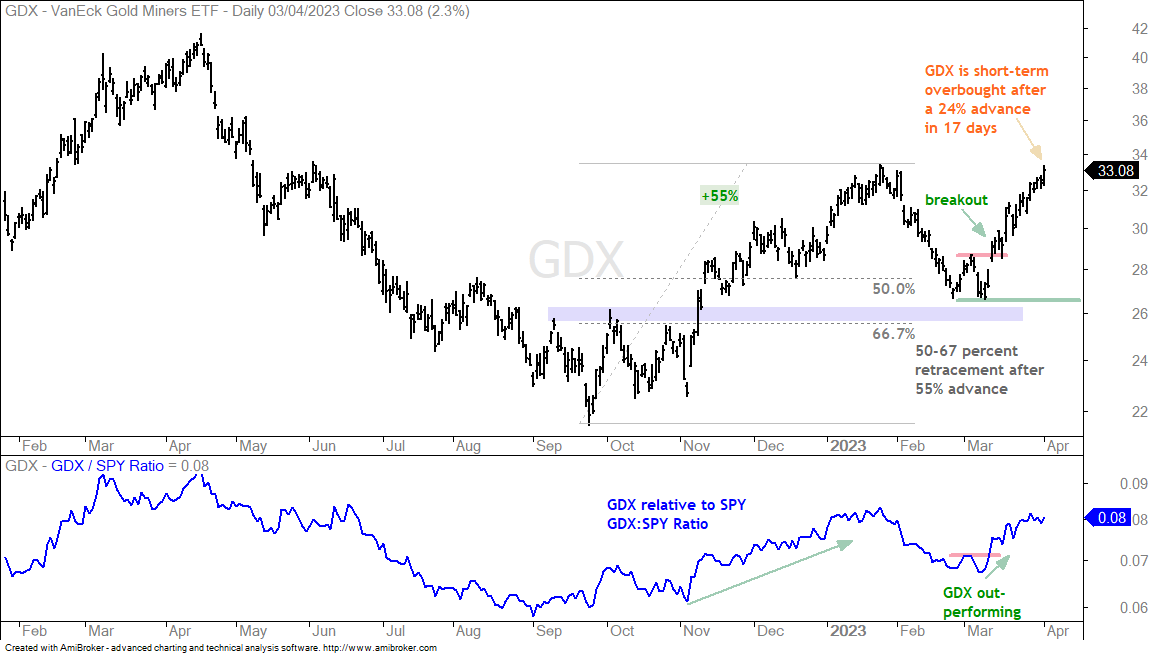
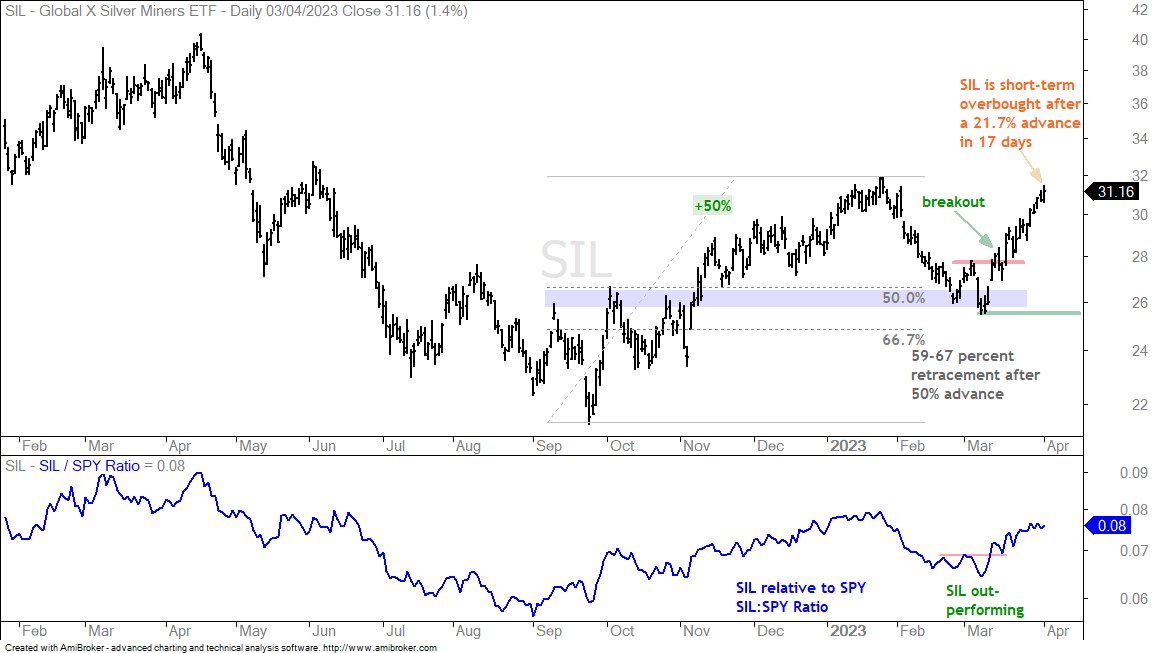
The Gold Miners ETF (GDX) chart looks similar to the Silver ETF (SLV). The advance over the last 17 days is quite steep and I do not see a clear short-term support level. GDX will likely follow GLD. Thus, a short-term support break in GLD would argue for a pullback in GDX. Note that GDX (+24%), SLV (+19.63%) and SIL (+21.7%) are short-term overbought after big moves the last 17 days.
Tech-Related ETFs Continue to Lead (QQQ, XLK)
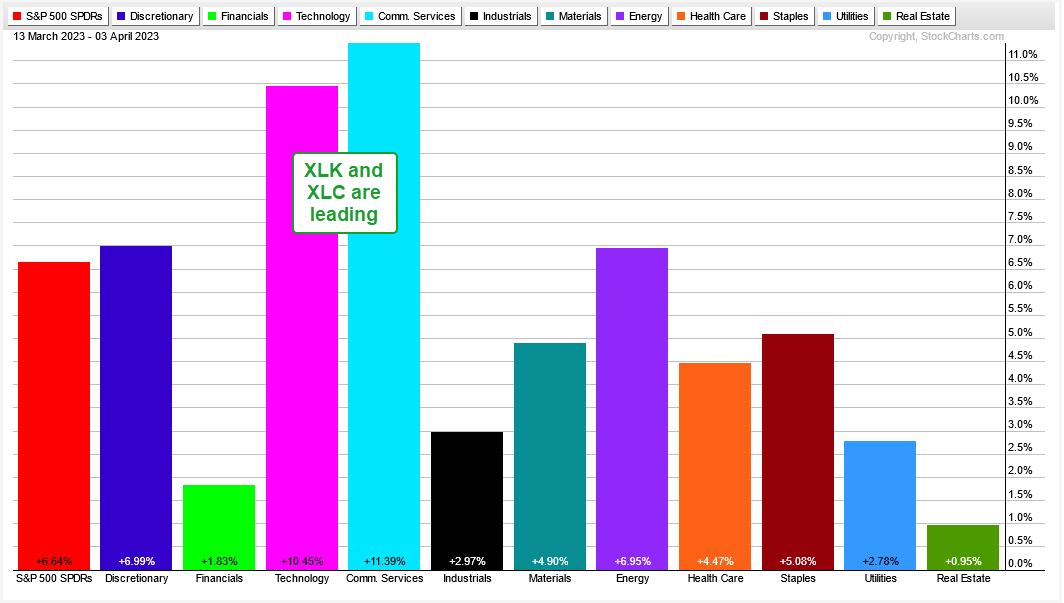
The Technology SPDR (XLK) and the Communication Services SPDR (XLC) are the leading sectors over the last three weeks with gains of 10.45% and 11.39%, respectively. Tech-related ETFs led the market surge in January, held up well during the February-March pullback and led the market surge the last three weeks. Many of the tech-related ETFs formed bull flags into early March and broke out in the second half of March.
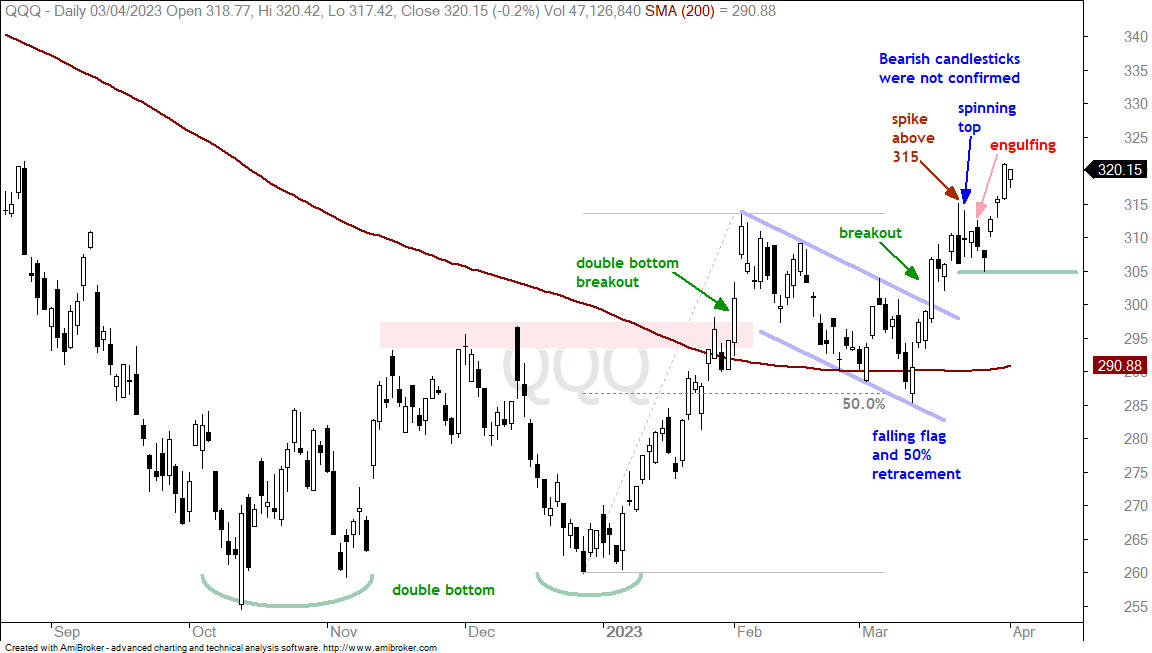
The next chart shows QQQ with a market-leading breakout with a big surge above 300 on March 16th. As noted last week, QQQ formed some bearish candlestick patterns, but these were never confirmed with a break below 305. Candlestick patterns are very short-term and good for just a few days. Even though the patterns showed some indecision and failed intraday bounces, they were never confirmed with an actual price reversal (short-term breakdown). QQQ gained around 12% from the 13-March low to Monday’s close and is also overbought right now. The trend is up, but there is no setup on this chart and first support remains at 305.
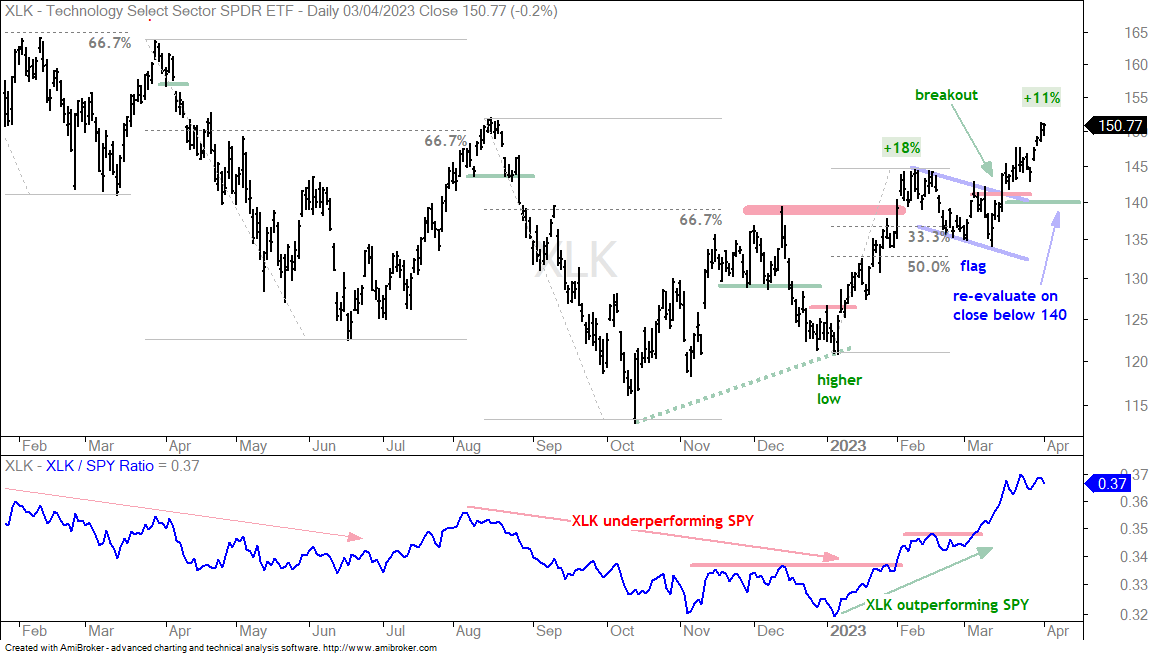
The Technology SPDR (XLK) is leading the sector SPDRs with a breakout surge on March 16th and a follow through advance the last four days. The breakout zone in the low 140s turns first support and this breakout is clearly valid as long as the breakout holds. A close below 140 would negate the breakout and call for a re-evaluation.
Semis and Software Extend on Breakouts (SOXX, IGV)
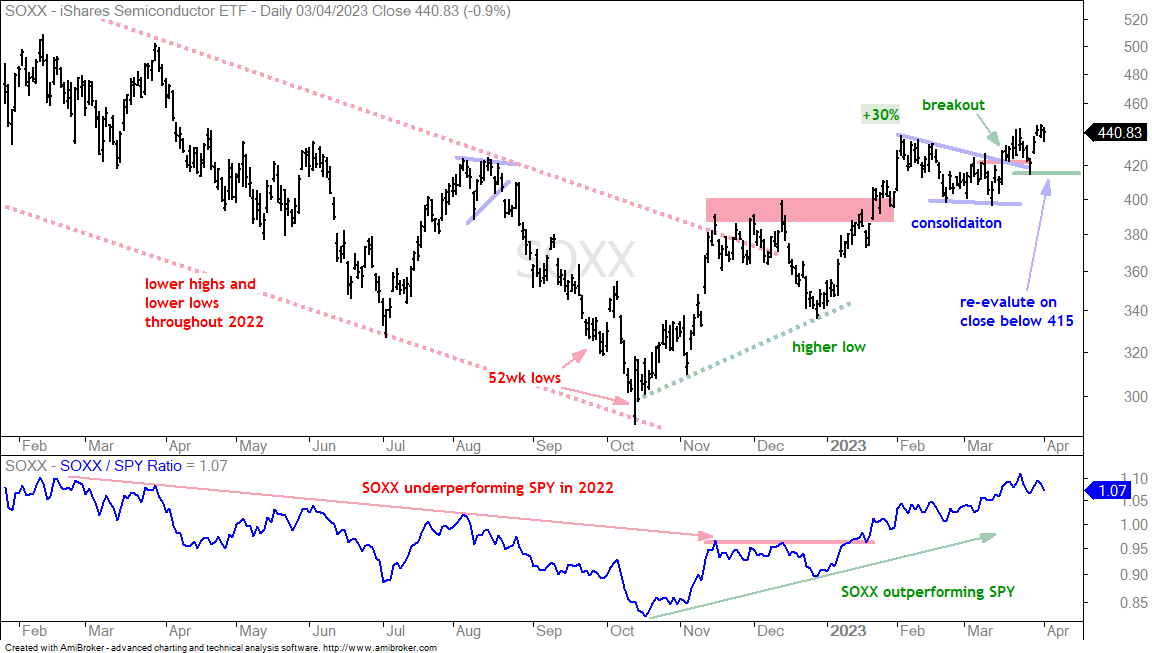
The Semiconductor ETF (SOXX) surged some 30%, consolidated to digest these gains and broke out of the consolidation on March 16th. The extension after the breakout is a bit subdued, but the trend is up and the breakout is holding. Last week’s dip and bounce established short-term support at 415 and this is the first level to watch for a failure.
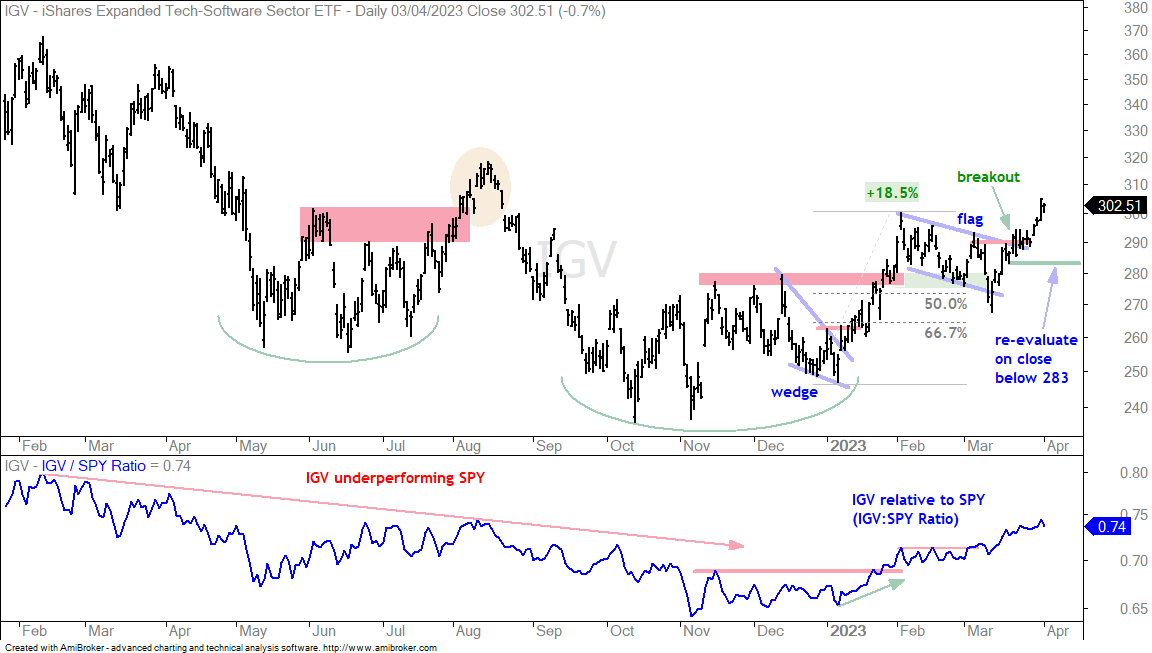
The Software ETF (IGV) caught a strong bid the last five days and extended on its flag breakout. The breakout zone in the 290 area turns first support to watch should we see a throwback. I am marking first support at 283. A close below this level would negate the flag breakout and argue for a re-evaluation.
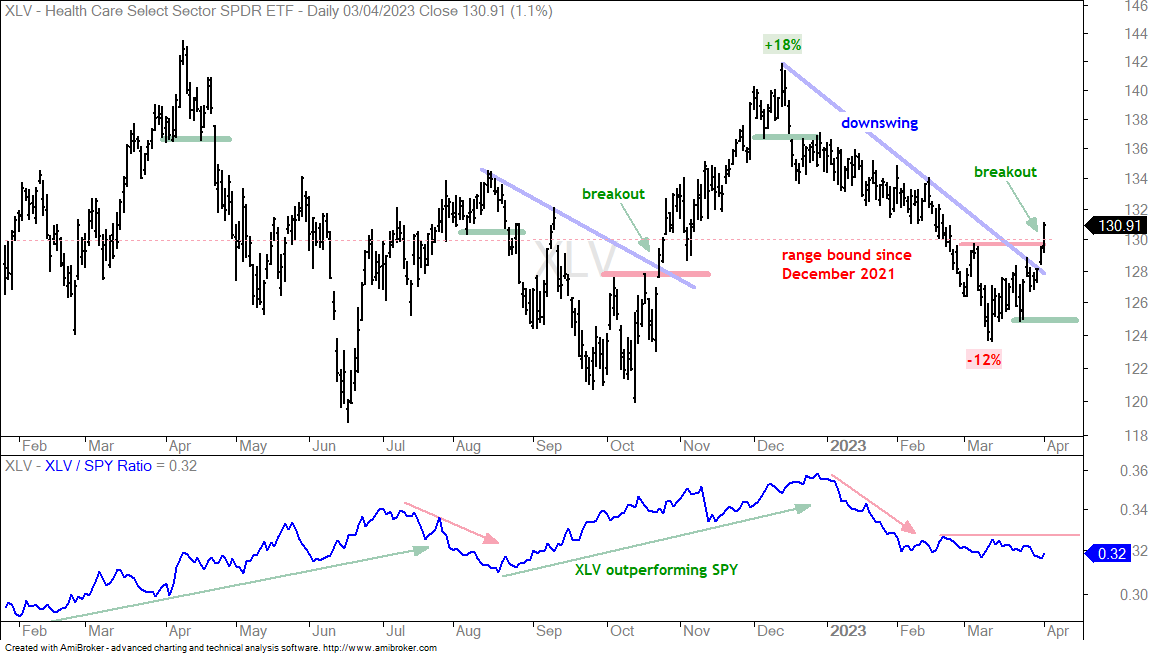
The Healthcare SPDR (XLV), Biotech ETF (IBB) and Healthcare Providers ETF (IHF) are still lagging the broader market, but all three broke resistance and reversed their downswings with big moves the last few days. The first chart shows XLV in a trading range for over a year. The red dashed line is at 130 and XLV crossed this level dozens of times. There is no long-term trend on this chart so we must focus on the swings. Most recently, XLV broke resistance at 130 with a surge the last four days and this breakout reverses a three month downswing. I will set my initial re-evaluation at 125.
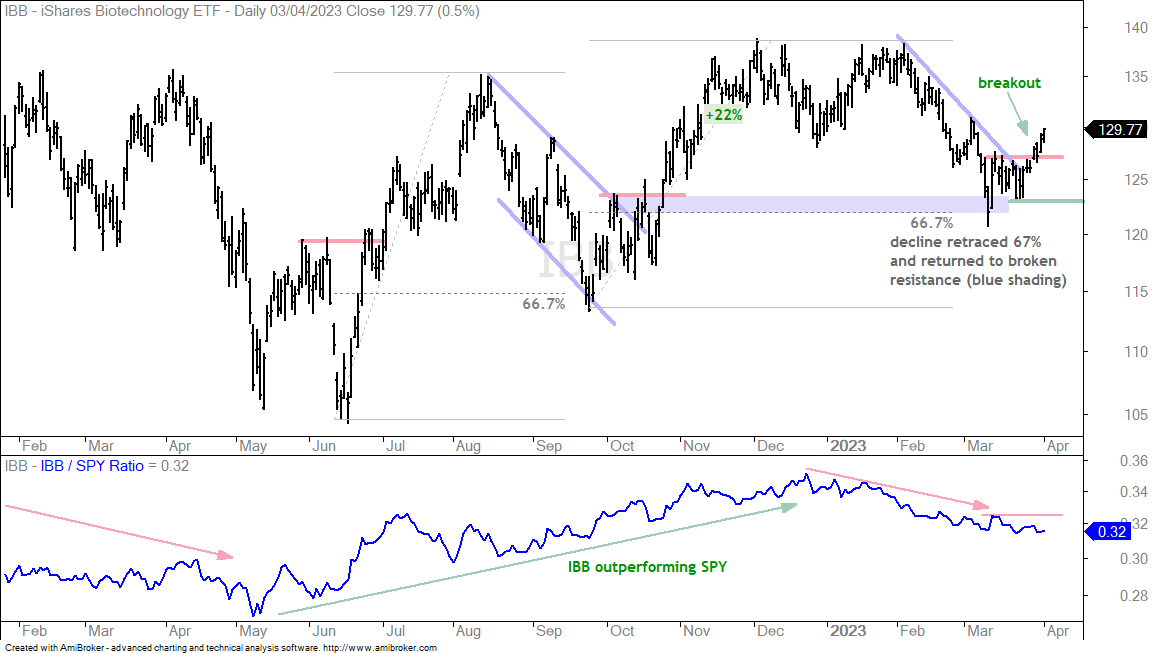
The Biotech ETF (IBB) was on my watch list the last few weeks because the decline into March looked like a pullback within a bigger uptrend. This decline retraced around 2/3 of the prior 22% advance and returned to broken resistance. IBB firmed for a few weeks and then broke out with a surge the last four days. This breakout reverses the correction and signals a continuation of the bigger uptrend. I will set my re-evaluation at 123.
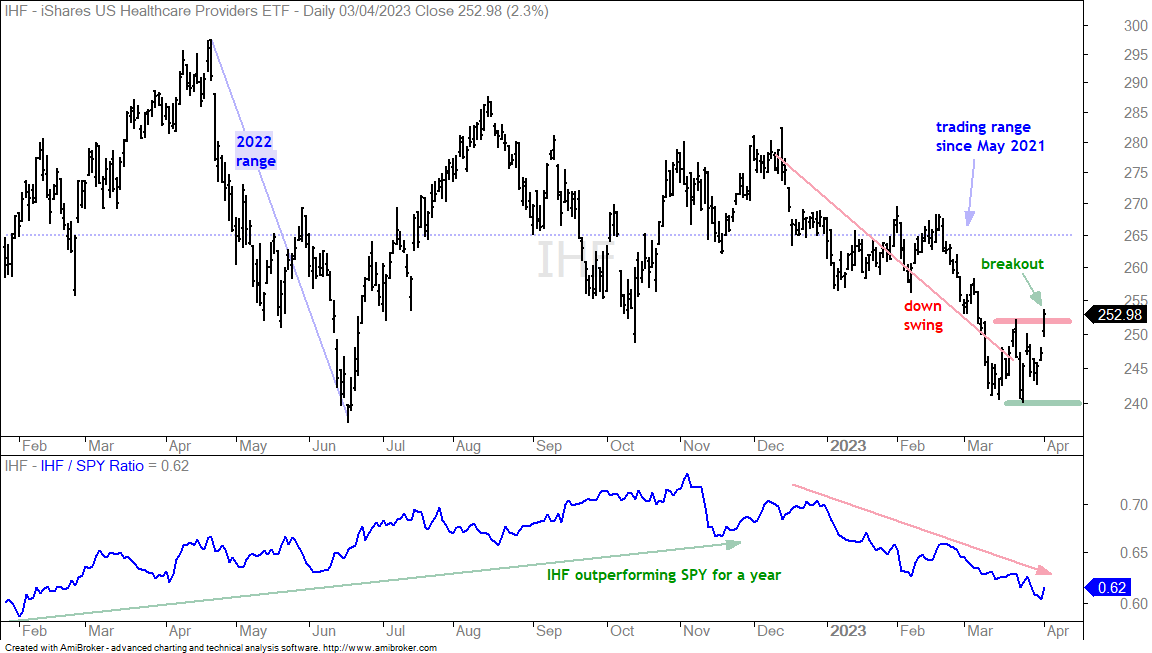
The Healthcare Providers ETF (IHF) is in an eternal trading range. The ETF crossed the 265 level (red dashed line) dozens of times since May 2021. Most recently, the price swing was down from mid December to mid March as IHF declined to the bottom of its 2022 range. The ETF firmed in the 240 area for a few weeks and broke out with a surge on Monday. I will set my re-evaluation at 240.
Consumer Staples SPDR Extends on Breakout (XLP)
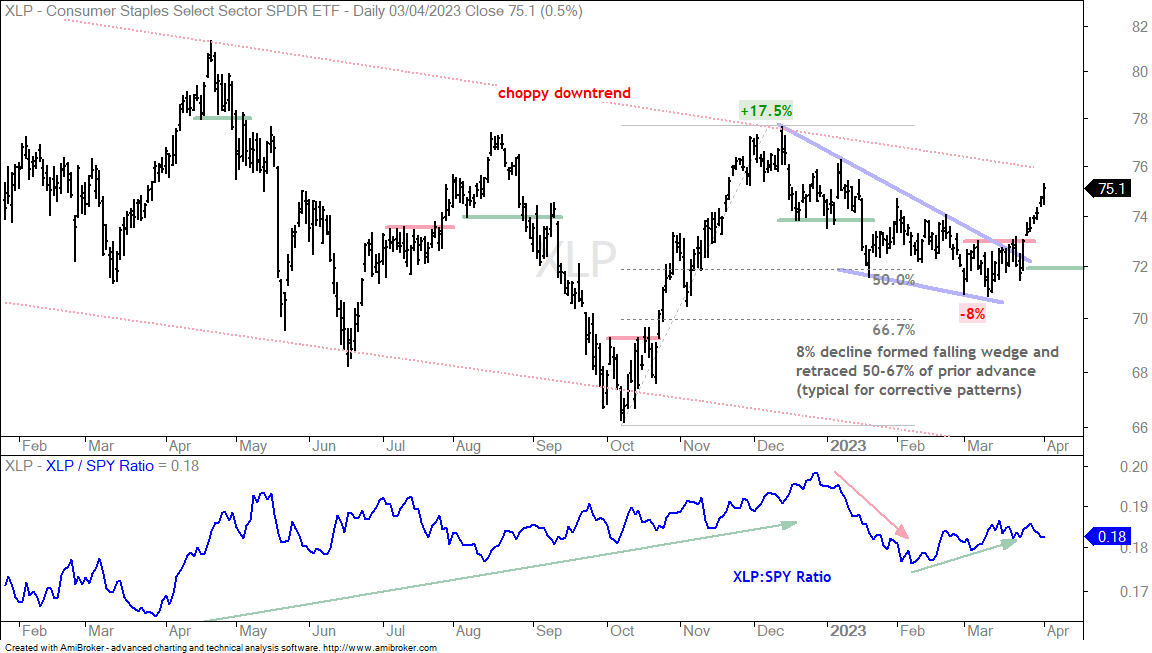
The Consumer Staples SPDR (XLP) is leading the defensive ETFs because it broke out on March 27th. Like many in this group, such as SPLV and PBJ, XLP is largely in a trading range and I am taking my cues from the swings within the range. The eight percent downswing retraced 50-67 percent of the prior advance and formed a falling wedge. Both the retracement amount and pattern are typical for corrections after a big advance. The breakout at 73 is bullish and I am setting my re-evaluation level at 72.
Aerospace-Defense and Water Surge off Support (PPA, PHO)
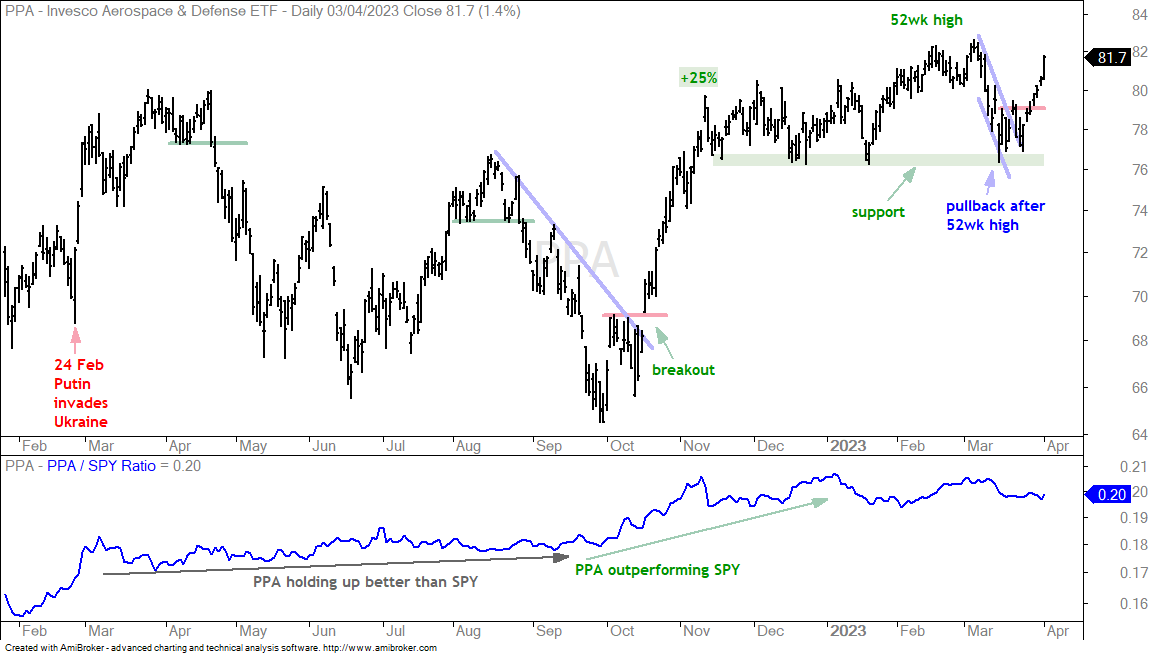
The next chart shows the Aerospace & Defense ETF (PPA) hitting a new high in early March and testing support in mid March. The decline to support was sharp, but it was a pullback within a bigger uptrend. Such pullbacks are viewed as opportunities, not threats. PPA tested support for two weeks and then surged the last seven days.
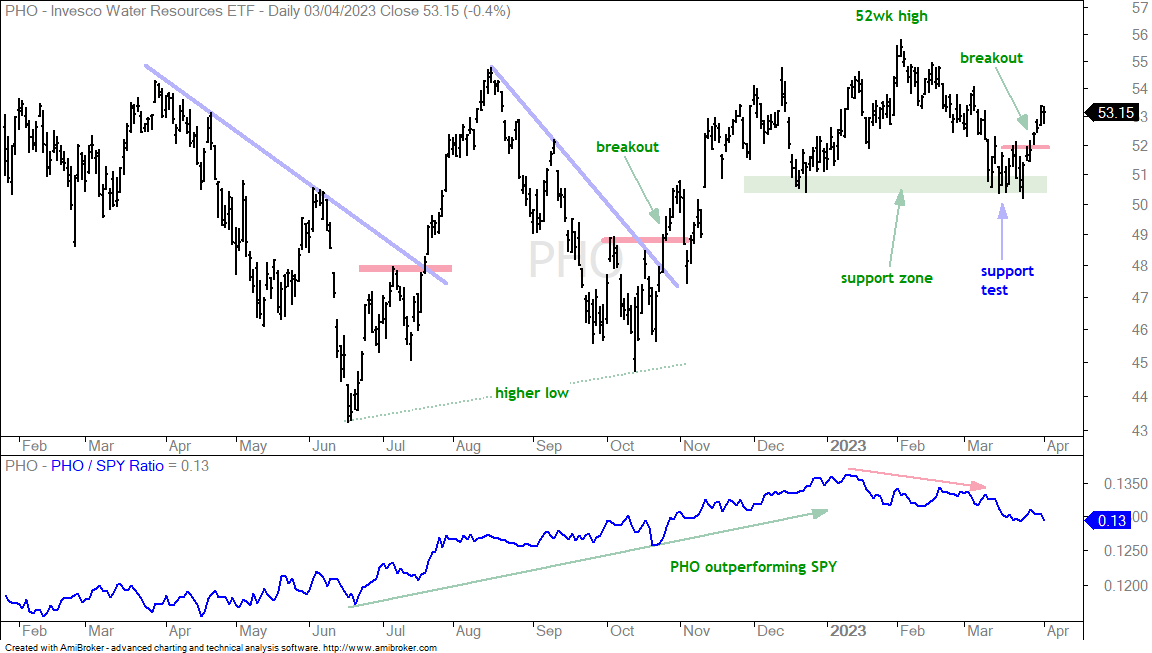
The next chart shows the Water Resources ETF (PHO) testing support for two weeks in March and breaking out with a surge the last seven days. The bottom window shows the PHO:SPY ratio falling since January as PHO underperforms SPY. This is not a big surprise because large-caps and large-cap techs are leading right now. I am more focused on the actual price chart and the setup in PHO.
Home Construction ETF Joins Breakout Parade (ITB)
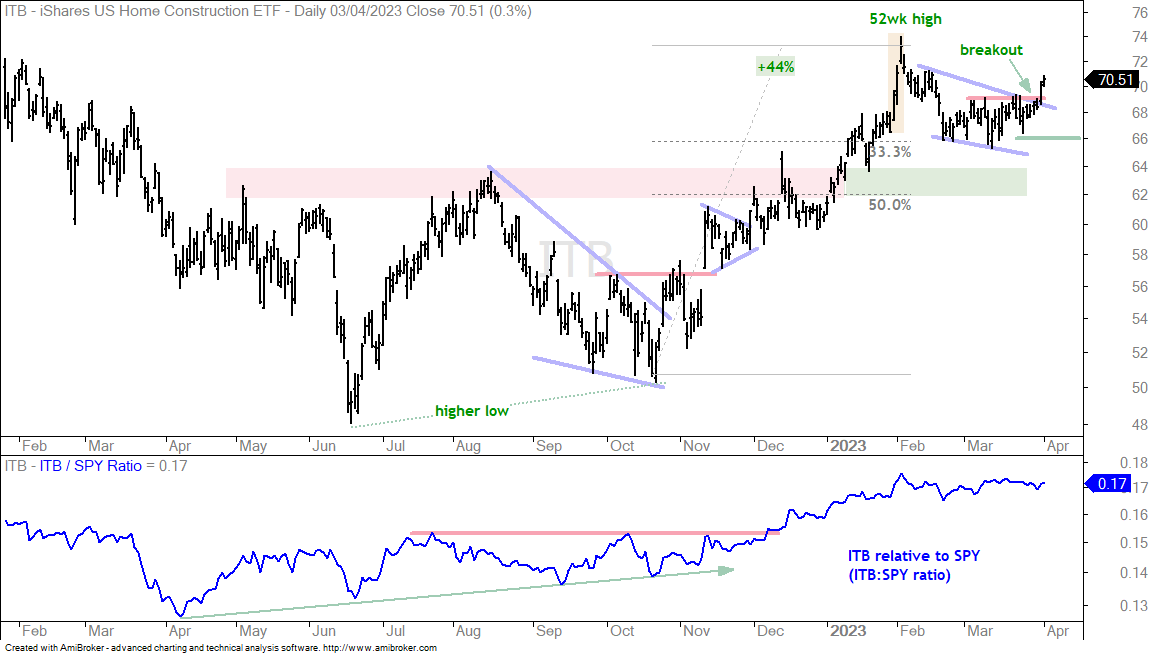
The Home Construction ETF (ITB) led the market from late December to early January and then corrected into March. The pullback was relatively mild as the ETF retraced a little more than a third of the prior 44% advance. A falling wedge type pattern formed and ITB broke out with a surge on Friday. The breakout is bullish until proven otherwise and I will set my re-evaluation level at 66. This is just below the low before the breakout.
EW Consumer Discretionary and Retail Break Out (RCD, XRT)
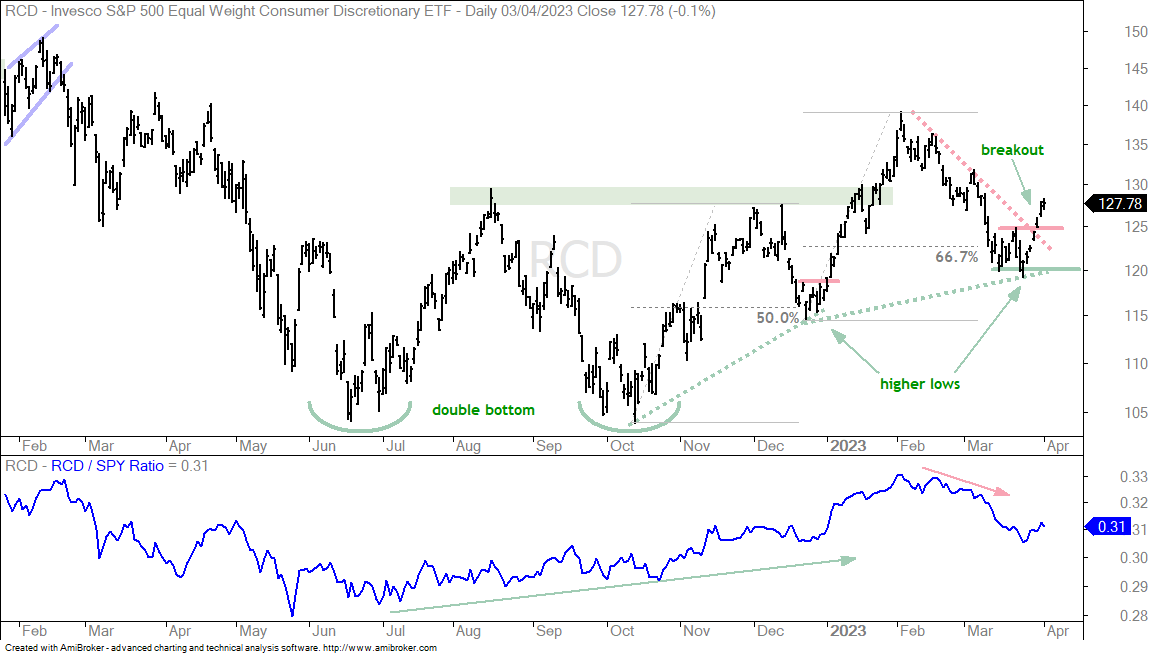
I was watching the EW Consumer Discretionary ETF (RCD) and the Retail SPDR (XRT) for breakouts that would show upside participation in some economically sensitive parts of the market. The first chart shows RCD with a sharp decline from 140 to 120, some firming around 120 and a short-term breakout last week. The February-March pullback extended further than a normal correction, but RCD managed to firm near the 67% retracement line. Also note that RCD formed another higher low because it held above the December low. This short-term breakout keeps the bigger uptrend alive and is bullish as long as it holds. I will simply set support at 120 and turn bearish on a break below this level.
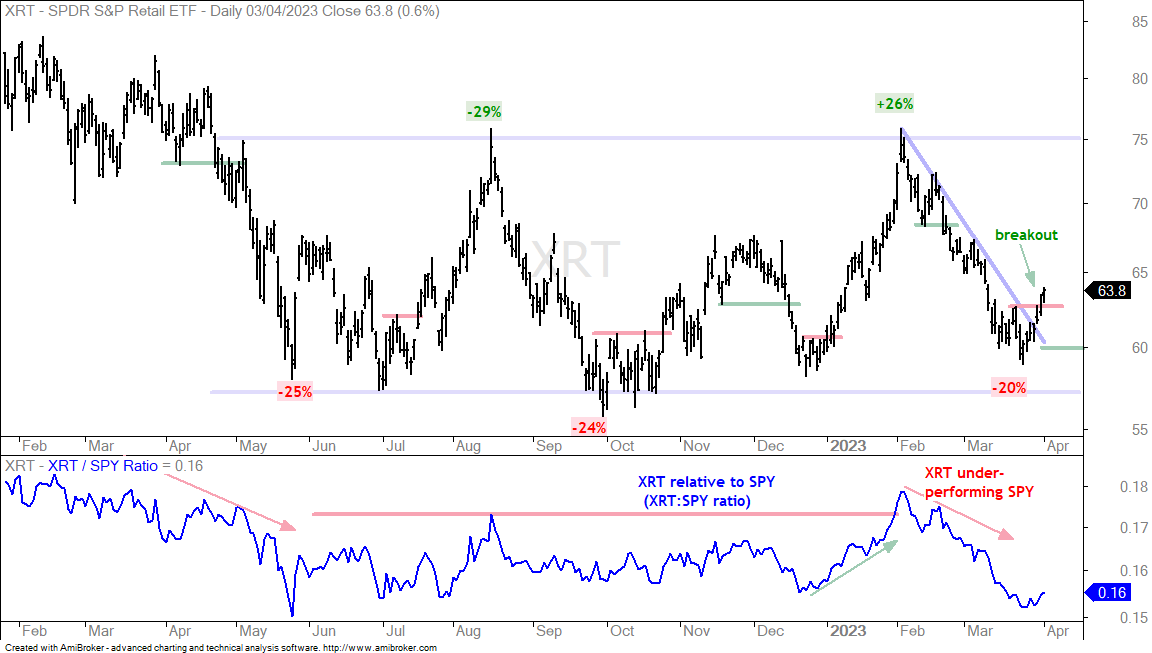
The next chart shows the Retail SPDR (XRT) within a trading range since May. There is support in the upper 50s and resistance in the mid 70s. The swings within the range are 20 to 29 percent. XRT hit the lower end of this range in late March and broke short-term resistance with a surge above 63 last week. This move reverses the downswing and I am setting my re-evaluation level at 60.