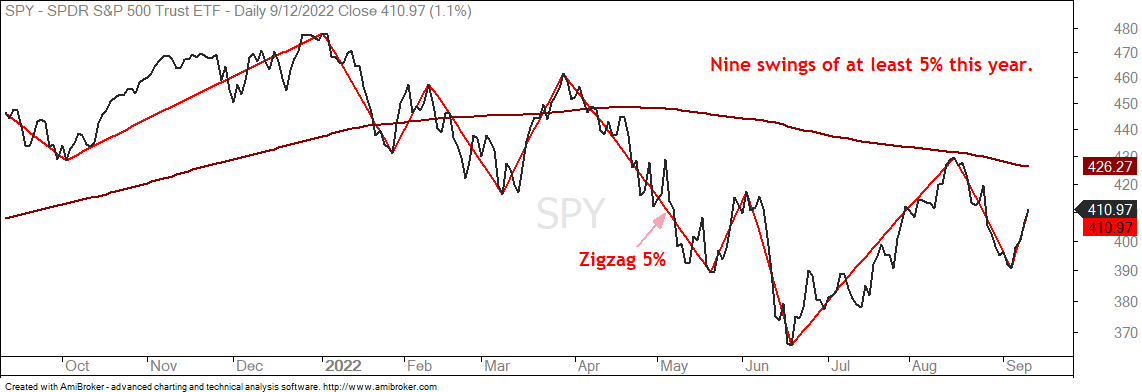
Stocks surged the last four days with another big move. It seems that there is no such thing as “average” anymore as we are seeing big moves both up and down. The chart below shows SPY with the 5% zigzag in red. This red line only shows moves that are greater than 5% and we have seen nine already this year.
Volatility is above average and stocks are showing short-term resilience, but the weight of the evidence remains bearish for stocks. The Composite Breadth Model is negative, the major index ETFs are below their falling 200-day SMAs and the big sectors are in downtrends. There are, however, pockets of strength within the market and I remain focused on these pockets. I continue to monitor for new pockets of strength.
About the ETF Trends, Patterns and Setups Report
This report contains discretionary chart analysis based on my interpretation of the price charts. This is different from the fully systematic approach in the Trend Composite strategy series. In this ETF Trends, Patterns and Setups report, I am looking for leading uptrends and tradable setups within these uptrends. While I use indicators to help define the trend and identify oversold conditions within uptrends, the assessments are mostly based on price action and the price chart (higher highs, higher lows, patterns in play). Sometimes the chart assessment can be at odds with the indicators.
This Week's Commentary Schedule
Tuesday – 13 September: Market-ETF Report and Signal-Rank Table Update
Wednesday – 14 September Market-ETF Video and Market Regime Update
Thursday – 15 September: Market-ETF Report and Signal-Rank Table Update
Saturday – 17 September: ETF Signal and Rank Table
Composite Breadth Model Deteriorates
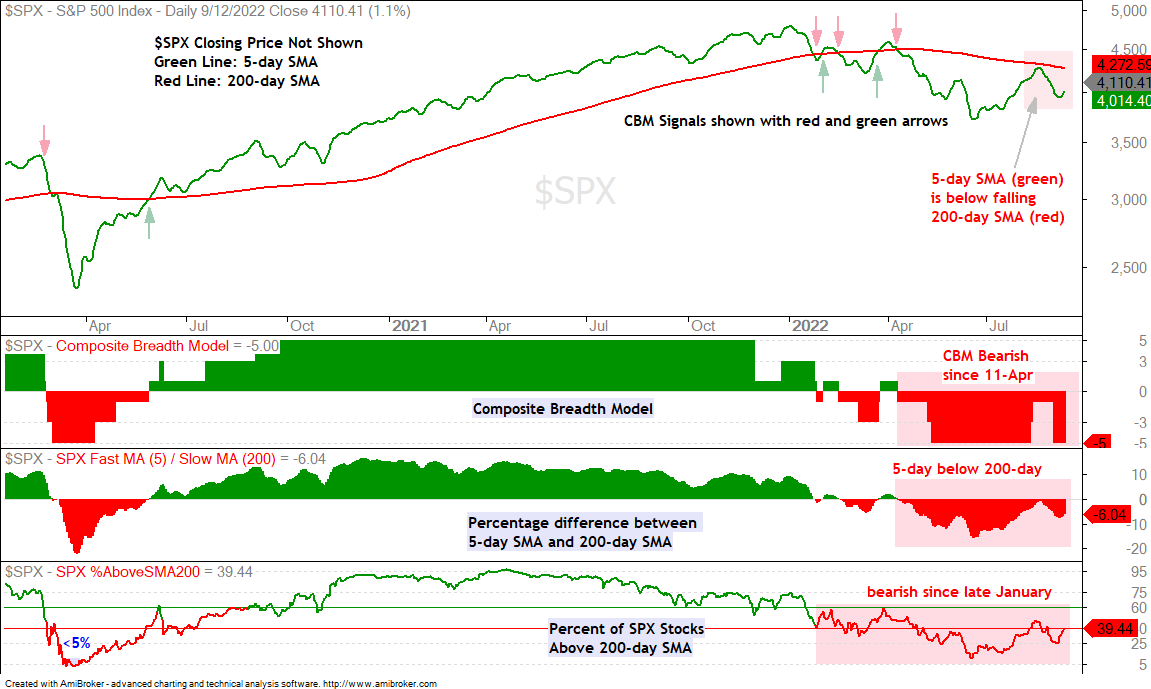
The Composite Breadth Model (CBM)[1] remains at -5, which means all five inputs are bearish. The 5-day SMA is around 6% below the falling 200-day SMA and around 40% of S&P 500 stocks are above their 200-day SMAs, which means 60% are below. These two metrics alone are enough to show that the bears still have the edge when it comes to the long-term trend.
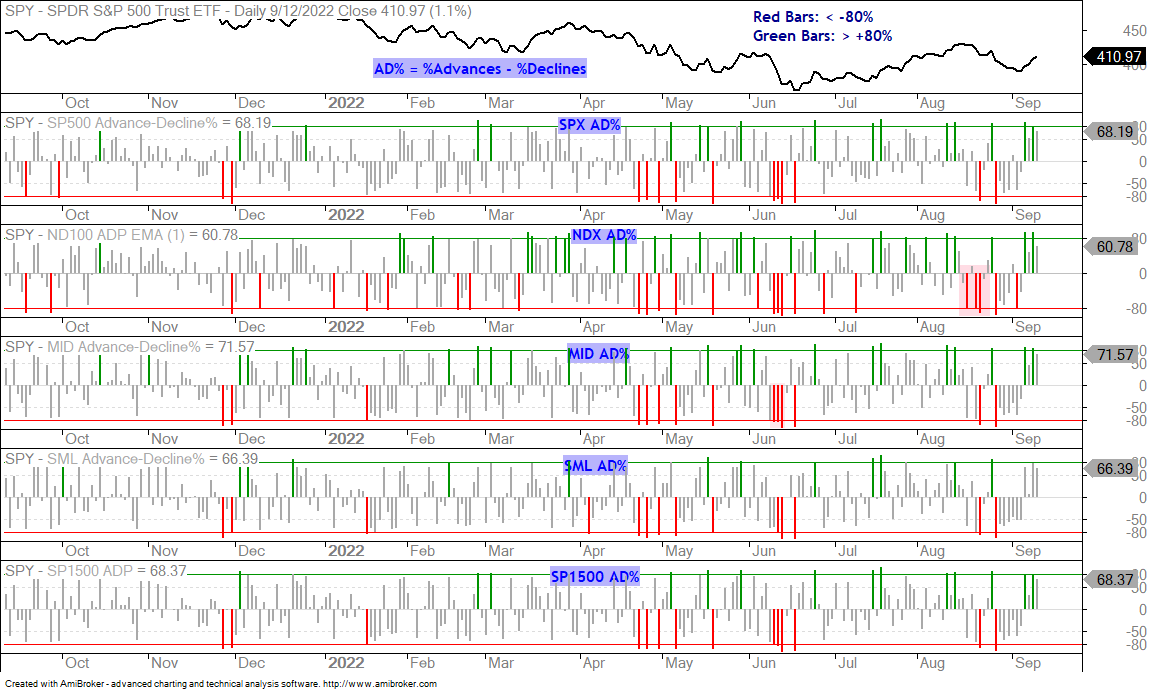
There were some strong upside days last week as S&P 500 Advance-Decline Percent exceeded +80% twice, which means more than 90% of stocks advanced on those days (90% advances – 10% declines = +80%). The chart below shows AD% for the S&P 500 in the first indicator window. We are seeing a lot of these “all or nothing” days as S&P 500 AD% exceeded +80% twelve times since early May. Readings above +80% show strong upside participation, but we need to see some trend indicators turn bullish to turn the Composite Breadth Model around.
SPY Alleviates Oversold Condition
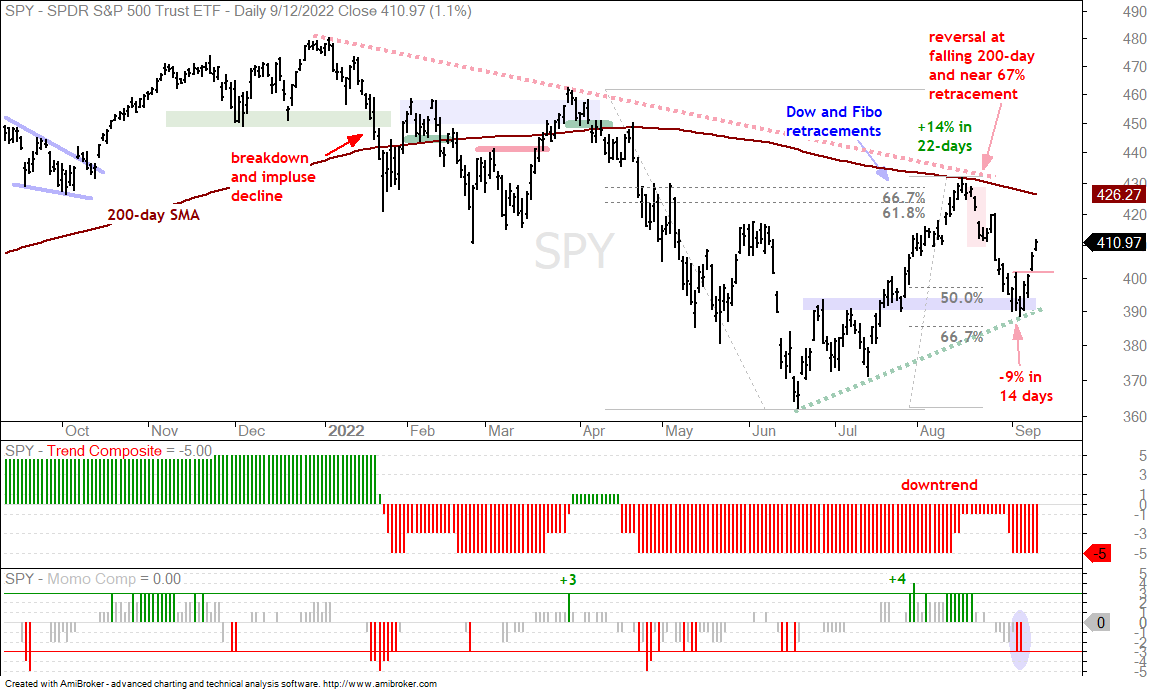
Stocks surged over the last four days with the S&P 500 SPDR (SPY) gaining around 5%. Note that it fell around 9% over a 14 day period before this surge started. Five day momentum is impressive and SPY closed near its intraday high four days in a row. Even so, I still consider this a counter-trend bounce because the weight of the evidence is bearish (CBM) and SPY is well below its falling 200-day SMA. SPY was very oversold in early September and this bounce has alleviated these oversold conditions. Also note that the current 5% surge has retraced around half of the prior 9% decline and the going could soon get tougher.
Trend-followers are always late to the party. Some might say fashionably late, while others might say too late. Nobody knows if this current surge will result in a long-term trend change and bullish signal from the Composite Breadth Model (CBM). The bulls will seen an uptrend emerging because of the strong advance from mid June to mid August, the normal pullback that retraced 50-67% and the strong surge to forge a higher low (green dashed line). This would be the early bird signal. Personally, I will wait for more bullish trend evidence before turning bullish (card-carrying trend follower).
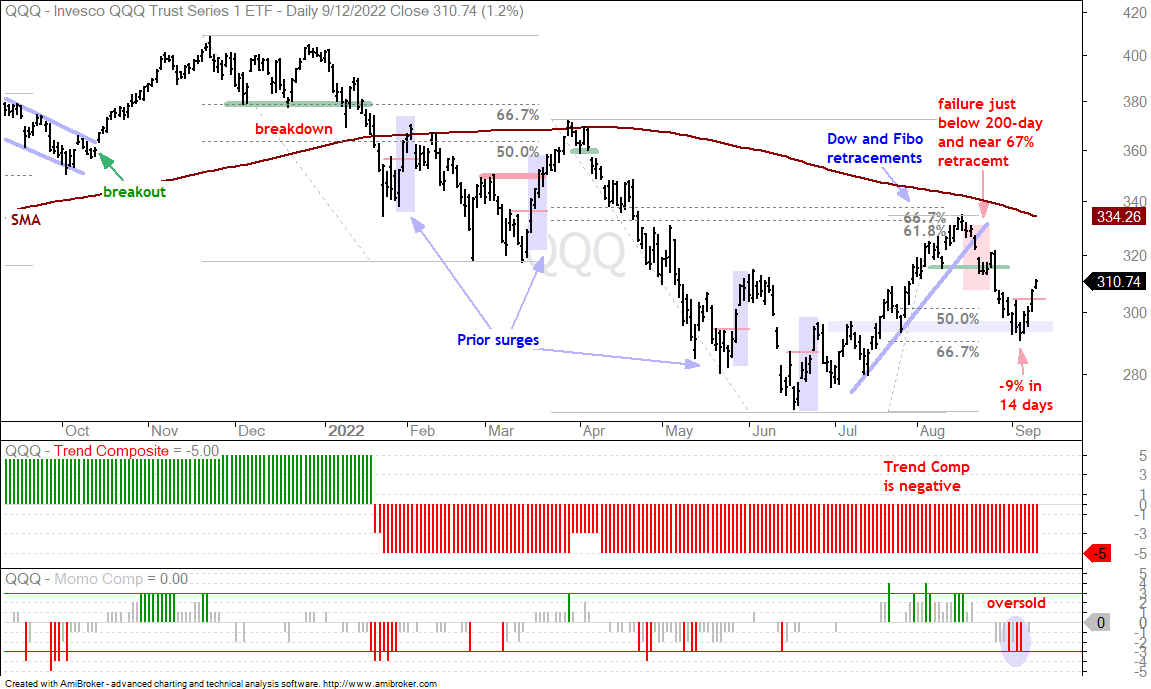
The next chart shows QQQ with similar characteristics overall. The ETF surged some 6% the last four days and broke short-term resistance (red line). This is also deemed a counter-trend advance because the ETF is still in a long-term downtrend (below falling 200-day and negative Trend Composite). The blue rectangles show short-term surges and breakouts in early February, mid March, late May and mid June. Sharp surges in bear markets are not uncommon. One surge will be “the one” that leads to a bigger trend reversal, but right now the bigger trend remains down until proven otherwise.
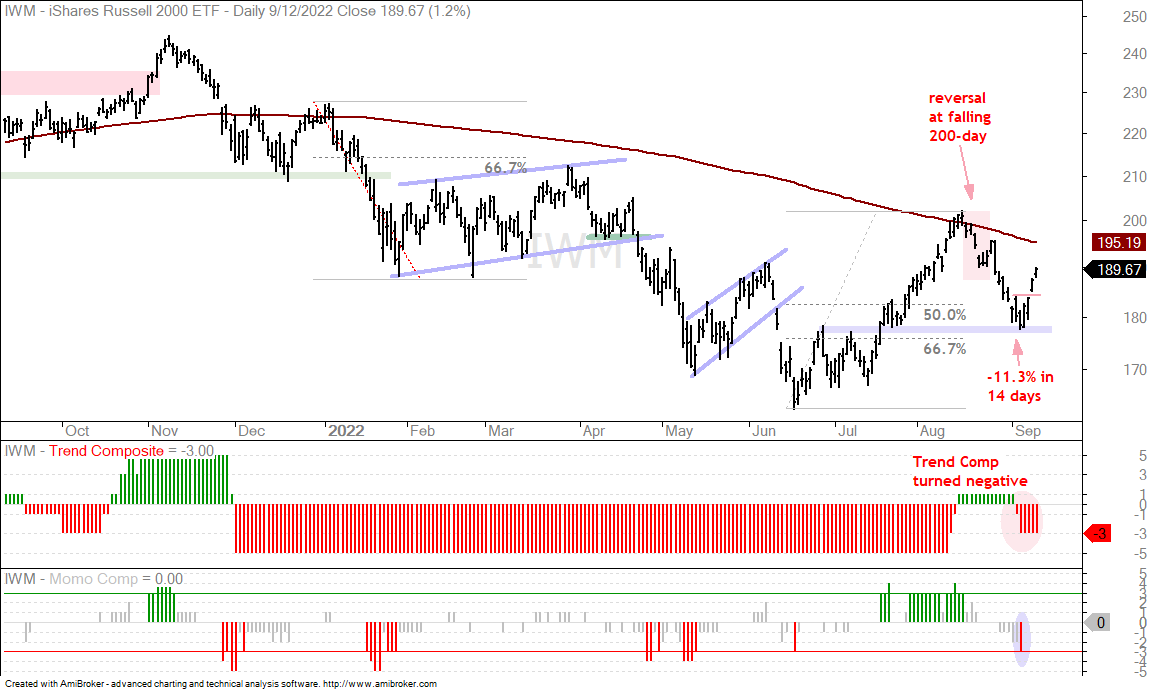
The next chart shows the Russell 2000 ETF (IWM) with a similar pullback into early September and surge over the last four days. IWM is the closest of the three to its falling 200-day and is also the only one to break its falling 200-day in mid August. I am not, however, going to take my cues from small-caps because they account for less than 10% of the total US equity market. Signals in SPY and QQQ carry much more weight. In particular, leadership from QQQ and Technology would be most welcome and we have yet to see that.
Big Sectors Get Breakouts within Downtrends (XLK, XLY, XLF, XLI)
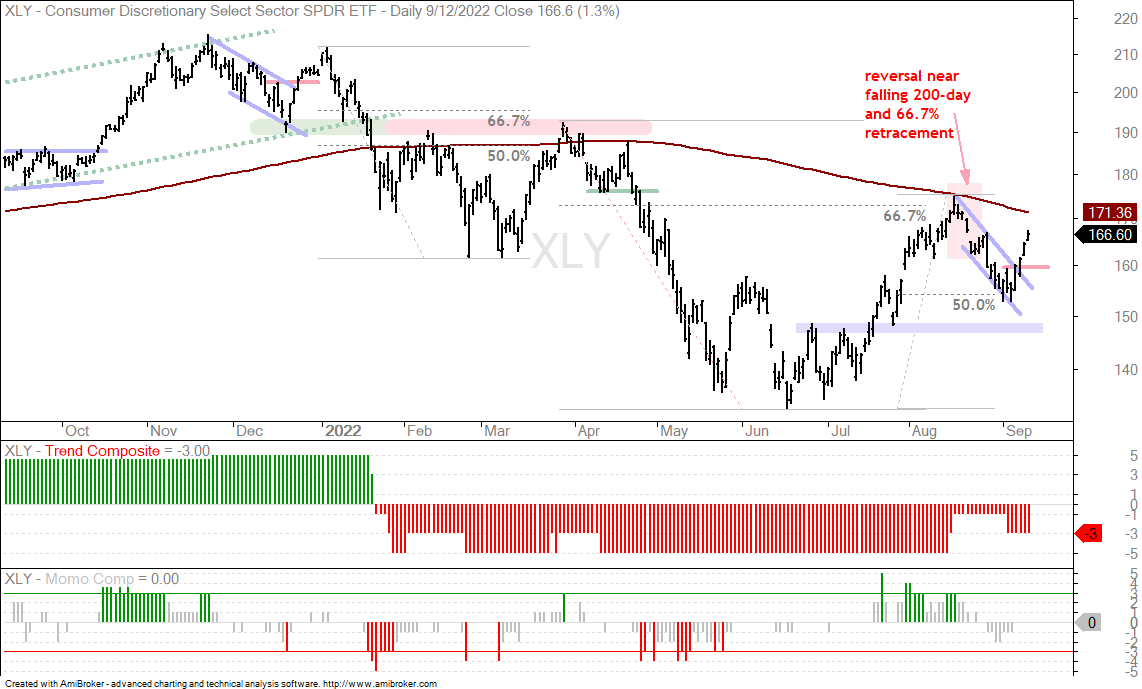
Last week I noted that there are dozens of ETFs trading in support-reversal zones. Basically, almost all stock-based ETFs moved sharply higher into mid August and then fell sharply into early September. These declines returned to broken resistance zones and/or retraced 50 to 67 percent of their prior advances. Broken resistance turns support and the 50-67% retracement area is a reversal zone. Some ETFs formed falling flags or wedges as well. The first chart shows the Consumer Discretionary SPDR (XLY) with a falling flag to the 50% retracement and a breakout the last four days.
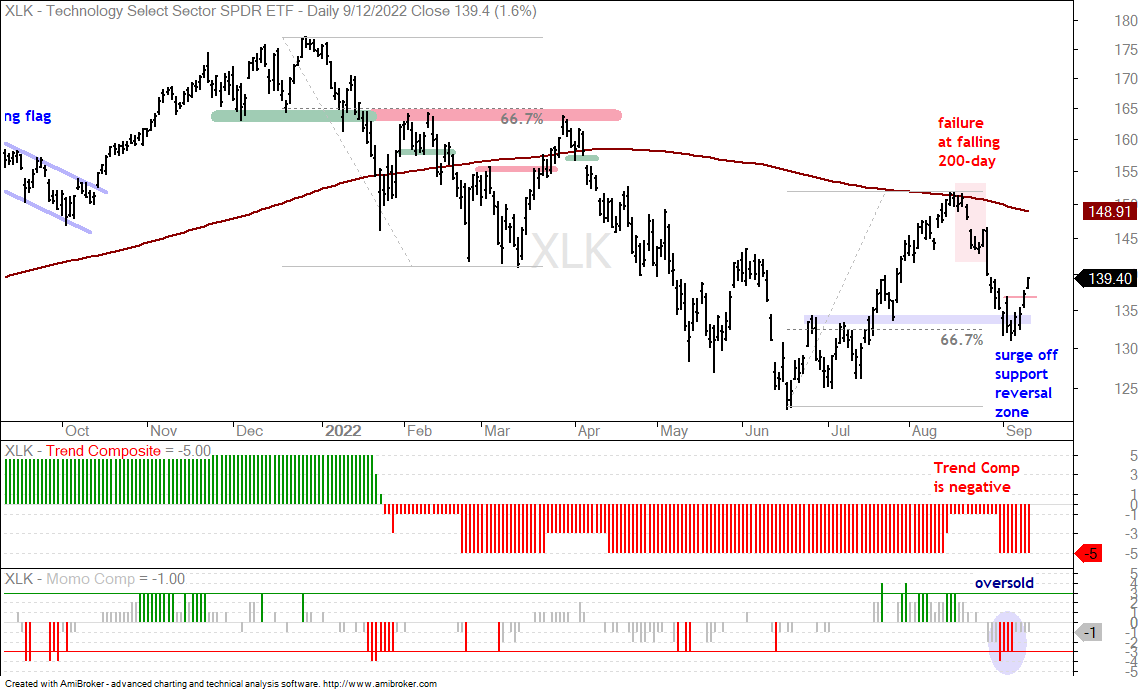
The second chart shows the Technology SPDR (XLK) with a sharp decline to broken resistance, a 67% retracement and a short-term breakout the last four days.
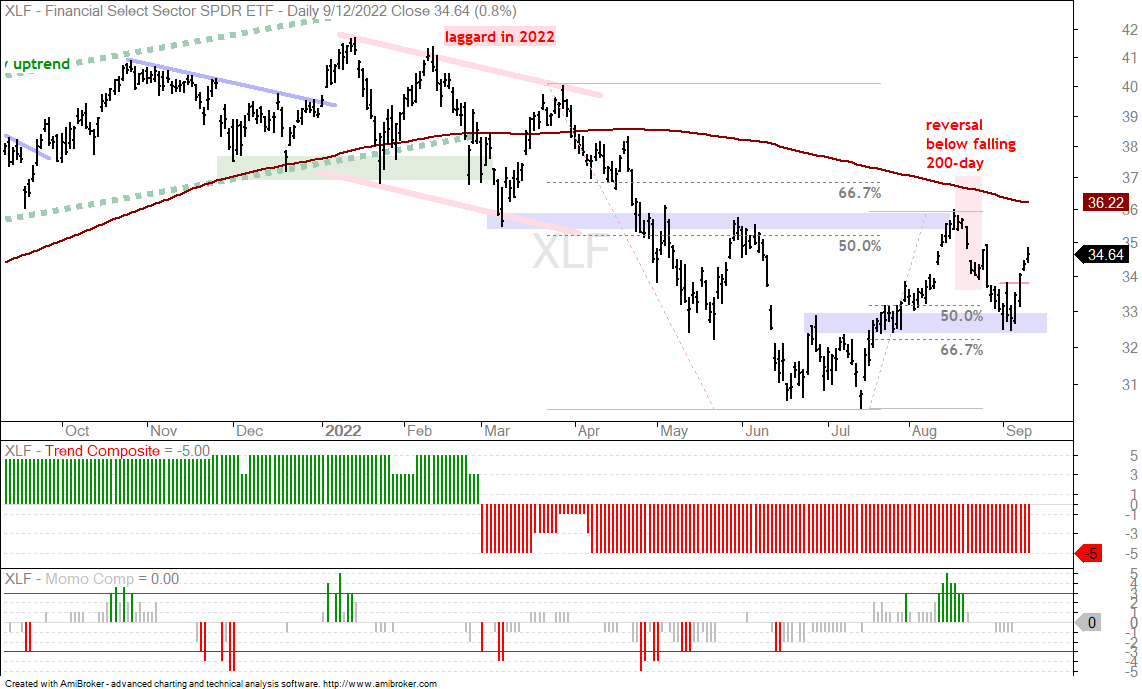
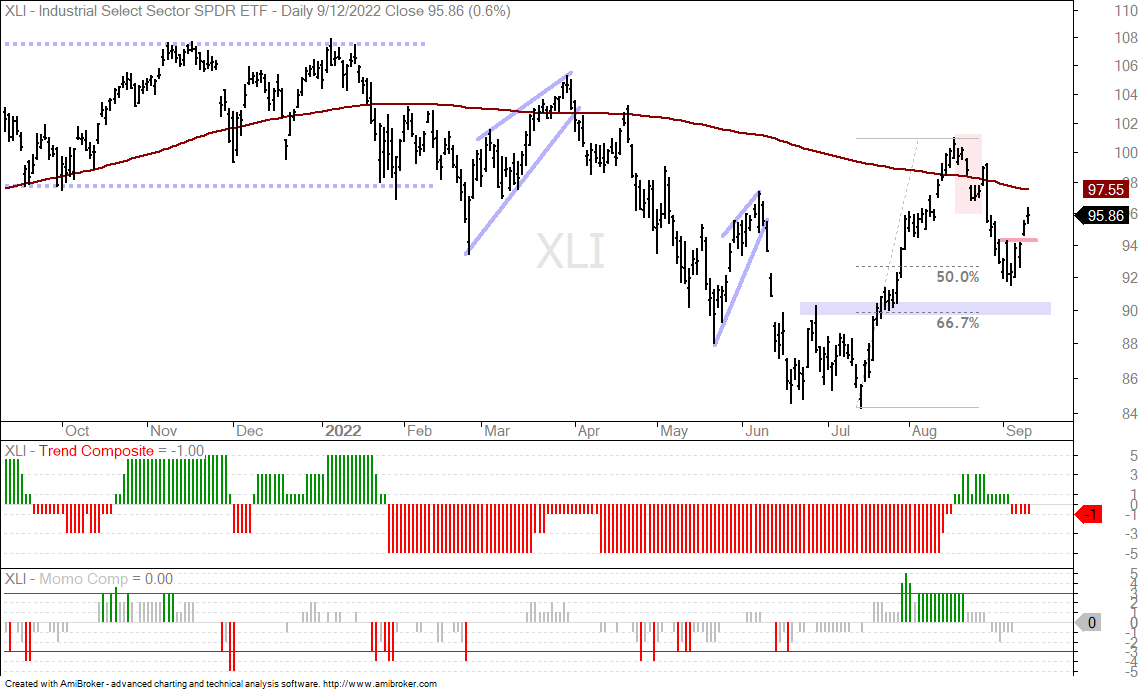
We also have the Finance SPDR (XLF) and the Industrials SPDR (XLI) with short-term breakouts.
These short-term breakouts may be bullish, but all four are below their falling 200-day SMAs and their Trend Composites are negative. XLY and XLK have been in downtrends since late January, XLF has been in a downtrend since March 1st and XLI whipsawed back to a downtrend in September. Note that the Communication Services SPDR (XLC) is the basket case of the group because it hit a new low in early September. The short-term breakouts in the other four are positive, but these bounces are still considered counter-trend advances within bigger downtrends. Note that these five sectors account for 66% of the S&P 500 SPDR (SPY).
Laggards Lead Short-term, but Most ETFs Still in Downtrends
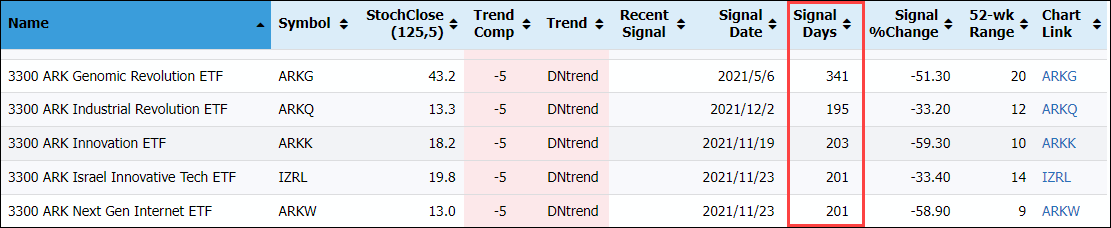
All stock-based ETFs advanced the last four days. These include the major index ETFs, the sector ETFs and the industry group ETFs. Some of the most beaten down ETFs had the biggest gains as ARKF, ARKW, ARKK, BLOK, GDXJ, IBUY and XHE surged over 10% in four days. There are, however, two kinds of surging ETFs: those in uptrends already and those still in downtrends. The image below shows that the ARK ETFs have been in downtrends for nine months or more.
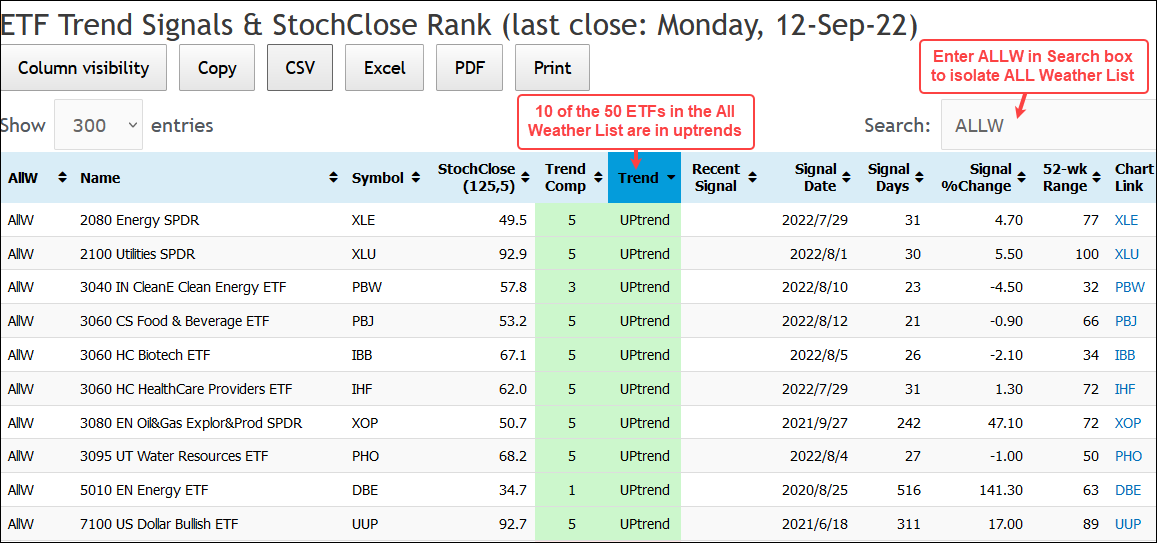
My focus is on ETFs that were already in uptrends and/or showing some sort of relative strength. ETFs that were in downtrends and lagging were ignored. Most of the ETFs in the master list are in downtrends and this means the focus list is still quite limited. Groups in focus include utilities, dirty energy, clean energy and biotech. The image below shows the All Weather ETFs that are in uptrends. There are 36 stock based ETFs and 14 non-stock ETFs in the All Weather List. 10 of the 50 are in uptrends right now, which means 40 (80%) are in downtrends.
New Downtrend Signals and a Lone Uptrend Signal
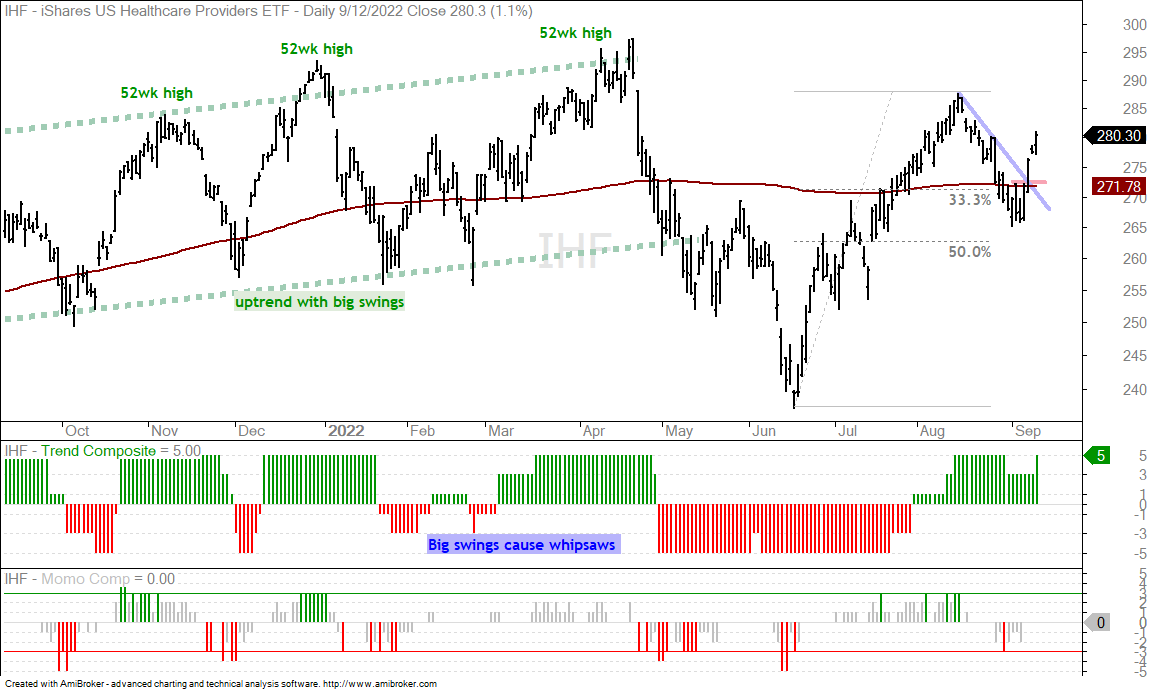
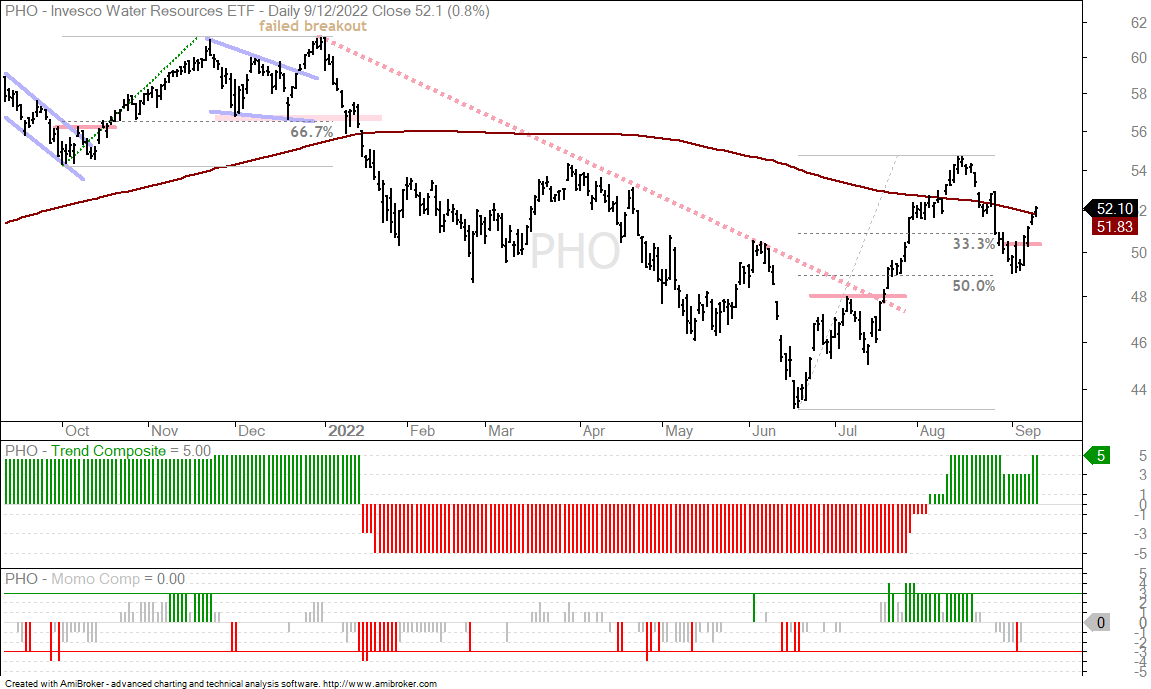
The Healthcare Providers ETF (IHF) and Water Resources ETF (PHO) broke out after retracing 33-50% of the prior advance.
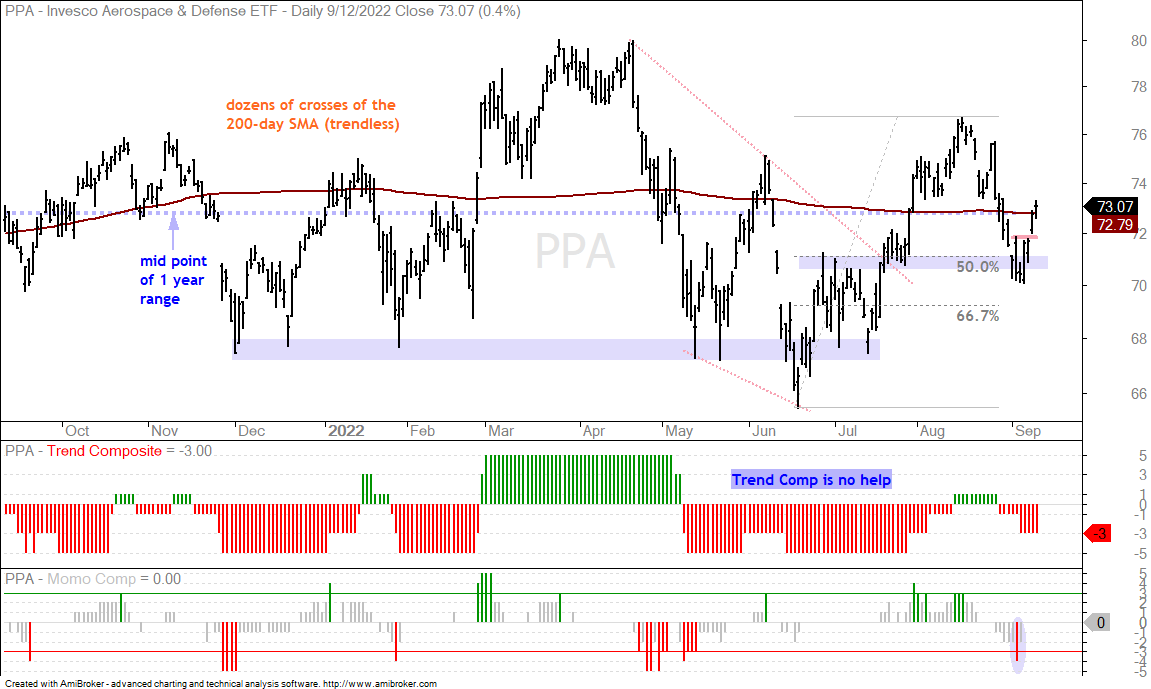
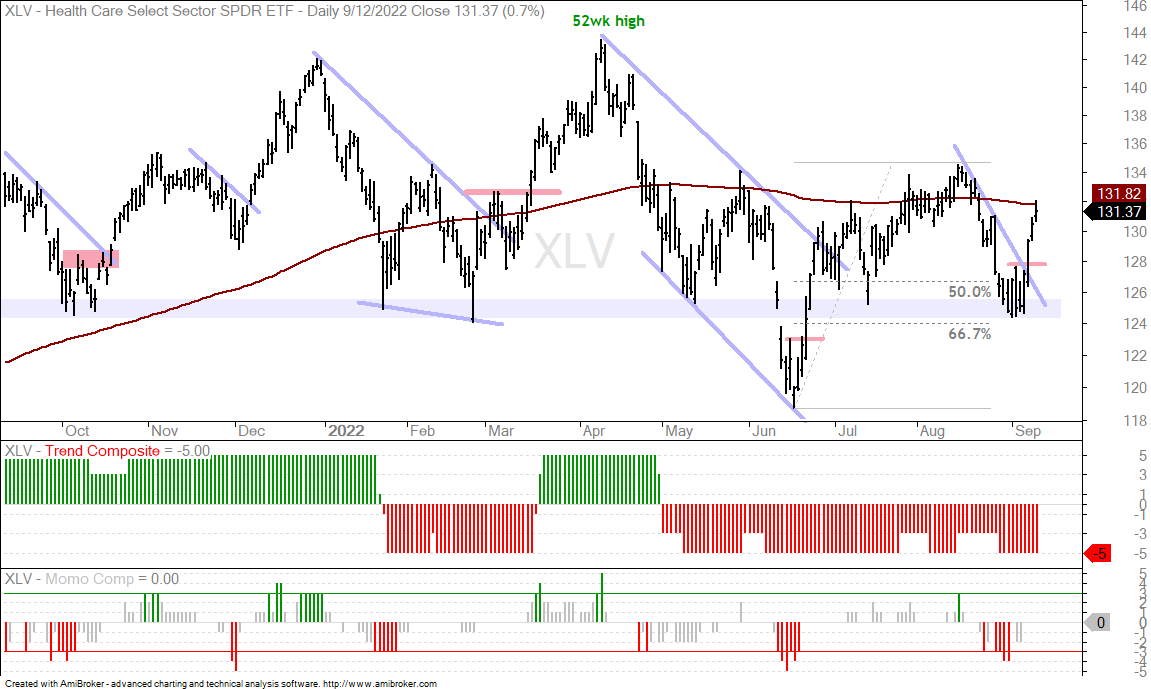
Of those in downtrends or long trading ranges, it is worth noting that the Aerospace & Defense ETF (PPA) and Healthcare SPDR (XLV) tagged their 200-day SMAs and are holding up better than most ETFs since late January.
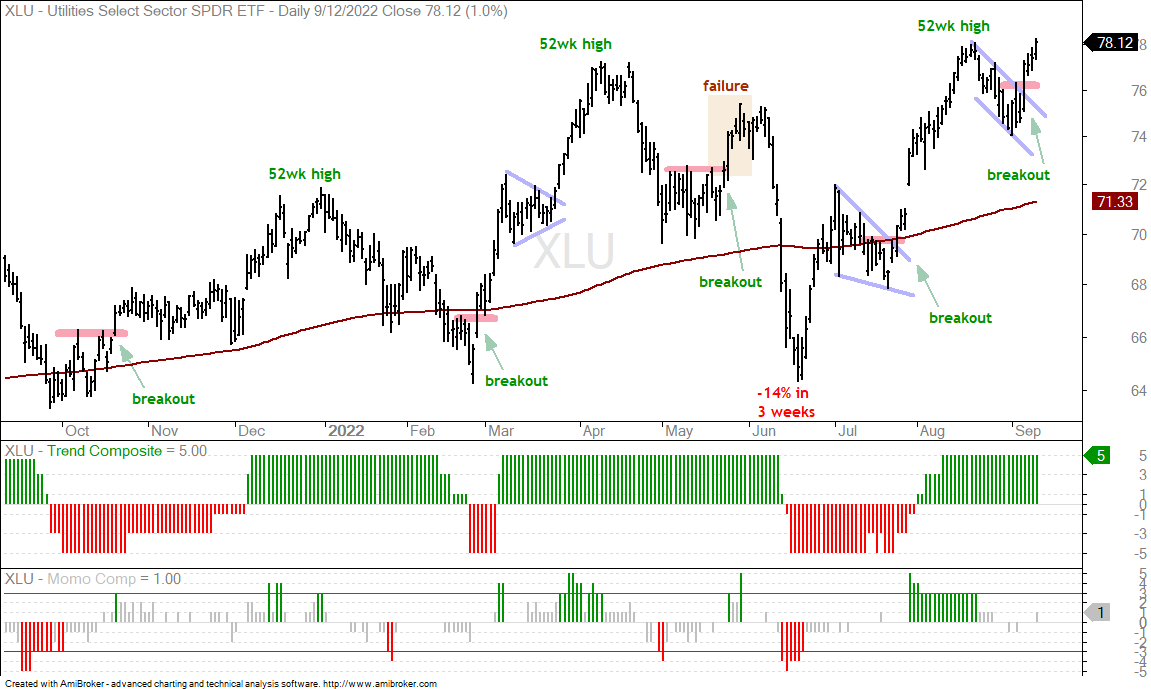
The Utilities SPDR (XLU) is the strongest of the eleven sectors simply because it is the only one that hit a new 52-week high. The chart below shows XLU hitting a new high in mid August, correcting with a falling flag into early September and breaking out with a surge last week. The green arrows show prior breakouts for reference and study. As an aside, our home energy bill has more than doubled and also hit a 52-week high.
Oil Bounces within Downtrend as NatGas Firms
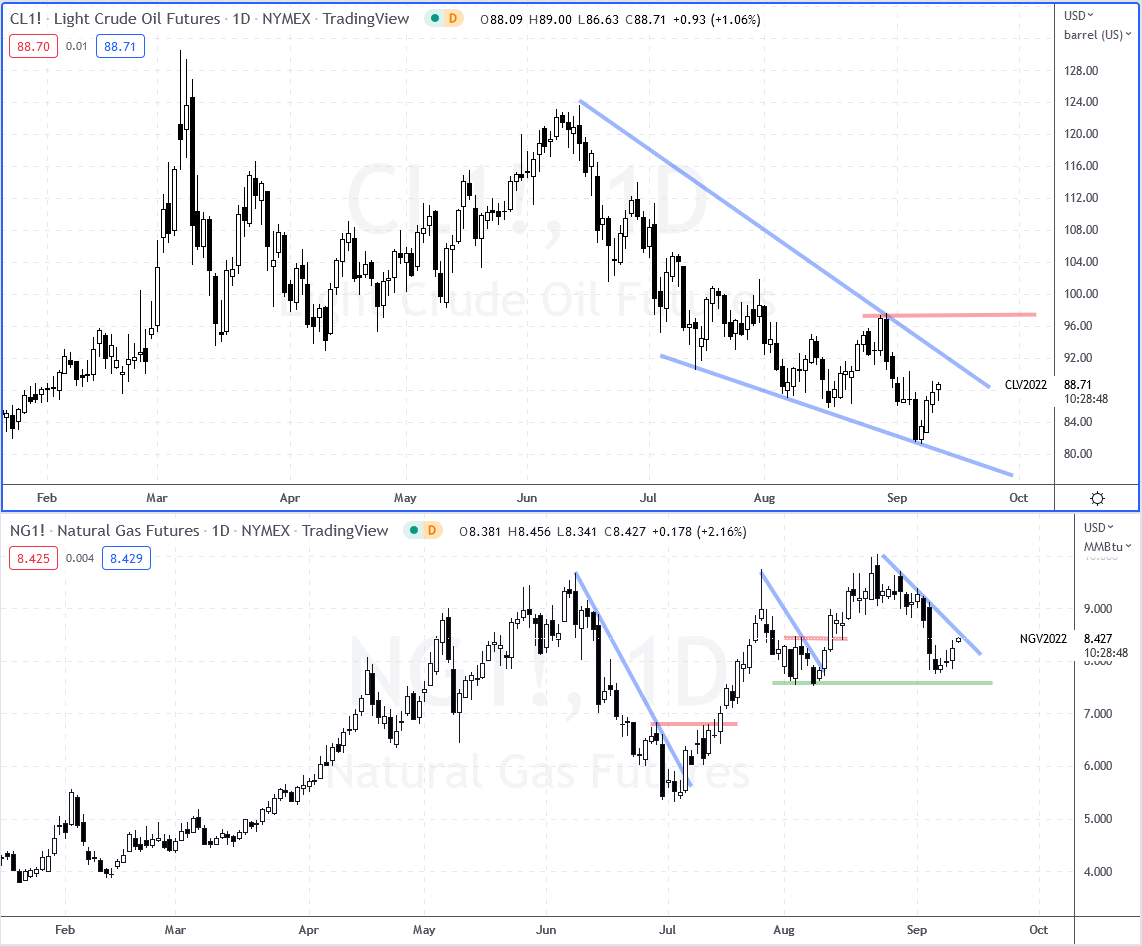
Oil is in a downtrend, Gasoline is in a downtrend and Natural Gas is in an uptrend. The first chart shows Light Crude Futures (CL1!) with a long falling wedge and a fresh lower low in early September. Oil bounced with the rest of the risk-on trade the last four days, but this is a bounce within a bigger downtrend.
The lower window shows Natural Gas Futures (NG1!) moving higher in July and August, which is when oil moved lower. NG hit a new high towards the end of August and fell back into early September. This is considered a pullback within a bigger uptrend and NG firmed just above the early August lows. Watch for a trendline break to signal a continuation higher.
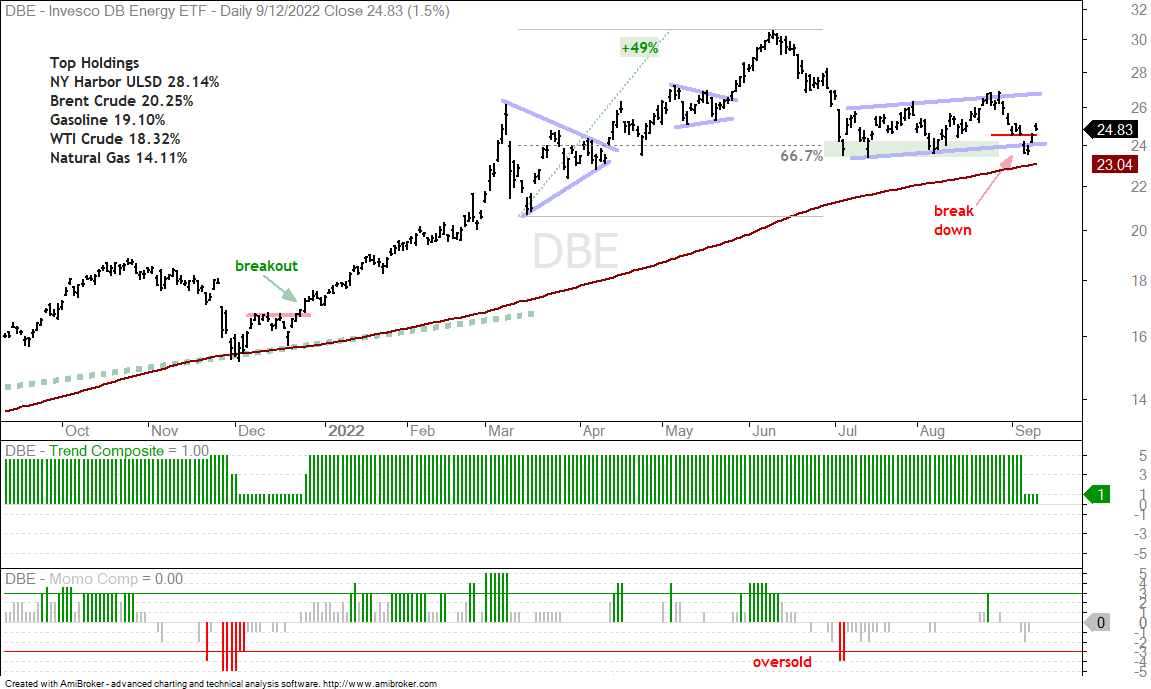
Some 85% of the DB Energy ETF (DBE) is tied to oil and gasoline. Given the downtrends in these two, it is little surprise that DBE broke down last week. The chart below shows DBE falling in June, rising into August with a channel and breaking the channel line last week. DBE bounced the last three days, but I think the rising channel is a bearish continuation pattern and this break could lead to further weakness. This is a subjective call because DBE is above the rising 200-day and the Trend Composite remains at +1.
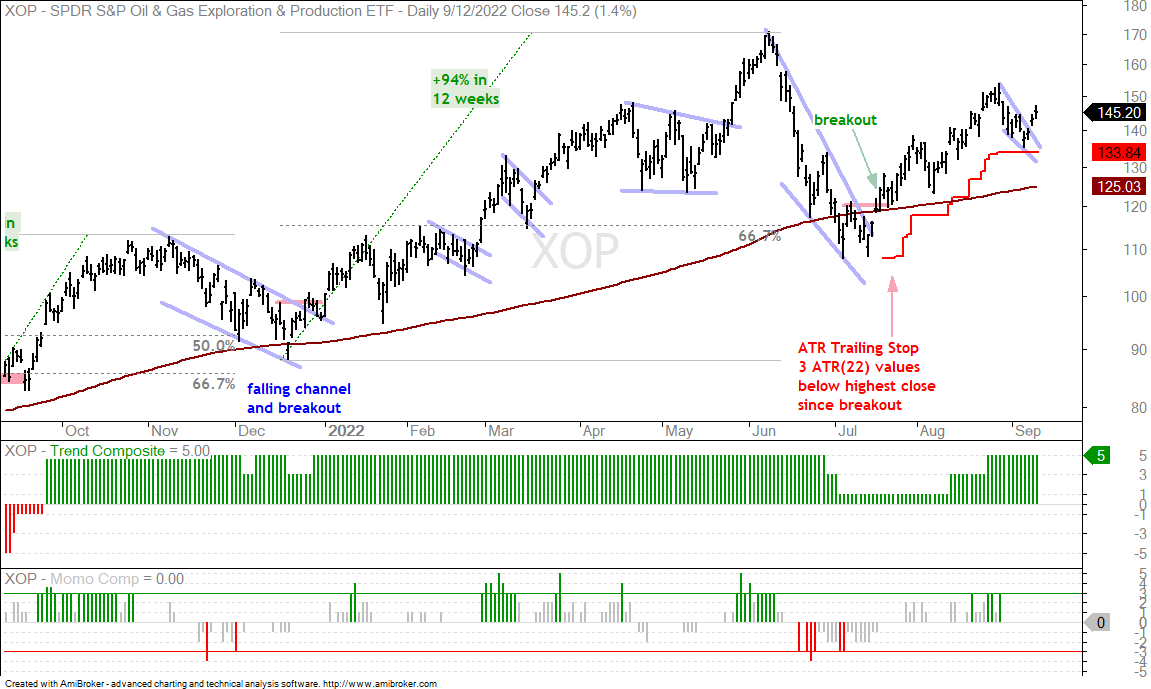
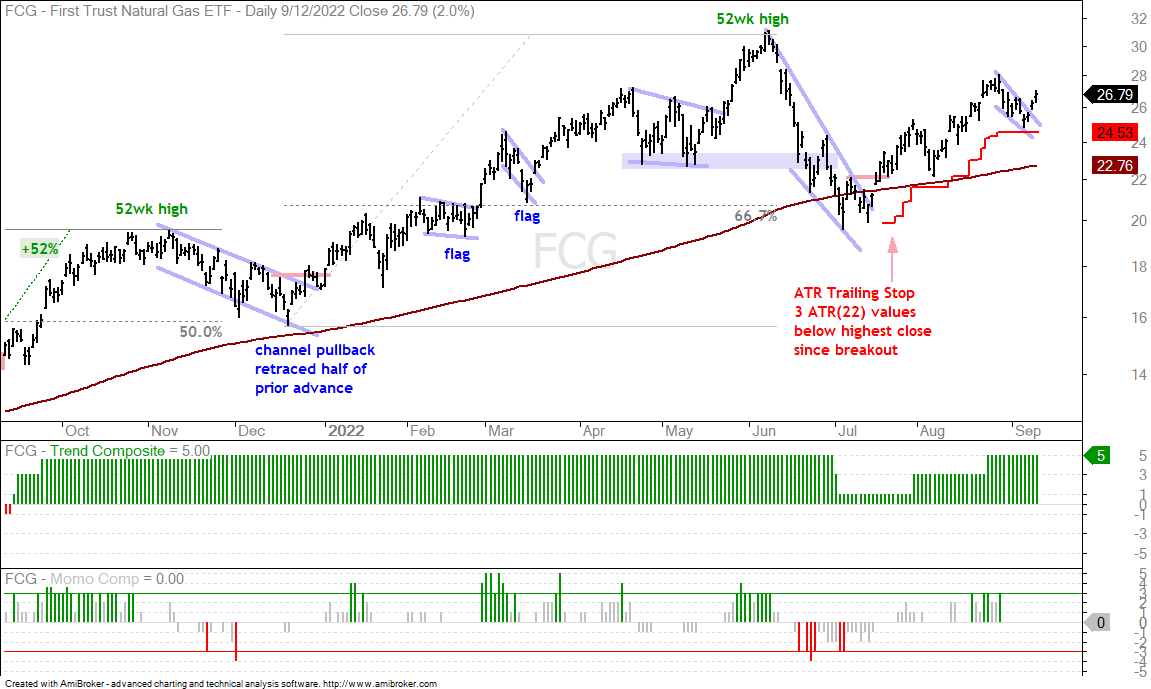
Energy ETFs Holding Up better than DBE (XOP, FCG, XLE)
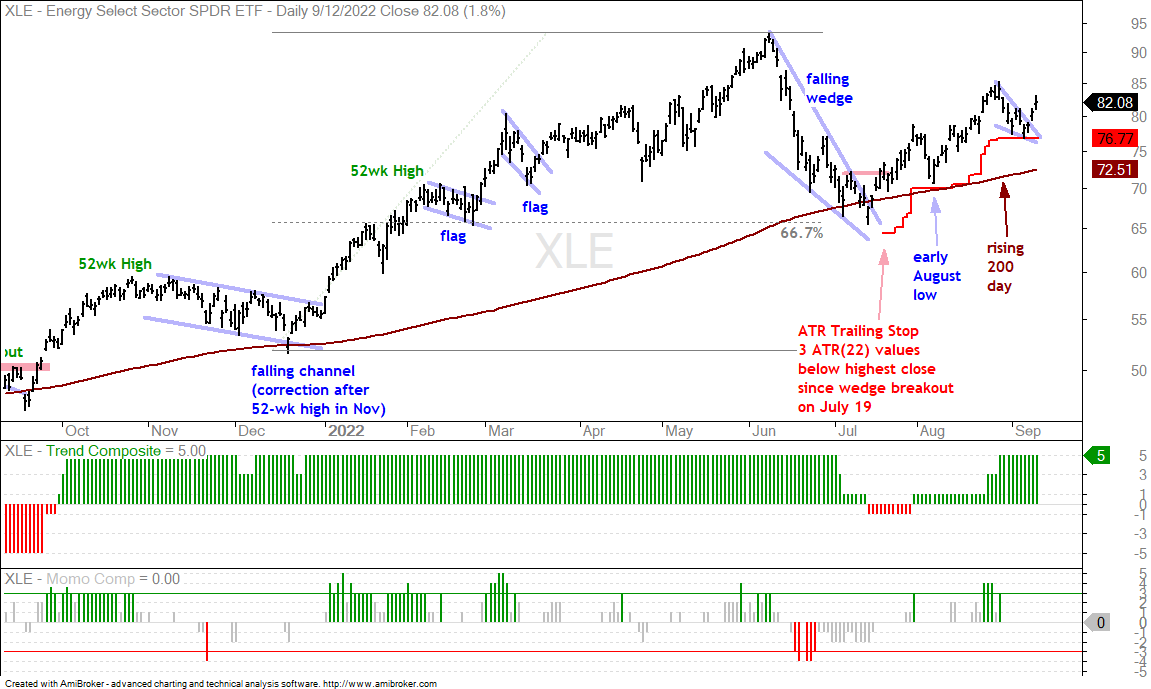
DBE has struggled since July, but the energy-based ETFs are holding their uptrends and trailing stops. The Energy SPDR (XLE), Oil & Gas Exploration & Production ETF (XOP) and Natural Gas ETF (FCG) remain above their rising 200-day SMAs and with positive Trend Composites. They all three pulled back in early September and held their ATR Trailing Stops (3 x ATR(22)) with bounces the last three days. These bounces reinforce the early September low as support and a close below this low would be negative (first lower low).
You can learn more about the ATR Trailing Stop and exit strategies in this post[3], which includes a video and charting options for everyone.
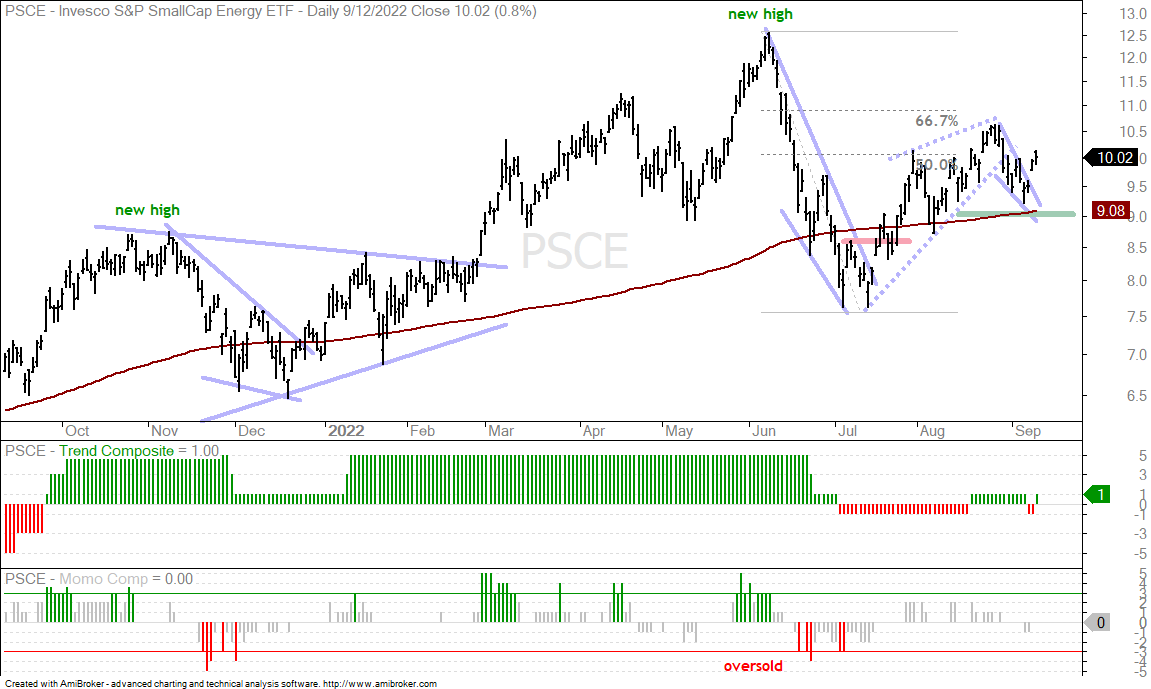
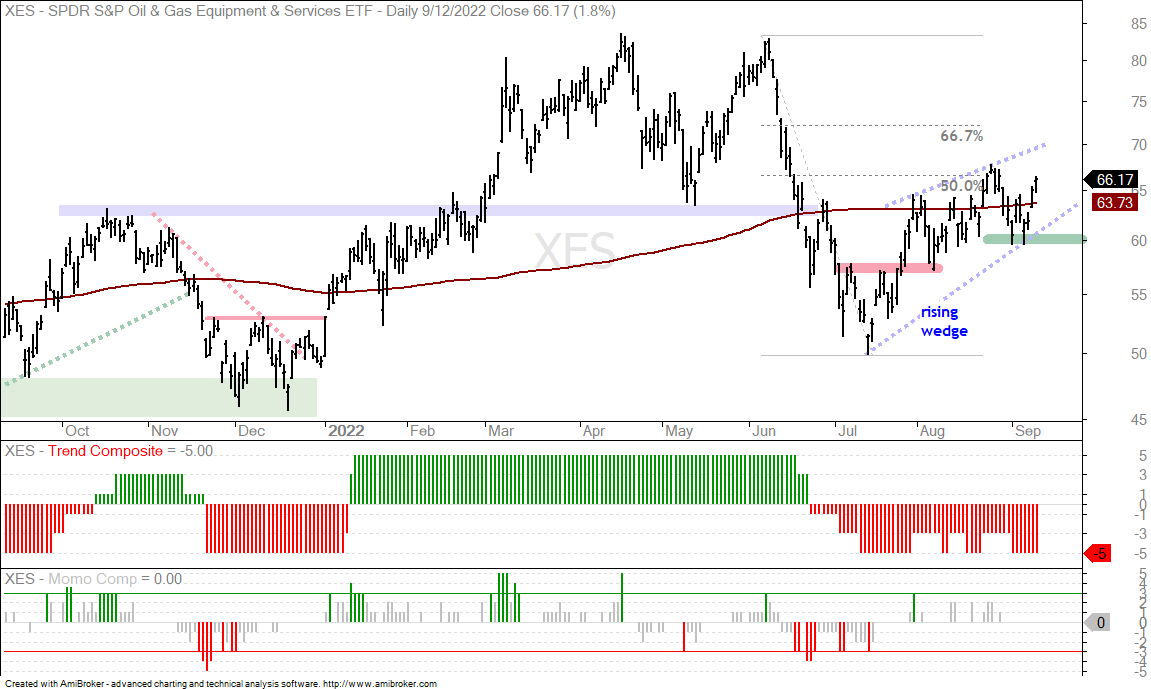
The Small-cap Energy ETF (PSCE) and Oil & Gas Equipment & Services ETF (XES) also bounced to keep their rising wedge uptrends alive. A rising wedge that retraces 50-67% of the prior decline is considered a bearish continuation pattern (counter-trend bounce). However, the trend is up as long as the wedge rises and the last reaction low holds. The green lines mark support at the last reaction low and these two are bullish until proven otherwise.
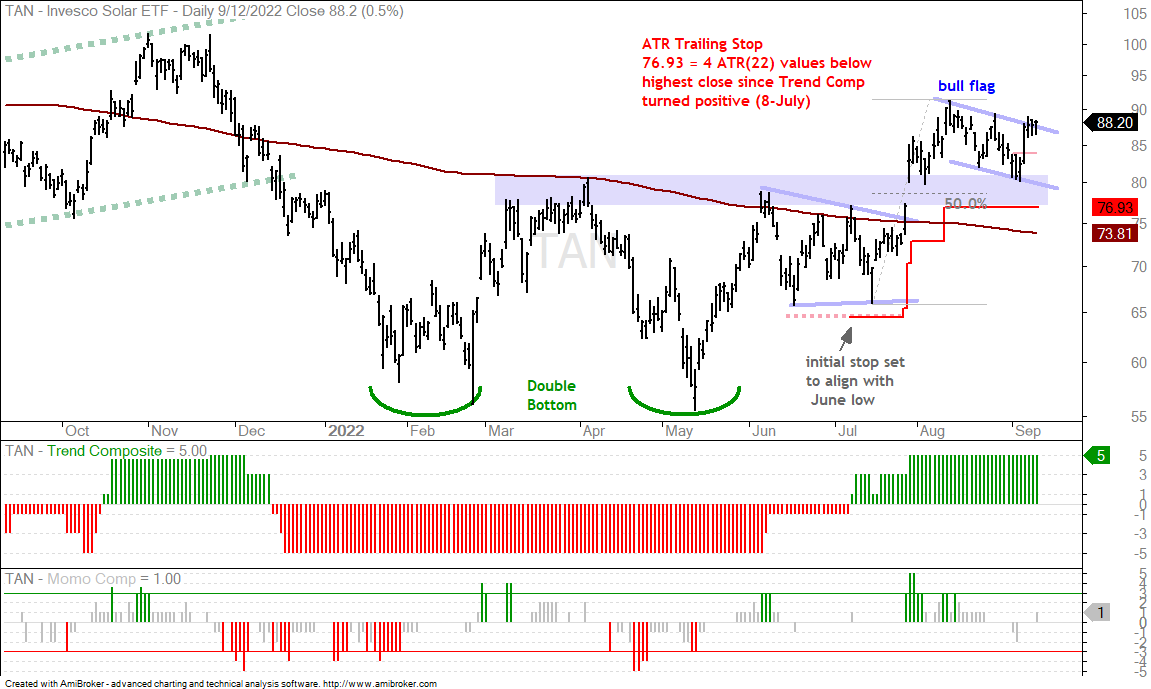
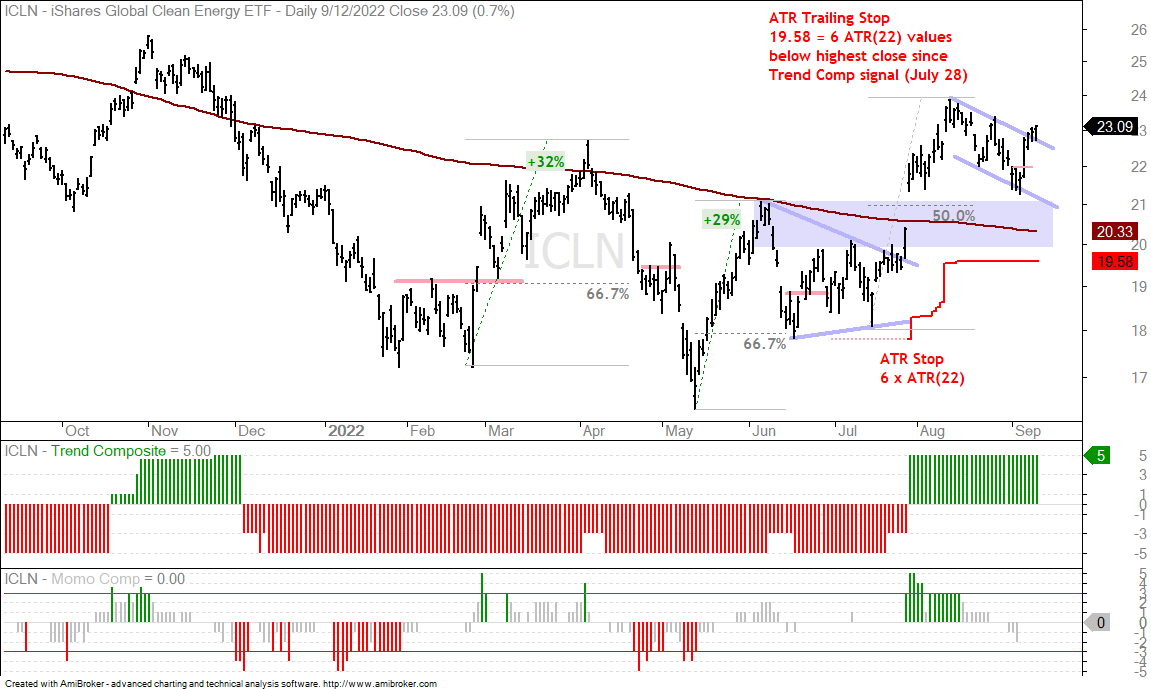
Clean Energy ETFs Form Bullish Continuation Patterns
(TAN, ICLN)
The clean energy ETFs are showing upside leadership because their Trend Composites are positive and they are above their 200-day SMAs. Also note that the Solar Energy ETF (TAN) and Global Clean Energy ETF (ICLN) exceeded their March highs in mid August. Not many ETFs accomplished this feat. TAN and ICLN formed short-term corrective patterns the last few weeks (falling flags). Both are attempting to break out of these patterns, which would signal a continuation of the July-August advance. The red lines mark the ATR Trailing Stops for reference. These started when the Trend Composites turned positive.
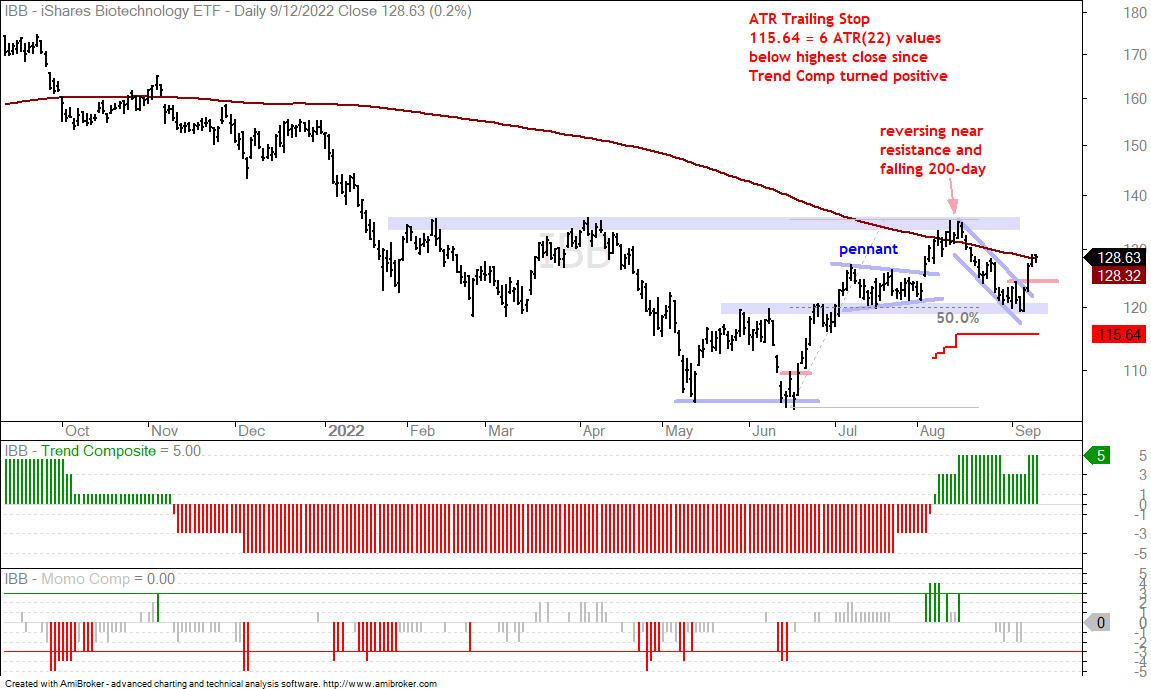
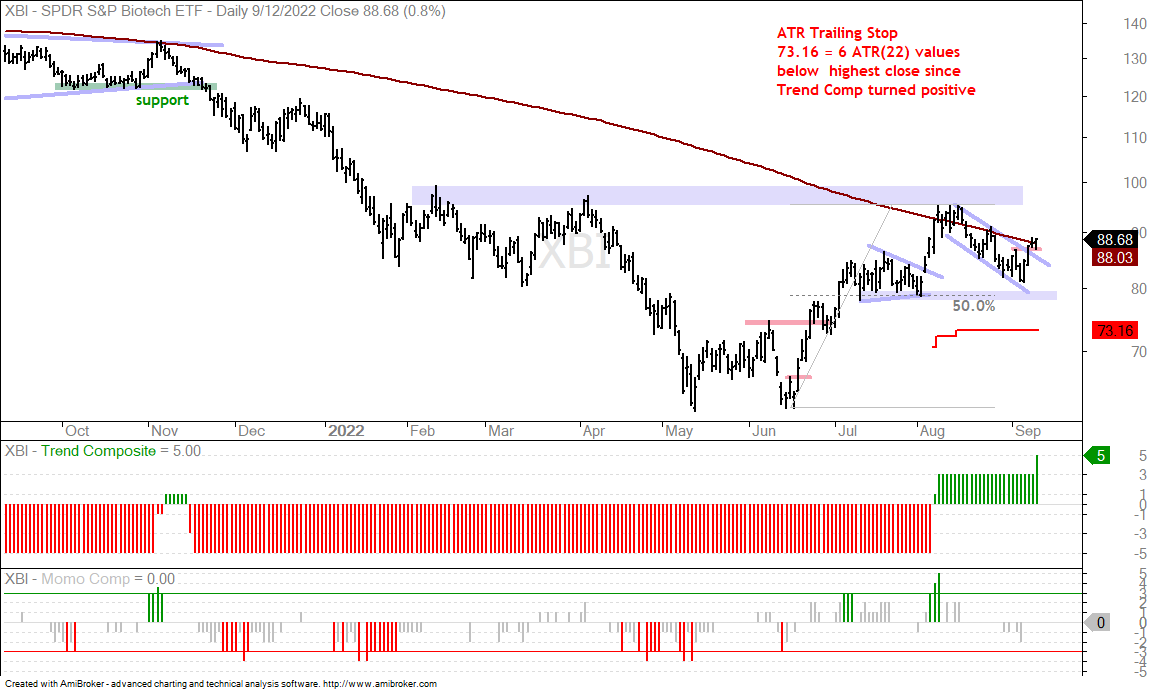
Biotech ETFs Reverse at Support-Reversal Zones (IBB, XBI)
The Biotech ETF (IBB) and the Biotech SPDR (XBI) followed the script pretty well with pullbacks that retraced around half of the prior advances, formed falling flags and found support near the July lows. IBB broke out with the strongest move and is challenging the 200-day SMA. Note that the Trend Composite is positive. REGN led IBB higher with a 24% surge the last four days. At this point, the flag breakout is short-term bullish and holding. A close below 120 would negate this breakout and argue for a reassessment of the short-term setup. Long-term, the Trend Composite is positive and the ATR Trailing Stop is at 115.64. The second chart shows XBI with similar characteristics.
You can learn more about my chart strategy in this article[4] covering the different timeframes, chart settings, StochClose, RSI and StochRSI.