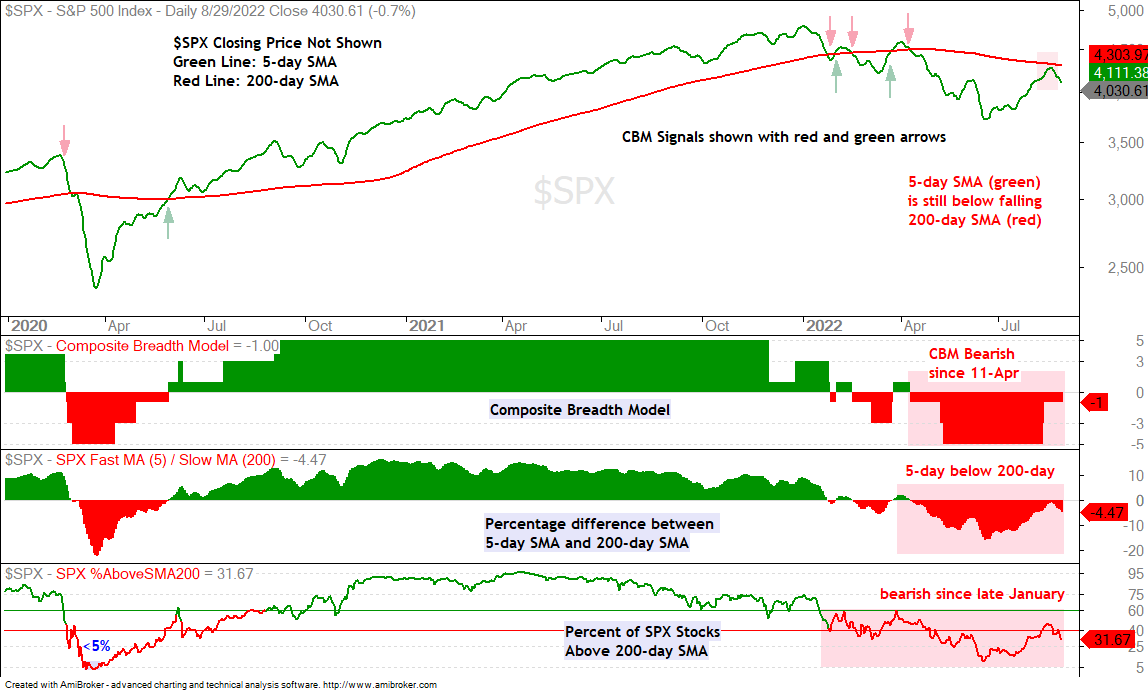
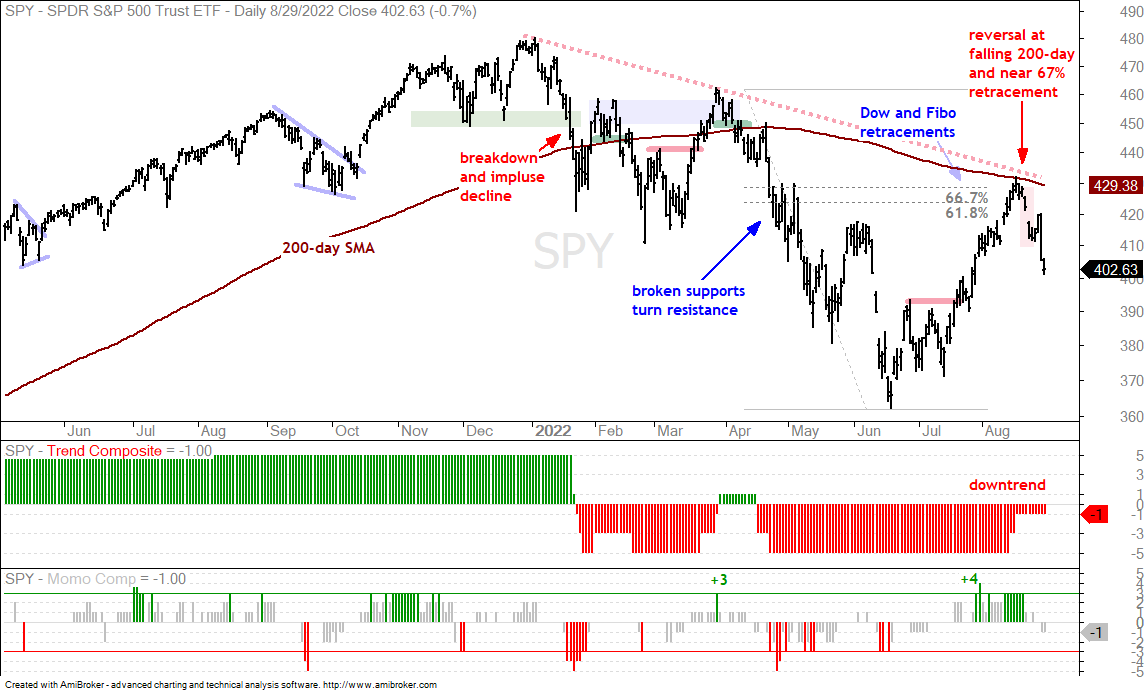
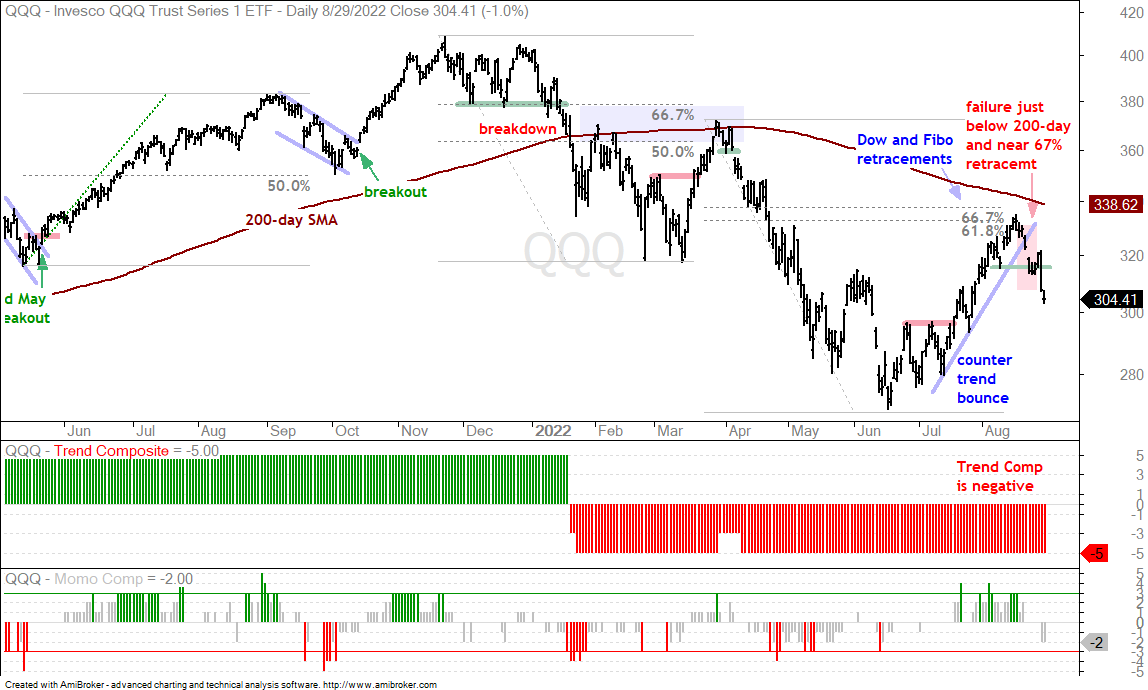
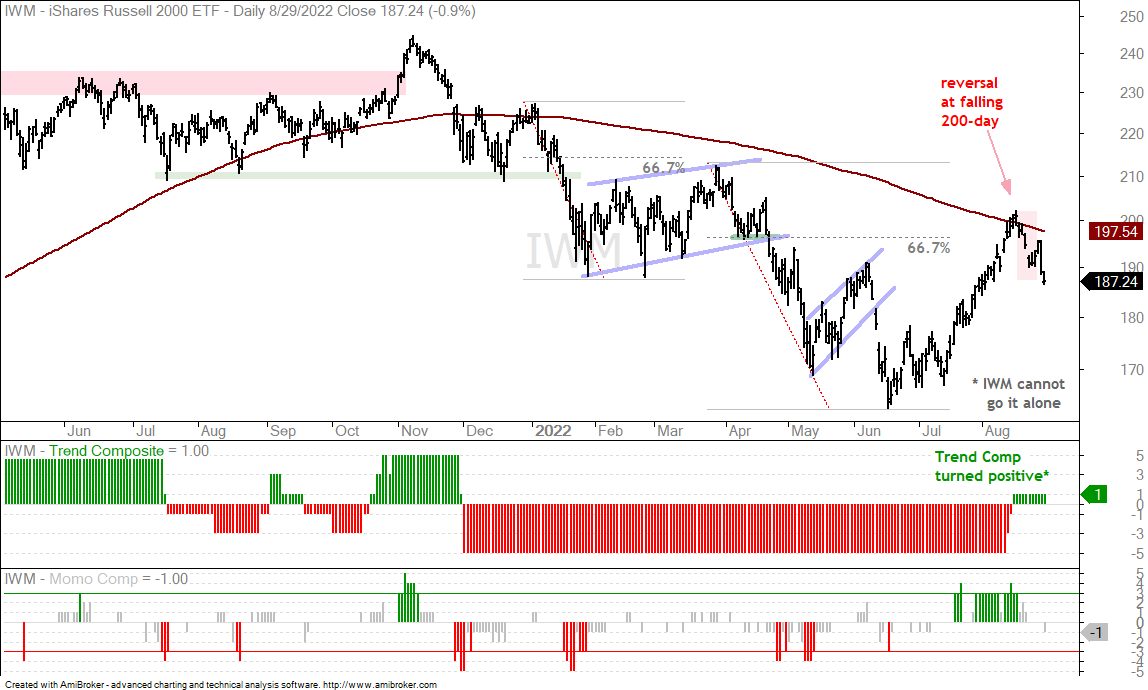
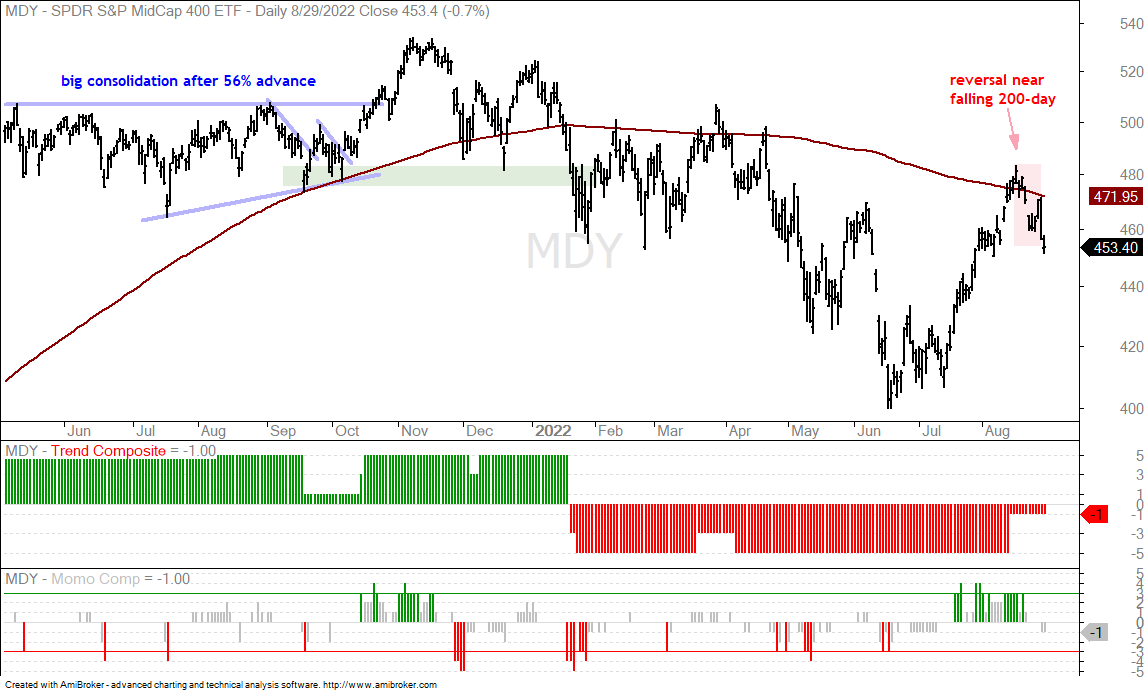
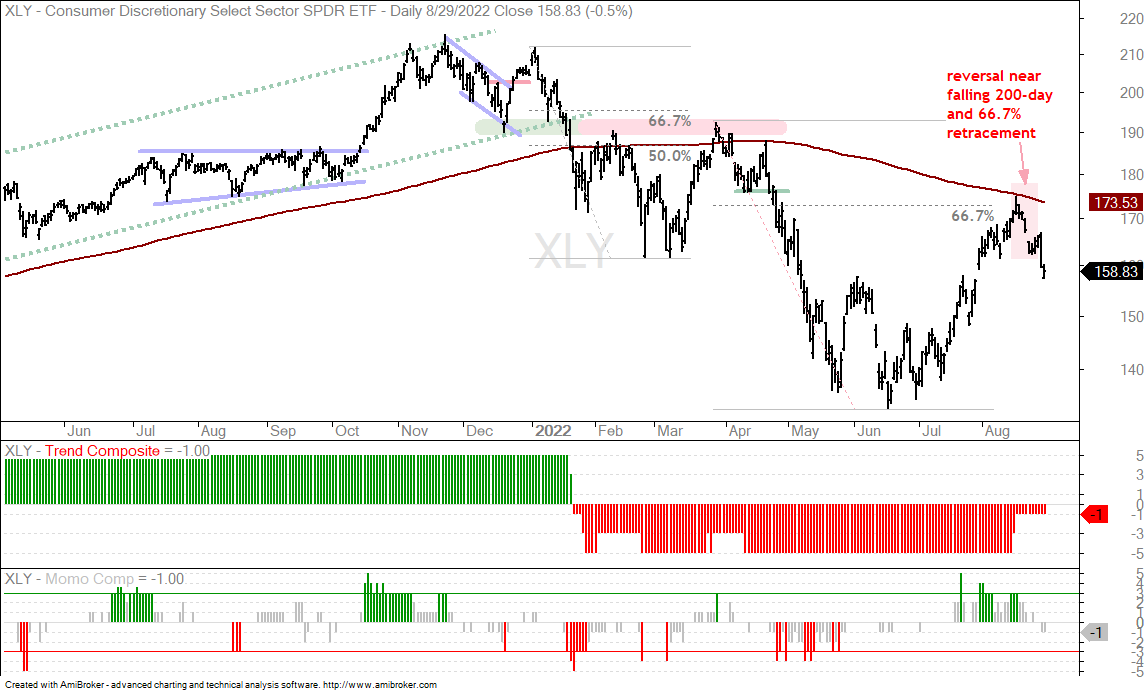
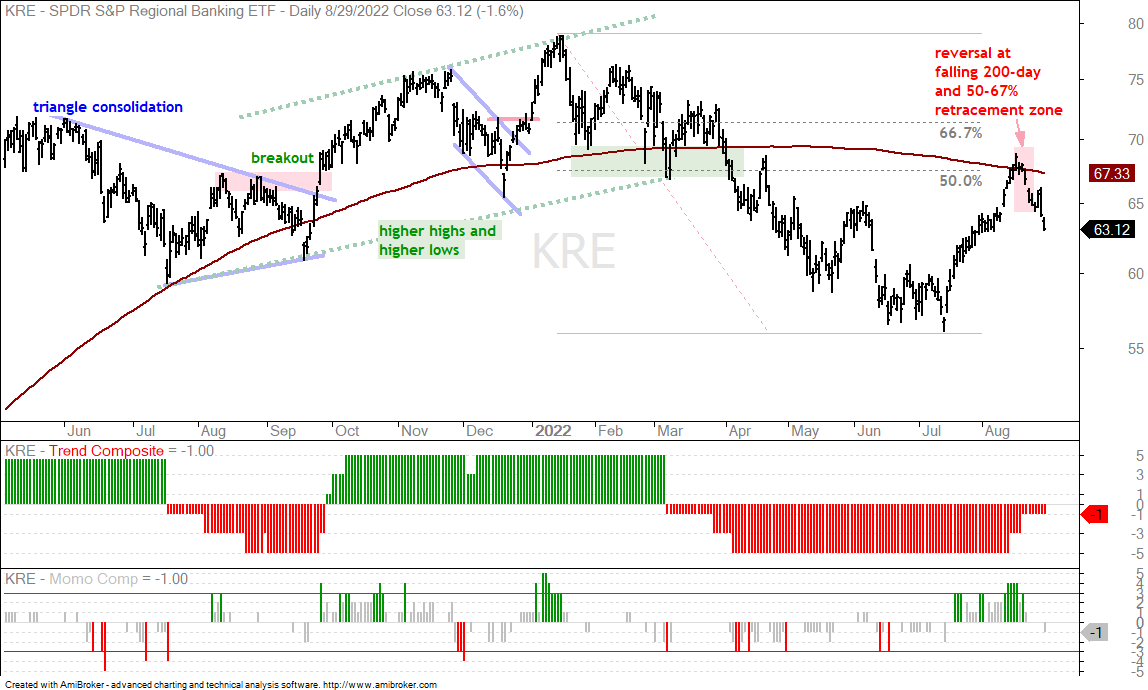
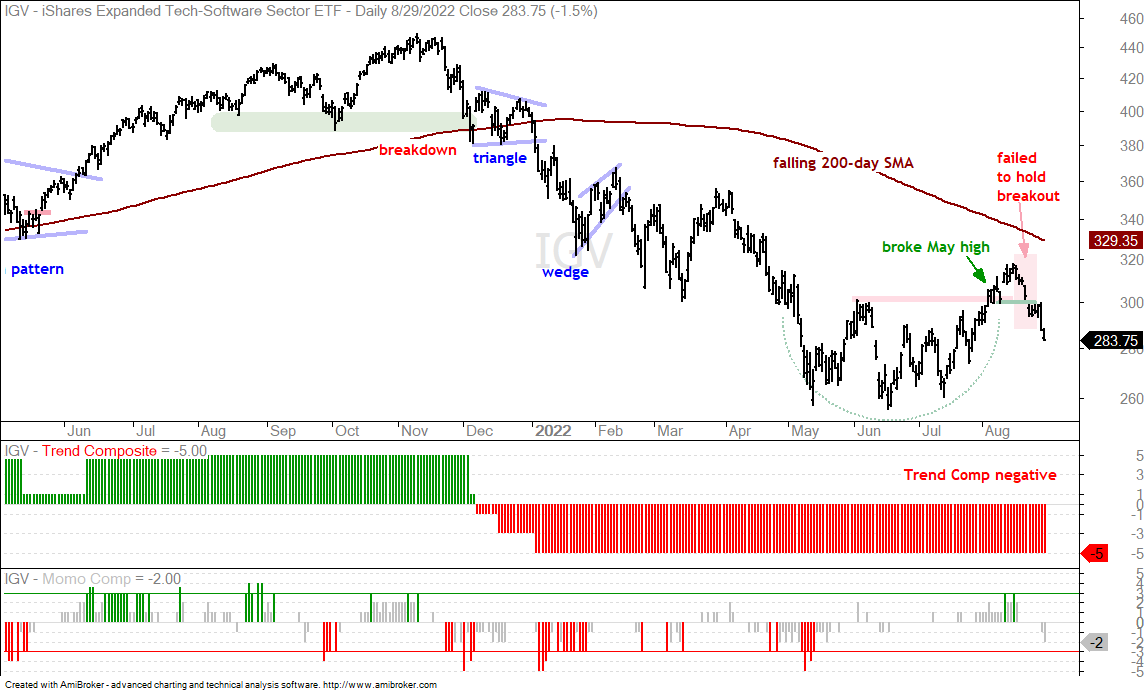
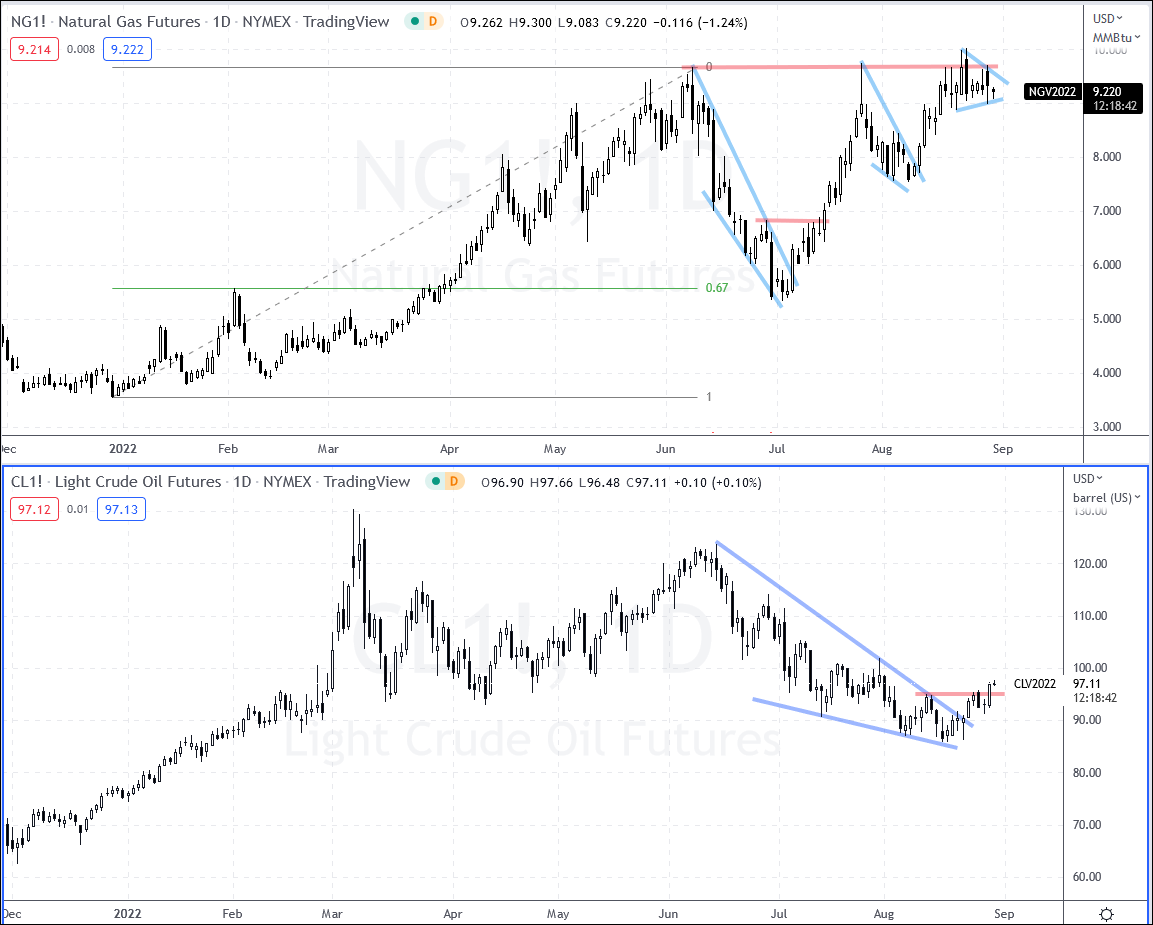
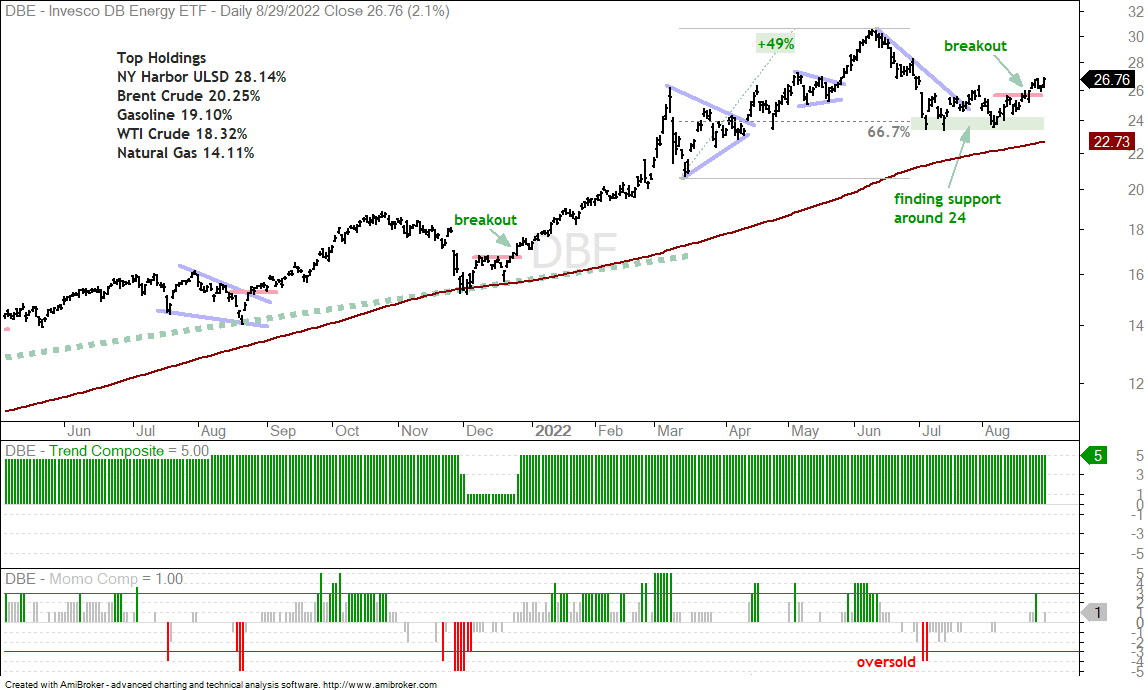
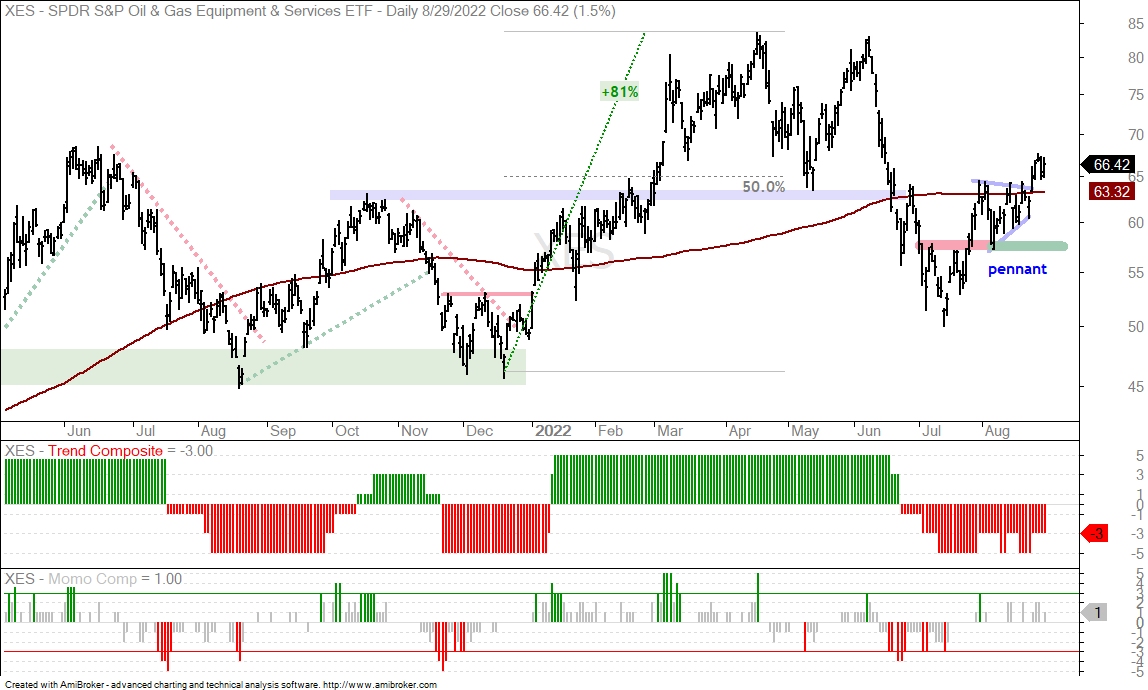
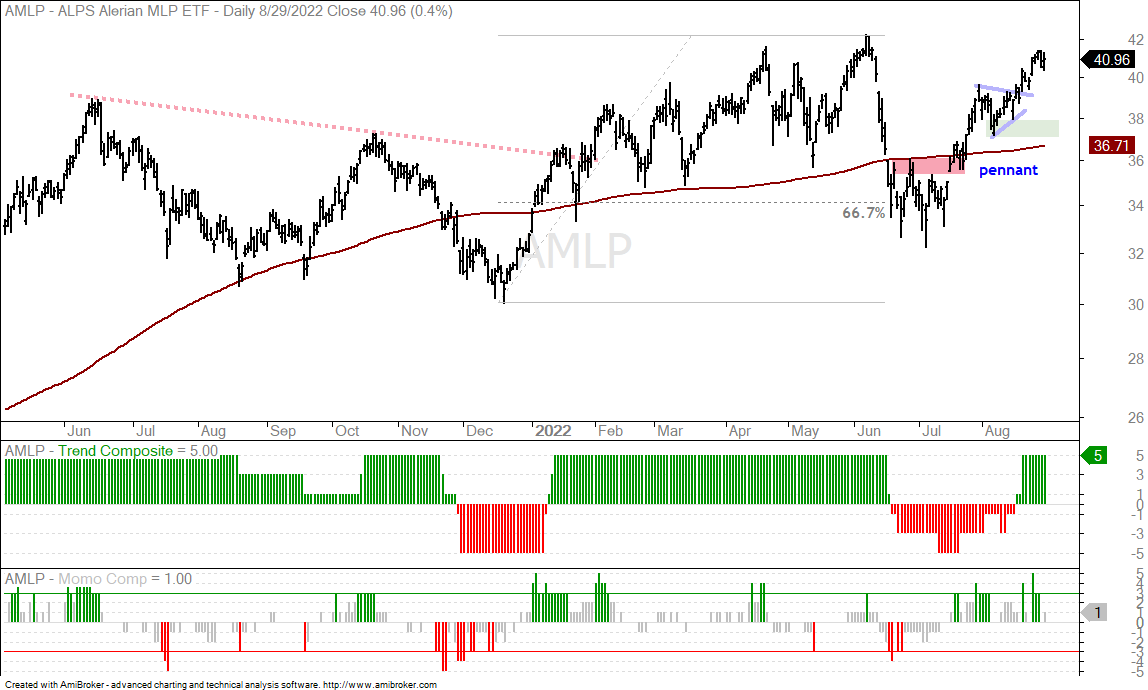
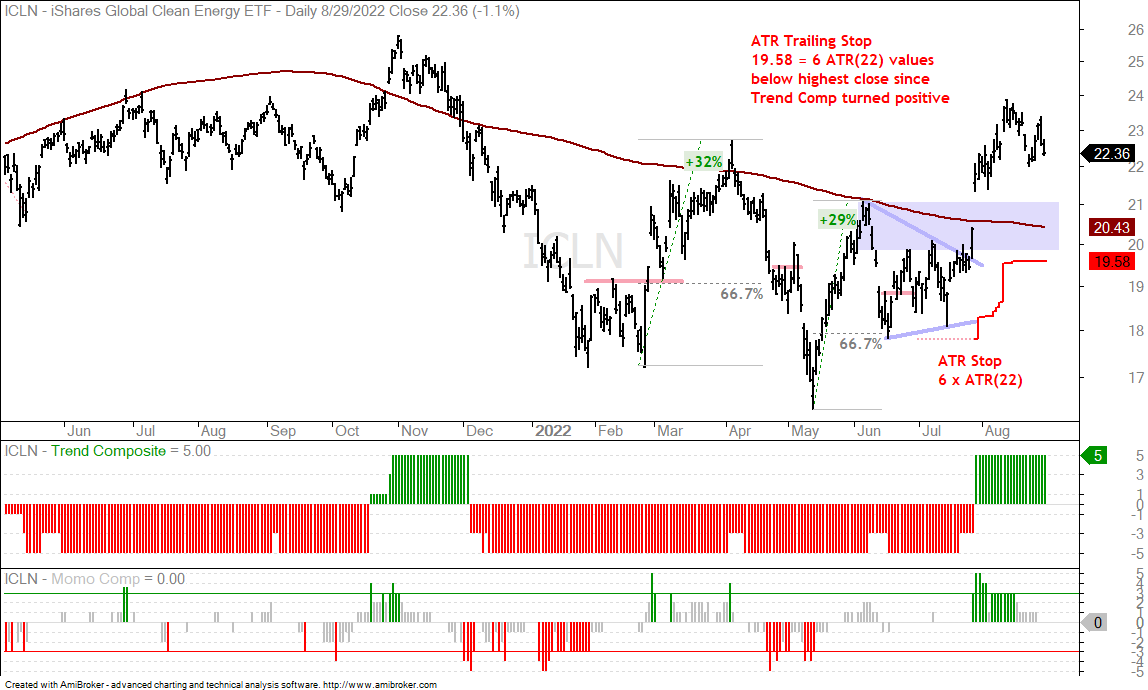
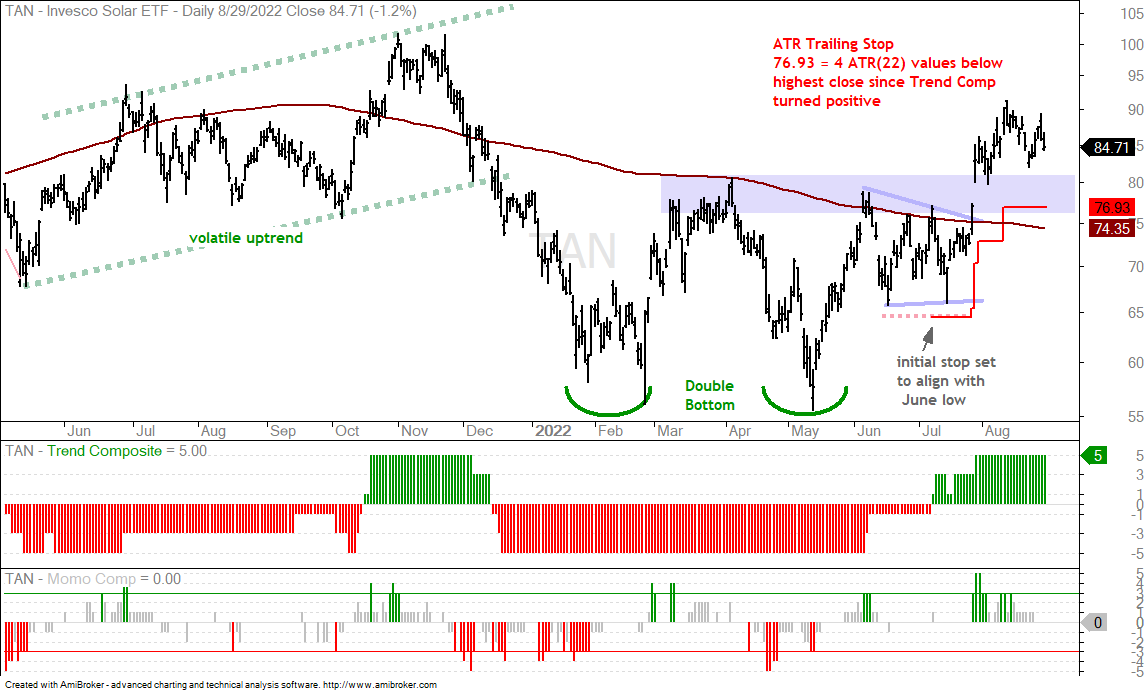
About the ETF Trends, Patterns and Setups Report
This report contains discretionary chart analysis based on my interpretation of the price charts. This is different from the fully systematic approach in the Trend Composite strategy series. In this ETF Trends, Patterns and Setups report, I am looking for leading uptrends and tradable setups within these uptrends. While I use indicators to help define the trend and identify oversold conditions within uptrends, the assessments are mostly based on price action and the price chart (higher highs, higher lows, patterns in play). Sometimes the chart assessment can be at odds with the indicators.
This Week's Commentary Schedule
- Tuesday – 30 August: Market-ETF Report and Signal-Rank Table Update
- Wednesday – 31 August Market-ETF Video and Market Regime Update
- Thursday – 1 September: Market-ETF Report and Signal-Rank Table Update
- Saturday – 3 September: ETF Signal and Rank Table
Composite Breadth Model Remains Bearish
The weight of the evidence remains bearish for stocks (bear market). The Composite Breadth Model [1] has been negative since April 11th and remains negative (-1). The 5-day SMA for SPX is around 4.5% below the 200-day SMA (middle indicator window) and the S&P 500 recently reversed just below its falling 200-day SMA (red shading on price chart). The bottom indicator window shows that fewer than 32% of S&P 500 stocks are above their 200-day SMAs, which means more than 68% are below (long-term downtrends).
While specific industry groups may buck the bear market, the majority of sector and industry group ETFs will be affected by the bear market. Moreover, correlations tend to rise during bear markets, especially when the short-term and long-term trends align (down). Risk remains above average for stocks and we are also entering a seasonally weak month (September). This argues for lower exposure to stock-based ETFs. Non-stock ETFs that are in uptrends or with bullish chart setups are preferred.
Short-term Breadth Breakdowns for SPY and QQQ
For short-term trend signals, we were monitoring the percentage of stocks above the 20-day SMA for the S&P 500 and Nasdaq 100. These two are short-term bullish when they become overbought remain overbought. A move above 80% is considered overbought and overbought conditions are present until there is a break below 60%. These indicators held up from mid July to mid August and broke down on August 22nd. The red arrows on the price charts and red shading on the middle indicator windows show these breakdowns. This means the short-term trend is down and this short-term downtrend aligns with the long-term downtrend.
Big Three Reverse Near Falling 200-day SMAs (SPY, QQQ, IWM)
The next three charts show the S&P 500 SPDR (SPY), Nasdaq 100 ETF (QQQ) and Russell 2000 ETF (IWM) surging to their 200-day SMAs and reversing their short-term uptrends with sharp declines the last two weeks. SPY barely touched its falling 200-day, QQQ fell short of its falling 200-day and IWM poked its head above its falling 200-day for a few days.
Three things to note. First, all three failed near their 200-day SMAs. Second, all three 200-day SMAs are falling, which implies a long-term downtrend. Third, small-caps cannot go it alone and trend signals from IWM do not mean much when the other two have yet to trigger and the Composite Breadth Model remains bearish. Small-caps account for less than 10% of the total US stock market, which means they represent the tail, not the dog. The S&P 500 is the big dog.
All three ETFs are short-term oversold after sharp declines the last nine trading days. SPY is down 6.2%, QQQ is down 8.4% and IWM is down 6.8%. Even though some of the classic oscillators, such as RSI(10), have yet to become oversold, the speed and depth of the decline is enough to be considered short-term oversold. Oversold conditions could give way to a short-term bounce or some firming. Also note that SPX and NDX %Above 20-day SMA is below 20% (charts above).
Several of tech-related ETFs broke above their May high and resistance zone, but did not come close to their falling 200-day SMAs and failed to hold these breakouts. They include SKYY (cloud computing), CIBR (cybersecurity), FDN (internet) and IGV (software). The chart below shows the Software ETF (IGV).
Oil Edges Higher as Natty Consolidates (NG1!, CL1!, DBE)
The next chart shows Natural Gas Futures (NG1!) in the top window and Light Crude Futures (CL1!) in the lower window. Natty surged to resistance in mid August and then consolidated with a pennant the last two weeks. This is viewed as a bullish continuation pattern and a breakout to new highs is expected. Note that natural gas was already a very volatile commodity and is even more volatile as we head into autumn and winter.
Oil formed a long falling wedge from June to August and is breaking out of this wedge pattern with an advance the last two weeks. I am pretty much ignoring price action between late February and May, and focusing on the immediate trend. The falling wedge defined the downtrend and the breakout signals the start of an uptrend. A close below 90 would argue for a re-evaluation.
The DB Energy ETF (DBE) has been on the watchlist because it was already in a leading uptrend and setting up after a pullback in June-July. This pullback retraced around 2/3 of the prior advance, which is normal for a correction within a bigger uptrend. DBE firmed in the 24 area for a few weeks and broke out last week. Also note that DBE is well above the rising 200-day SMA.
You can learn more about the ATR Trailing Stop and exit strategies in this post [2],
which includes a video and charting options for everyone.
Energy-Based ETFs Extend on Wedge and Pennant Breakouts
(XLE, XOP, FCG, XES, PSCE, AMLP)
The Energy SPDR (XLE), Oil & Gas Exploration & Production ETF (XOP) and Natural Gas ETF tested their rising 200-day SMAs in mid July and broke out of falling wedge patterns around July 20th. The falling wedge patterns represented corrections within uptrends and the breakouts signaled an end to these corrections – and a resumption of the bigger uptrends. The red lines mark the ATR Trailing Stops for reference. These are set 3 x ATR(22) values below the highest close since the wedge breakouts.
The Oil & Gas Equipment & Services ETF (XES), MLP ETF (AMLP) and Oil & Gas Equipment & Services ETF (XES) formed pennant consolidations in the first half of August and broke out of these patterns in mid August. Pennants are short-term consolidations that get their trading bias from the direction of the prior move, which was up in this case. AMLP is close to a new high, while XES and PSCE are above their rising 200-day SMAs.
Clean Energy ETFs Hold above Breakout Zones (ICLN, TAN)
The Solar Energy ETF (TAN) and the Global Clean Energy ETF (ICLN) broke out with big moves in late July and their Trend Composites turned positive in July. They are both holding above the breakout zones for now and these zones turn first support to watch going forward (blue shading). A decline into these zones could lead to a bullish setup (pullback within uptrend). Right the positive Trend Composites and late July breakouts are the active signals. The red lines mark the ATR Trailing Stops for reference. A close below these levels and/or a negative Trend Composite would call for a re-evaluation.
Biotech ETFs Hit Resistance Near 200-day SMAs (IBB, XBI, LIT)
While TAN and ICLN are well above their 200-day SMAs and have positive Trend Composites, the biotech ETFs look more like ETFs that are failing near their falling 200-day SMAs. The next chart shows the Biotech ETF (IBB) reversing near the falling 200-day and a resistance zone (blue shading). The ETF fell sharply with the rest of the market the last nine days and did not show any relative strength. The Trend Composite is still positive and IBB remains well above the ATR Trailing Stop. Nevertheless, further weakness in the broader market could negatively affect biotechs so be prepared.
You can learn more about my chart strategy in this article [3] covering the different timeframes, chart settings, StochClose, RSI and StochRSI.
Lithium Battery Tech ETF Battles 200-day (LIT)
The Lithium Battery Tech ETF (LIT) is also battling its 200-day SMA, but holding up better than biotechs over the last two weeks. A small wedge is forming as the ETF battles the 200-day. A wedge breakout would be short-term bullish. The red line shows the ATR Trailing Stop for reference (4 x ATR(22) values below the highest close since the Trend Composite turned positive).
The Trend Composite and ATR Trailing Stop are part of the
TIP Indicator Edge Plugin for StockCharts ACP [4]
Palladium ETF Holds Up (PALL)
The Palladium ETF (PALL) is holding its own with a bounce last week and uptrend over the last two months. This is a classic case of subjective analysis. The Trend Composite is still negative, but I viewed the March-June falling wedge as a big correction after a 100% advance. PALL broke out with a higher high in early July and continues to work its way higher. The ETF is even just above the 200-day SMA, which is slightly rising. The red line marks the ATR Trailing Stop at 177.31 for reference.
DB Ag ETF Gets Boost from Wheat and Coffee (DBA, WEAT, JO)
The DB Agriculture ETF (DBA) is also another one of these subjective calls. The Trend Composite is negative and DBA is just below its rising 200-day SMA so one could argue downtrend here. Price action was chaotic from late February to May and then we got the June swoon. Even so, DBA retraced around 2/3 of the prior advance (July to May) and established support in the 19.50 area (blue shading). DBA broke out in mid August with a higher high and hit a new high for the month on Monday. It looks like the June swoon was a correction and this correction is ending. The red line marks the ATR Trailing Stop at 19.68 and the green line marks support from the August lows. A close below 19.50 would argue for a re-evaluation.
The Wheat ETF (WEAT) also caught a bid over the last seven days and broke above the mid July closing high (red line). WEAT went through a war-related surge and a June swoon only to return to the rising channel that was in place before Putin invaded Ukraine. WEAT is below the 200-day SMA, but I think this rising channel still marks an uptrend. WEAT surged off the lower trendline to reinforce this channel and I view the short-term breakout as bullish. A close below the August low would argue for a re-evaluation. Note that WEAT has above average volatility and risk.
There is a lot going on for the Coffee ETF (JO) chart. First, the falling channel looks like a big correction that retraced 50-67 percent of the prior advance. The ETF broke out of this channel with a surge last week and exceeded the rising 200-day. The Trend Composite also turned positive last week. Thus, the channel breakout signals an end to the correction and the long-term trend is up.
Short-term, I was cueing off the small Ascending Triangle within the channel for an earlier signal. JO broke out on August 11th, fell back for a few days and then surged above 65. The ATR Trailing Stop (red line) was based on this Ascending Triangle breakout, which was a short-term setup. This stop is too tight for a trend-following stop and I would simply watch the mid August lows (green line) for signs of weakness. A close below 56 would argue for a re-evaluation.
Previous Report (Thursday, 25 August)
The following ETFs were covered on Thursday (here). [5]
- Dollar, Defensive and Clean Energy Lead
- Utilities, Dividends and Staples Holding Up (XLU, DVY, PBJ)
- Defense and Steel Holding Up Year-to-date (PPA, XME)
- Gold Hits Short-term Support-Reversal Zone (GLD)
- Inflation-Indexed Bond ETF Hits Short-term Reversal Zone (TIP)
- Uranium ETF with an Out-Sized Surge (URA)
You can learn more about my chart strategy in this article [3] covering the different timeframes, chart settings, StochClose, RSI and StochRSI.