About the ETF Trends, Patterns and Setups Report
This report contains discretionary chart analysis based on my interpretation of the price charts. This is different from the fully systematic approach in the Trend Composite strategy series. In this ETF Trends, Patterns and Setups report, I am looking for leading uptrends and tradable setups within these uptrends. While I use indicators to help define the trend and identify oversold conditions within uptrends, the assessments are mostly based on price action and the price chart (higher highs, higher lows, patterns in play). Sometimes the chart assessment can be at odds with the indicators.
Report Schedule
- Tuesday – 31 Jan: Market/ETF Report and ETF Trend/Rank Table
- Wednesday – 1 Feb: Market/ETF Video and ETF Trend/Rank Table Update
- Thursday – 2 Feb: Mean-Reversion Setup Table and Signal Tracker
The Mean-Reversion [1] and Trend-Rank [2] tables are updated every day
Mean-Reversion Articles and Table
I will publish part 5 of the mean-reversion strategy on Thursday. There were no new setups today. Part 5 will show the last 50 trades to better understand how signals cluster and the gap between setups/signals.
Market Regime is Bearish for Stocks
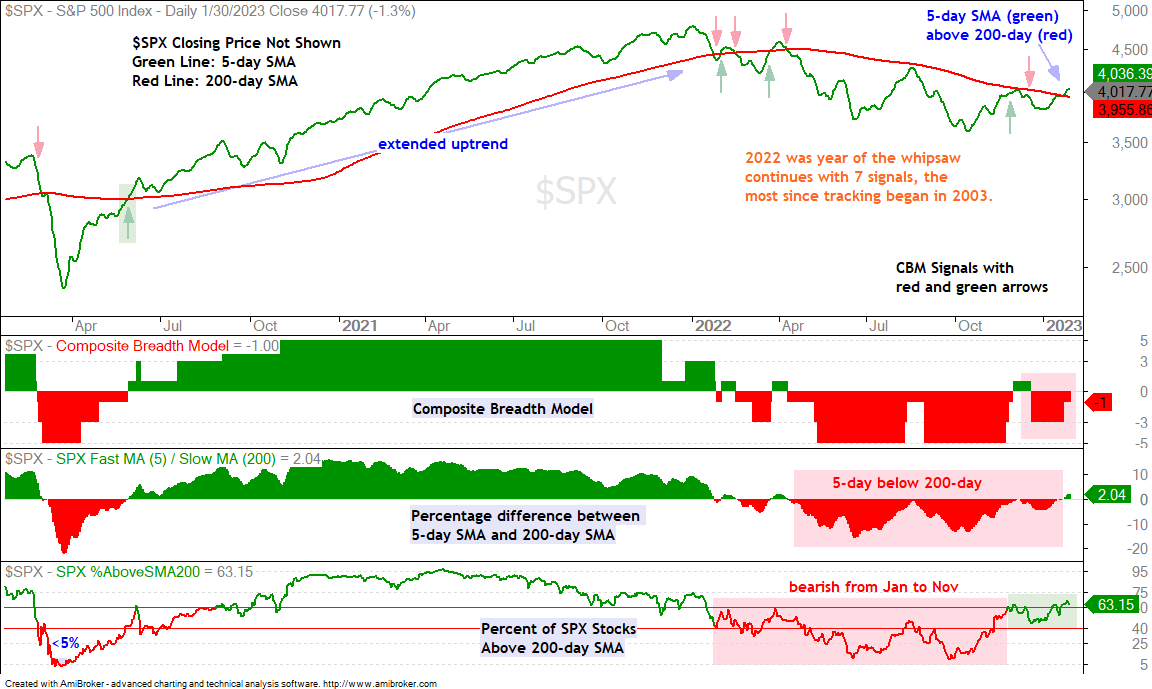
The Composite Breadth Model remains at -1 and this means the weight of the evidence is still bearish. It came within inches of turning positive on Friday, but the push fell short and the model remains bearish. Note that the S&P 500 5-day SMA is above the 200-day SMA and some 63% of S&P 500 stocks are above their 200-day SMAs. There are some sizable pockets of strength within the market, but we are not in a bull market. This means the advance into January is a bear market rally.
SPY Surges towards Resistance
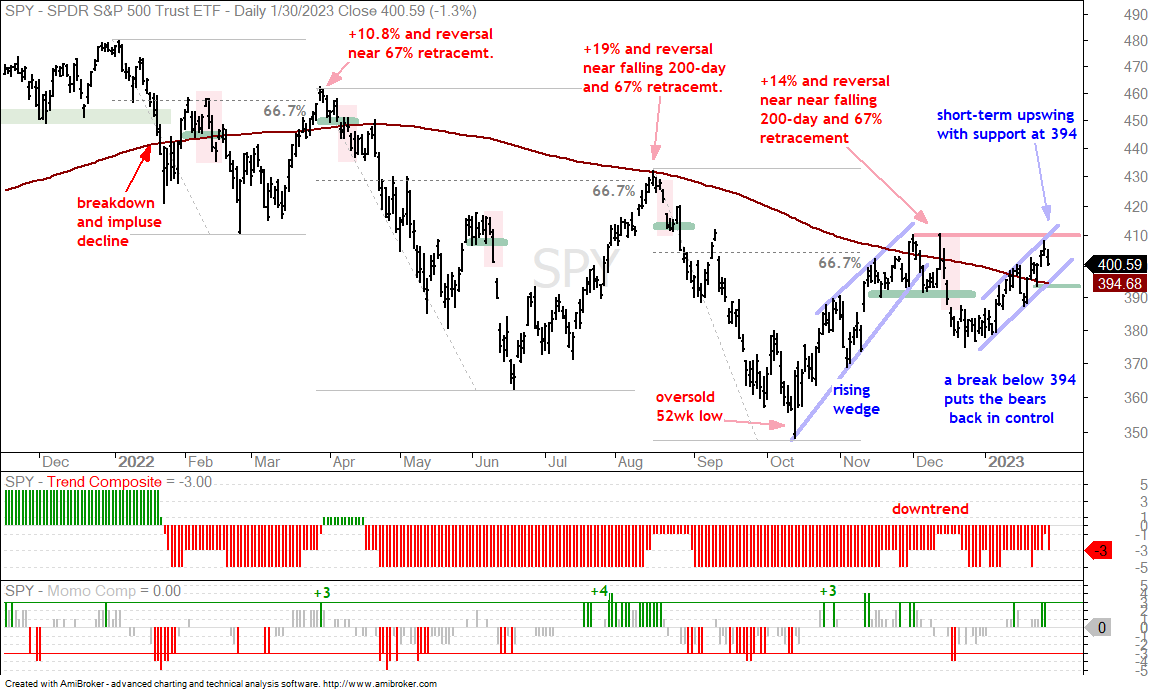
As noted the last three Tuesdays, the S&P 500 SPDR (SPY) is at a moment of truth. Either it fails in the 400-410 area and continues its downtrend or it breaks through 410 and the Composite Breadth Model turns positive. Some indicators in the CBM are very close to turning bullish and a push above 410 would likely turn them bullish.
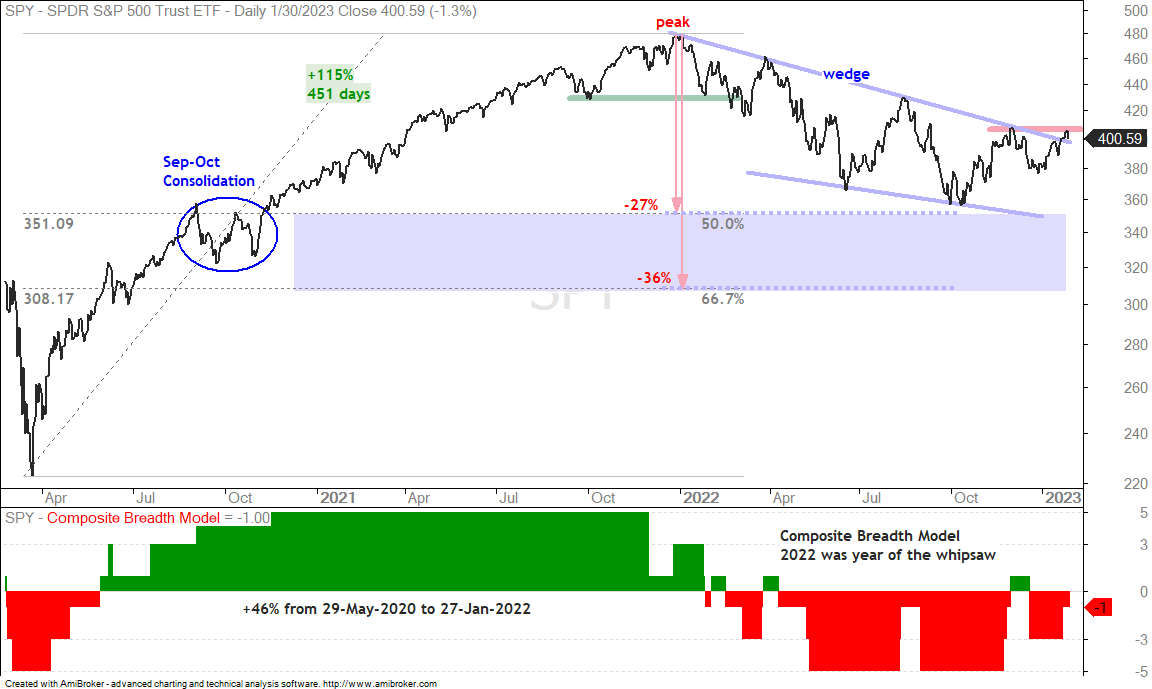
The chart below shows a massive advance into January 2022 (+115%) and an extended decline the rest of the year. The long-term trend is down with a big falling wedge taking shape. A falling wedge that retraces one to two thirds of the prior advance is deemed a correction on any timeframe.
Notice that the wedge above retraced around half of the prior advance. The falling wedge is typical for a corrective pattern and 50% is the base case for a retracement. A close above 410 would break wedge resistance and reverse the long-term downtrend. It ain’t a breakout until it’s a breakout.
A Short-term Upswing for SPY
Short-term, SPY appeared to break down in mid December with the plunge below 390. Instead of continuing lower after the late December consolidation, the ETF surged back above the 200-day SMA and challenged the November-December highs (410). The blue channel defines the short-term upswing with support marked at 394. A break below this level would reverse the short-term upswing. This would be quite negative because it means the short-term downtrend is aligned with the long-term downtrend. In other words, the short-term downtrend would have the wind at its back.
Divergences in Short-term Breadth Indicators
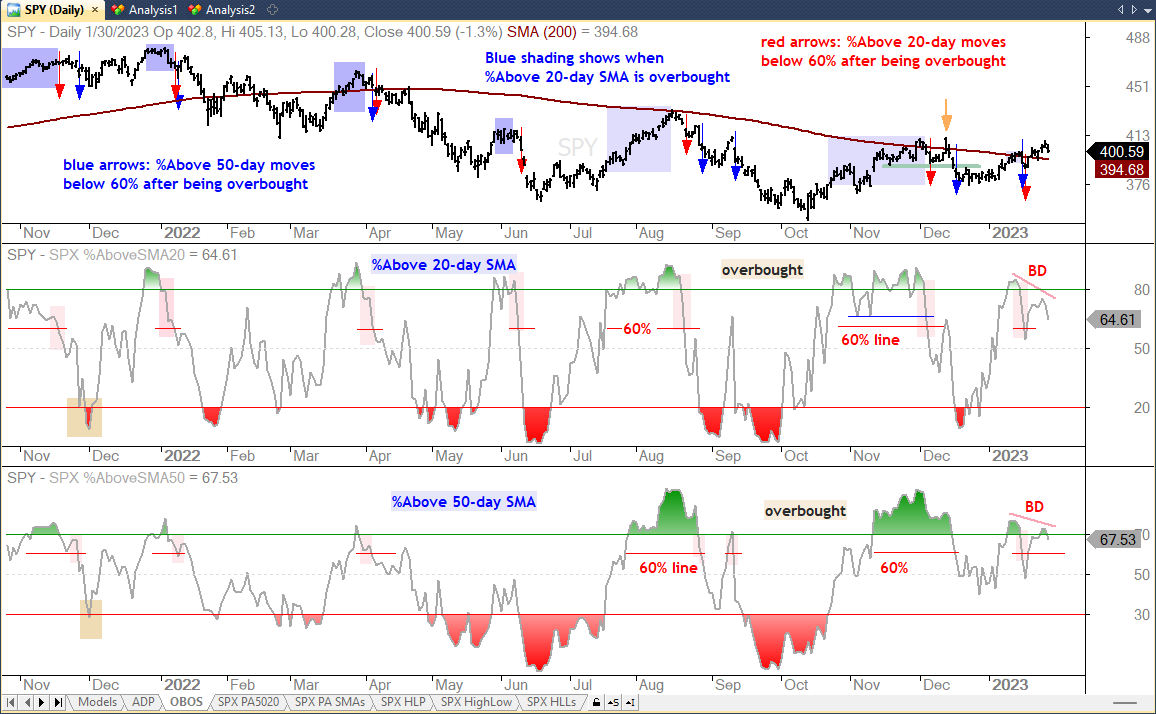
The next chart shows SPY with SPX %Above 20-day SMA and SPX %Above 50-day SMA. The middle window shows SPX %Above 20-day SMA becoming overbought in early-mid January and breaking below 60% for a bearish signal on January 19th (red arrow on price chart). SPY moved above its mid December high, but the indicator did not make it back above 80% and a bearish divergence formed with a lower high (BD on chart). Basically, SPY forged a higher high and fewer stocks got back above their 20-day SMA over the past week. This shows waning upside participation.
The bottom window shows SPX %Above 50-day SMA becoming overbought and breaking below 60% on January 18th (blue arrow on price chart). %Above 50-day SMA moved back above 70%, but did not exceed its mid January high and also formed a bearish divergence (BD).
My main focus is on SPY and the Composite Breadth Model. The CBM remains net negative and this means we are not in a bull market. SPY is still in a long-term downtrend and appears to be weakening short-term because fewer stocks got back above their 20 and 50 day SMAs. This weakening could foreshadow a short-term trend reversal and a breakdown at this stage would be quite negative for stocks.
QQQ with Unconfirmed Double Bottom
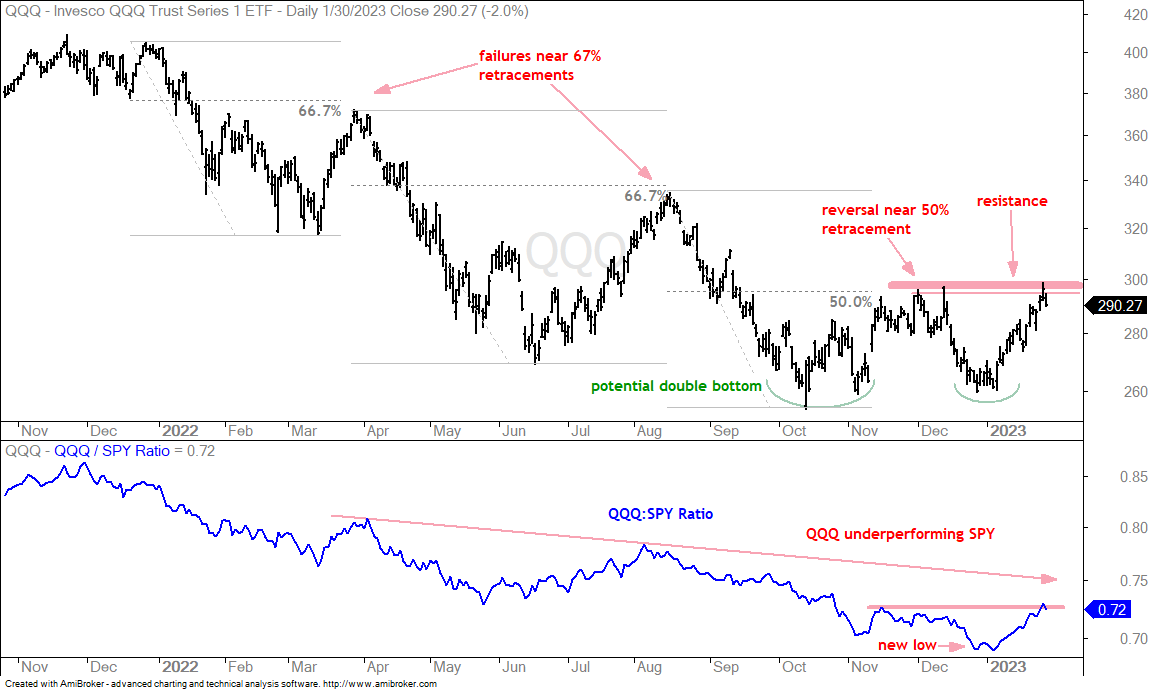
QQQ formed a potential double bottom and broke above the intermittent high on Friday. But fell back on Monday. The green arcs show the double bottom lows in the 260 area. The thin red line marks the highest close between these two lows. QQQ closed above this line on Friday and then fell 2% on Monday. I prefer to use zones for support and resistance, especially for ETFs with dozens of moving parts (stocks). There is a resistance zone in the 295-300 area and QQQ needs to break 300 to confirm this double bottom. The trend is down as long as this double bottom is unconfirmed.
XLK with Short-term Upswing in long-term Downtrend
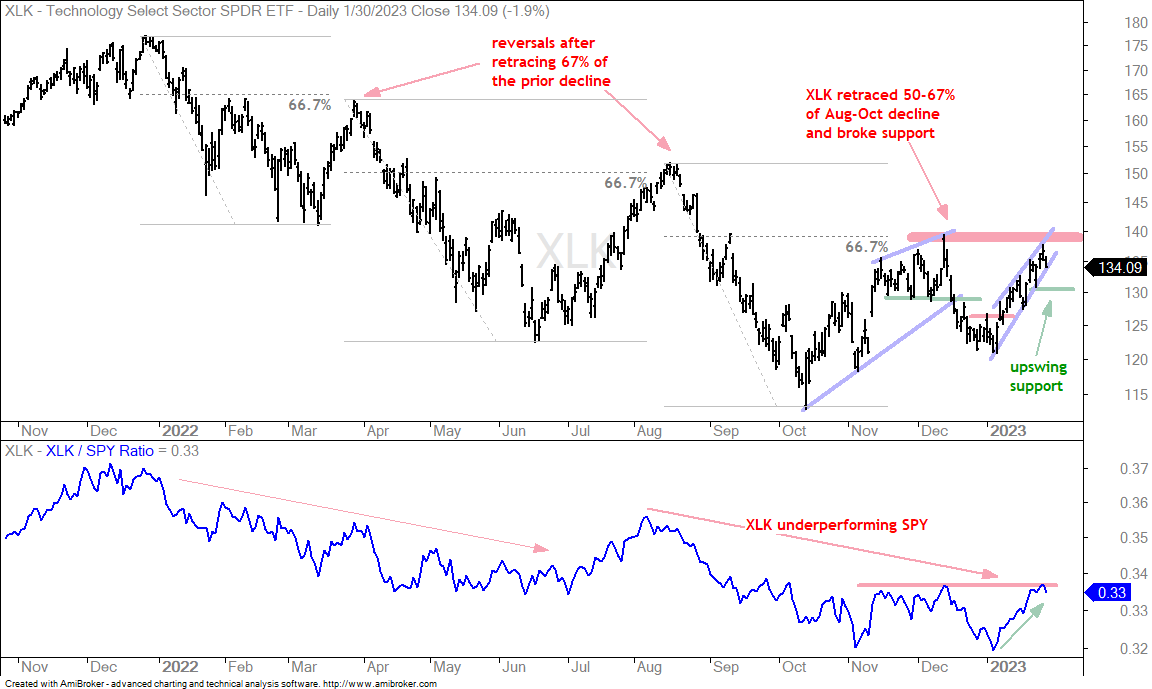
The next chart shows the Technology SPDR (XLK) with a breakdown in mid December, a consolidation into late December and then a surge in January. Admittedly, I thought the mid December breakdown would lead to new lows. The January surge is certainly impressive, but XLK remains short of trend-reversing breakout. The long-term trend is still down and I am watching the short-term upswing. A break below 130 would reverse this upswing and the short-term trend would then align with the long-term trend (both down). Tech is still the biggest sector in the S&P 500 and this would weigh on the broader market.
Semis Lead, but Cyber Lags and Software Stalls
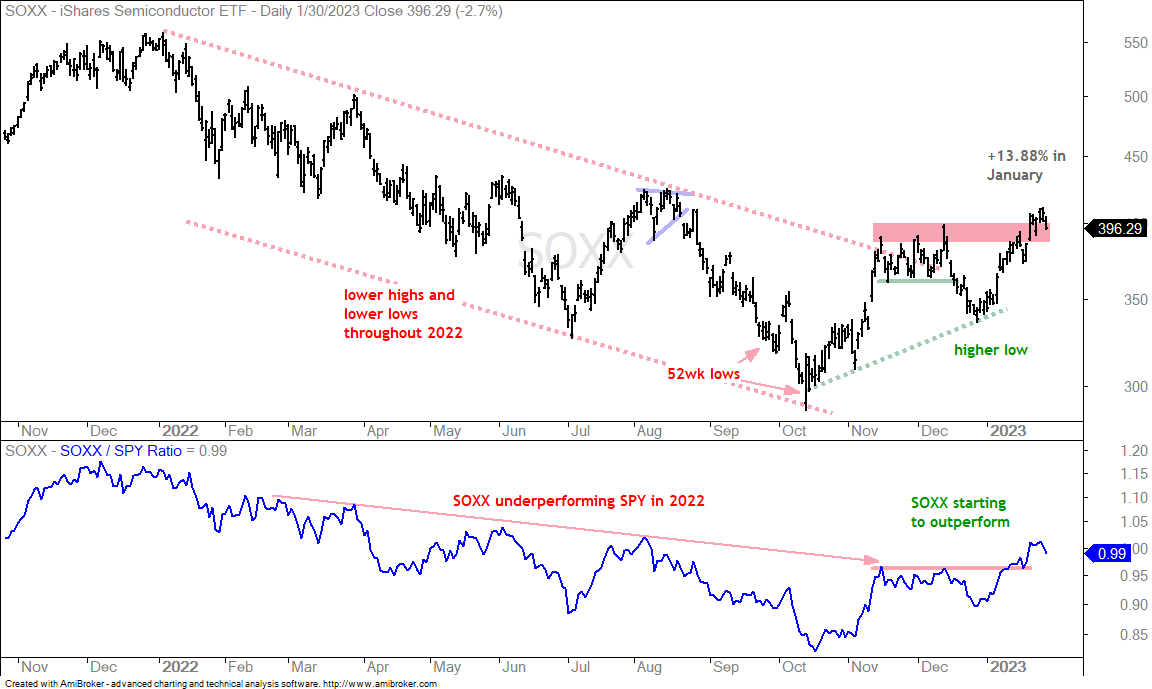
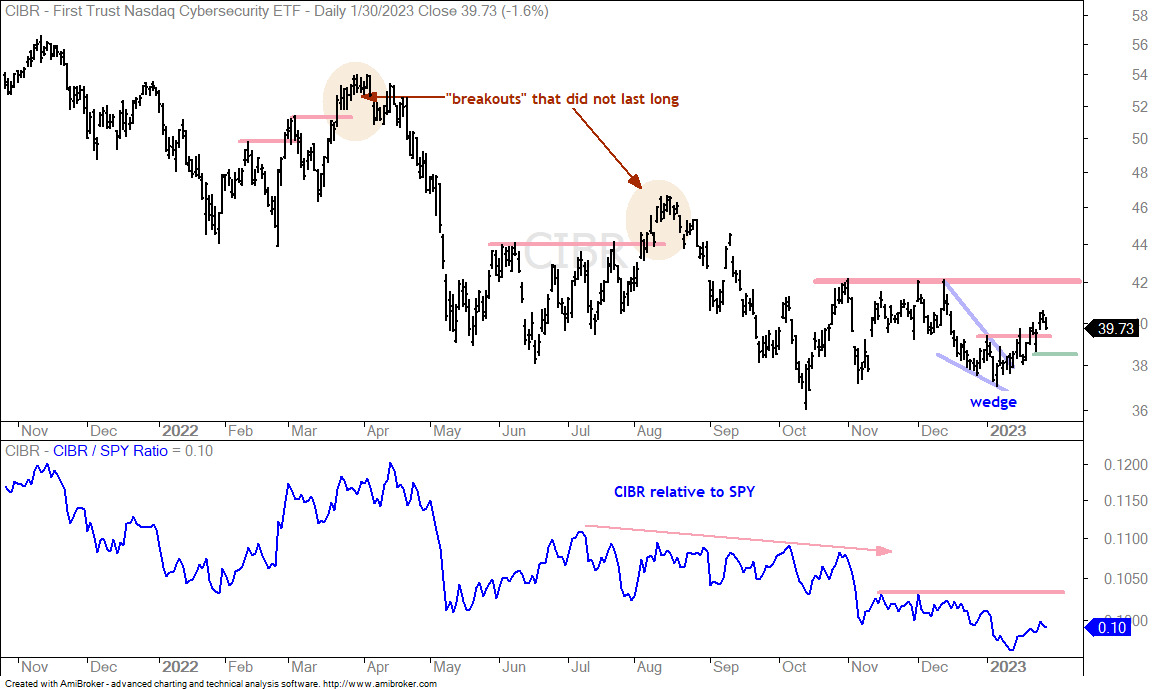
The Semiconductor ETF (SOXX) is the strongest of the tech-based ETFs because it broke above its November-December resistance zone. The price-relative (bottom window) also broke above these highs and SOXX is leading SPY. Despite relative strength, SOXX is short-term overbought after a 13.88% advance in January. This makes the ETF vulnerable to a consolidation or pullback.
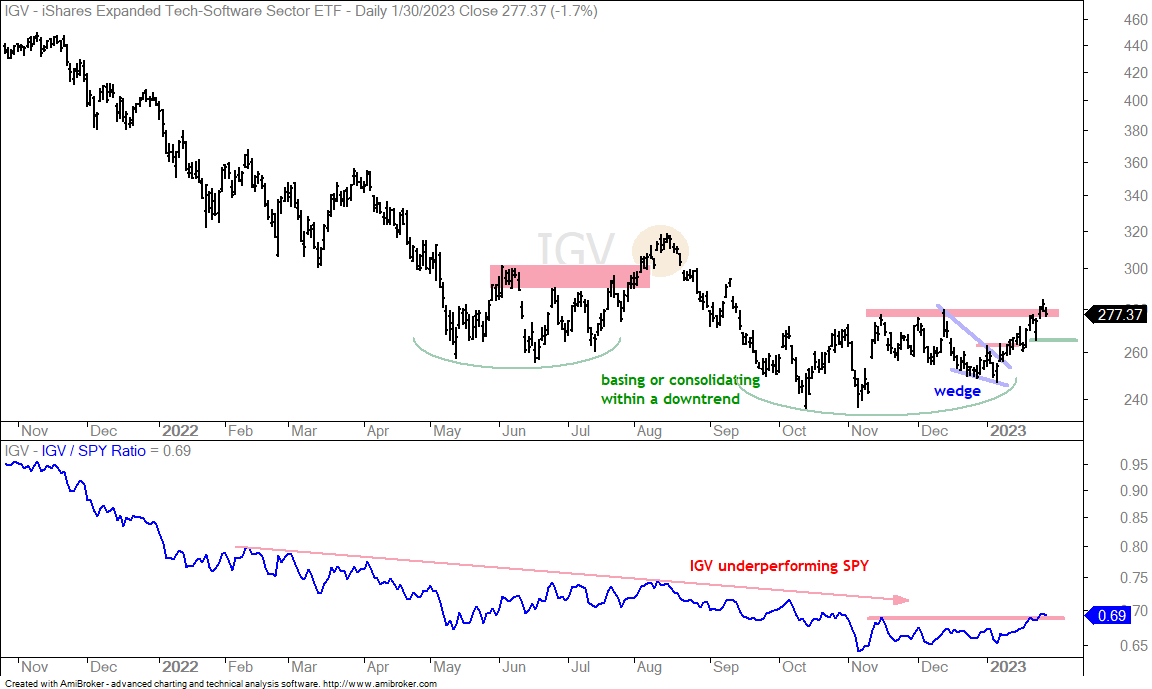
The Software ETF (IGV) is challenging a resistance zone from the November-December highs. As with QQQ, IGV poked its head above resistance on Friday and then fell back on Monday. Overall, the long-term trend is still down on this chart. The wedge breakout on January 12th is short-term bullish and IGV is currently in a gray zone as it battles the resistance zone. Last week’s low marks upswing support at 265 and a break here would be short-term bearish.
Oil Fails at Resistance
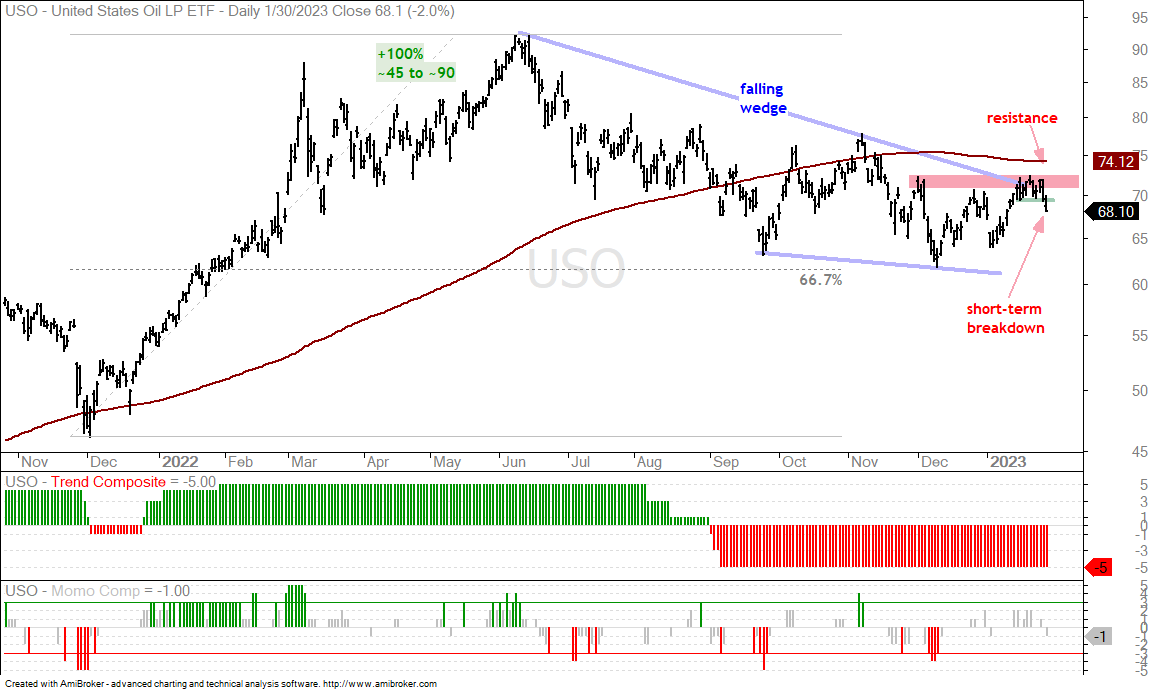
As with SPY, the US Oil Fund (USO) also has a large falling wedge working and remains short of a trend reversing breakout. In fact, USO failed at resistance and broke short-term support with a sharp decline the last two days. This means the short-term trend is now aligned with the long-term trend (both down). In a separate, but related, development, US natural gas is below $3 and trading at a 52-week low. European natural gas is also at or below its 2022 lows.
Energy ETFs Hold Breakouts For Now
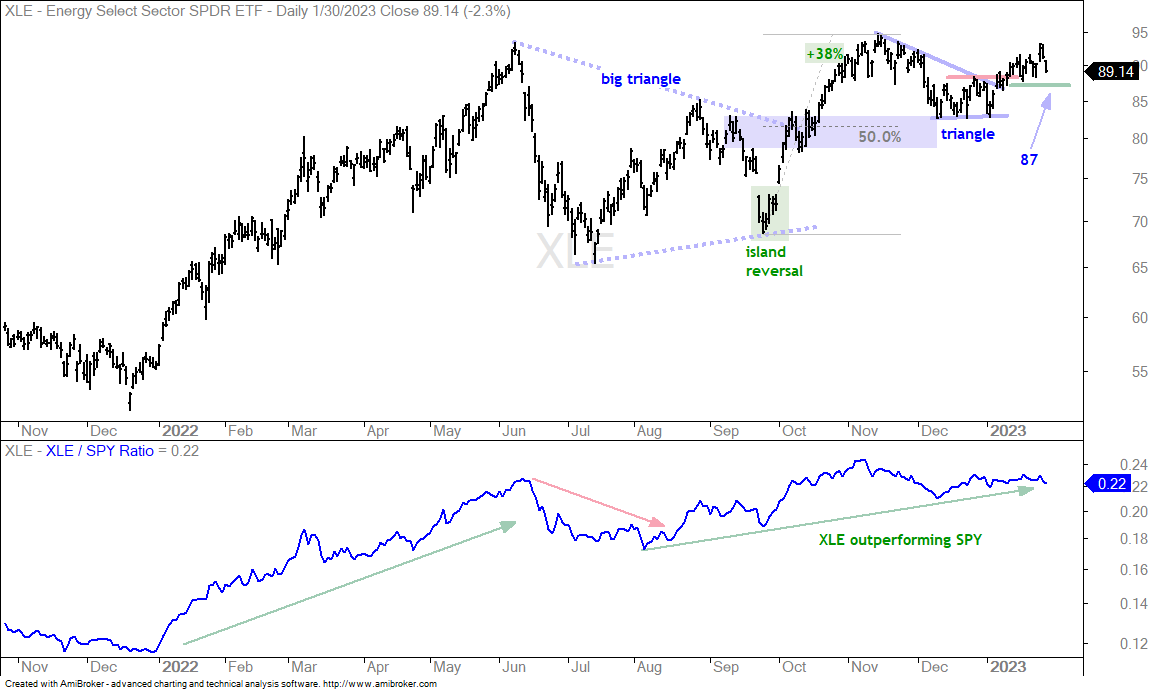
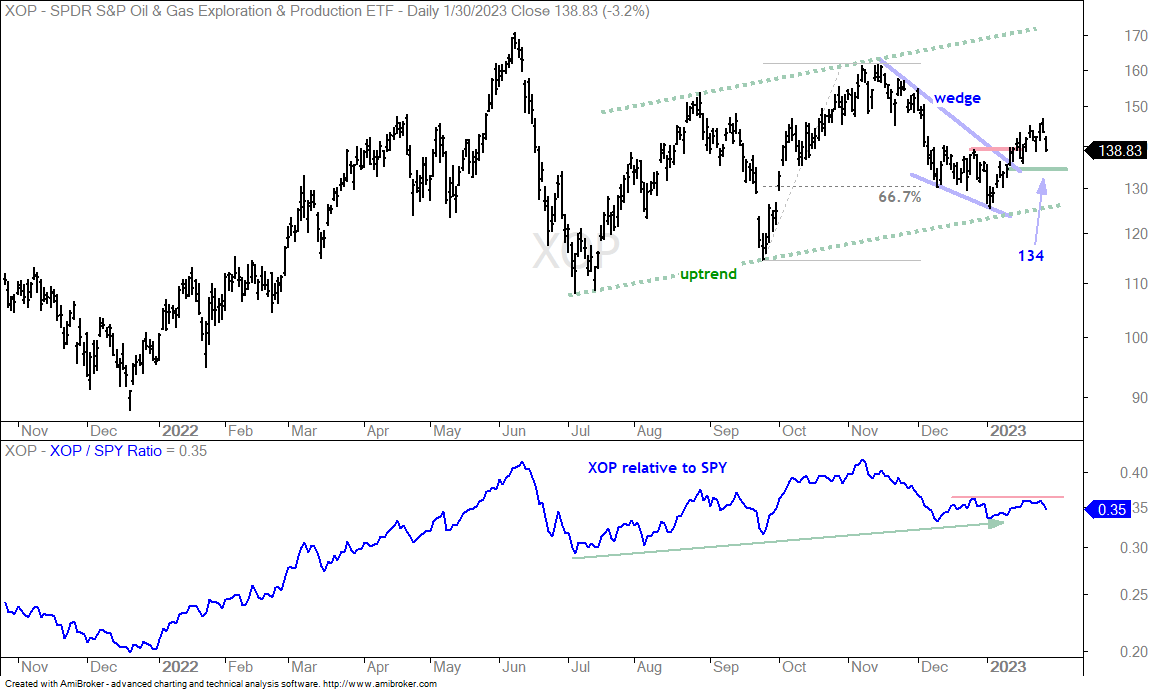
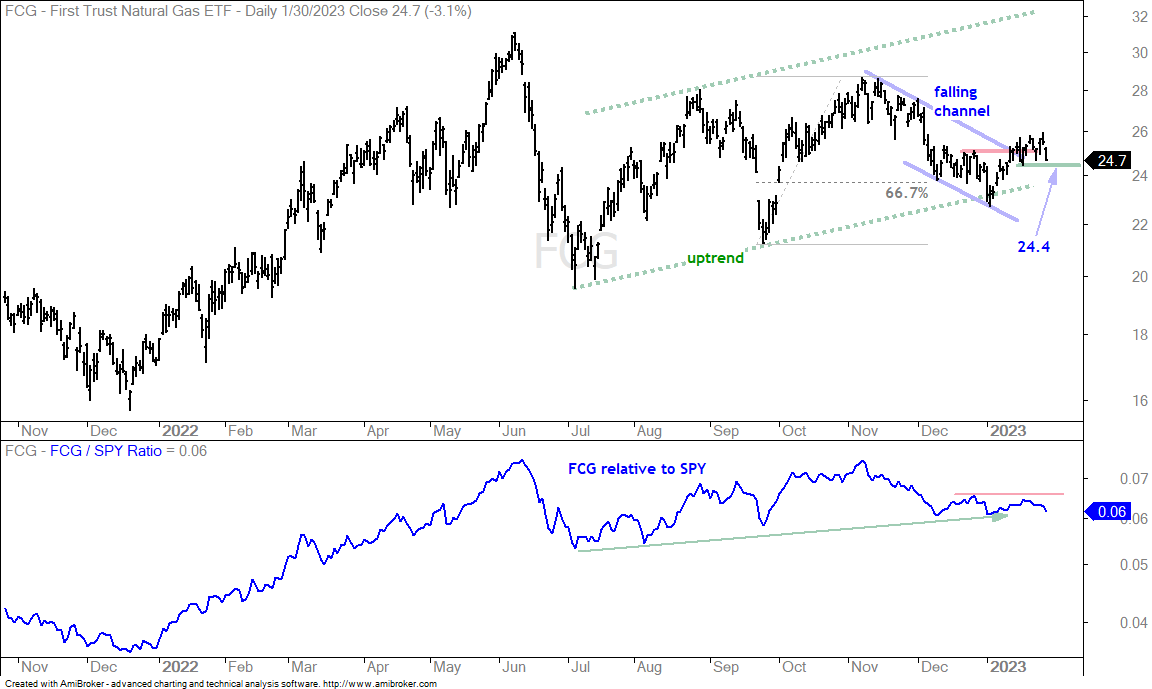
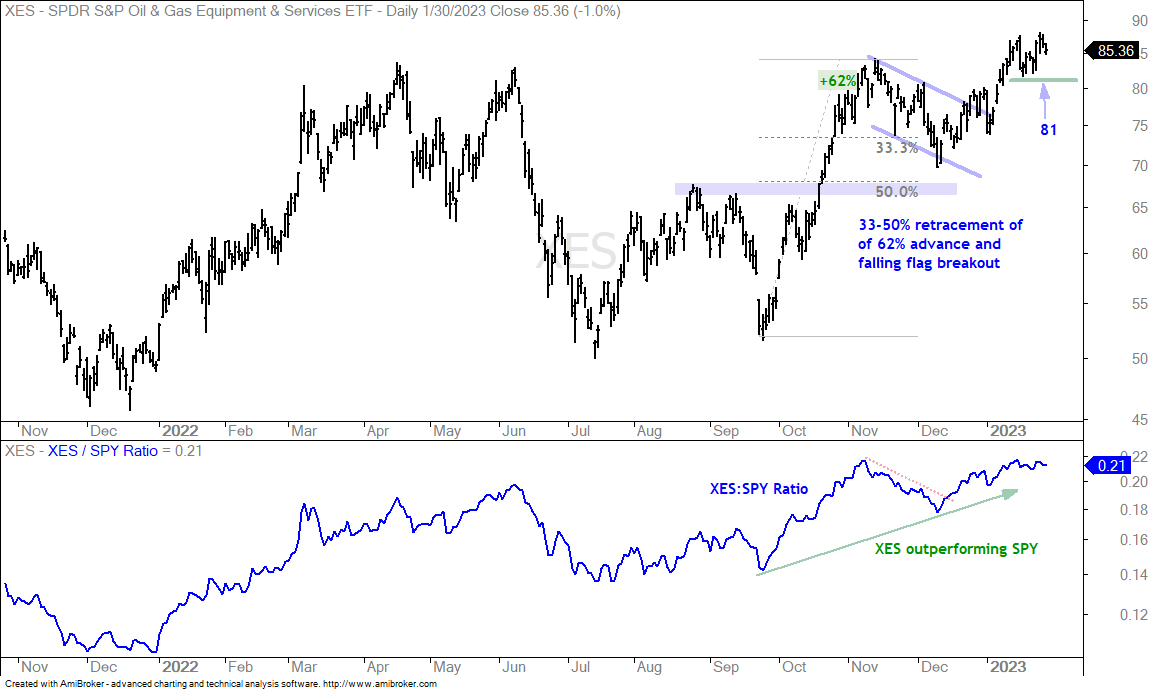
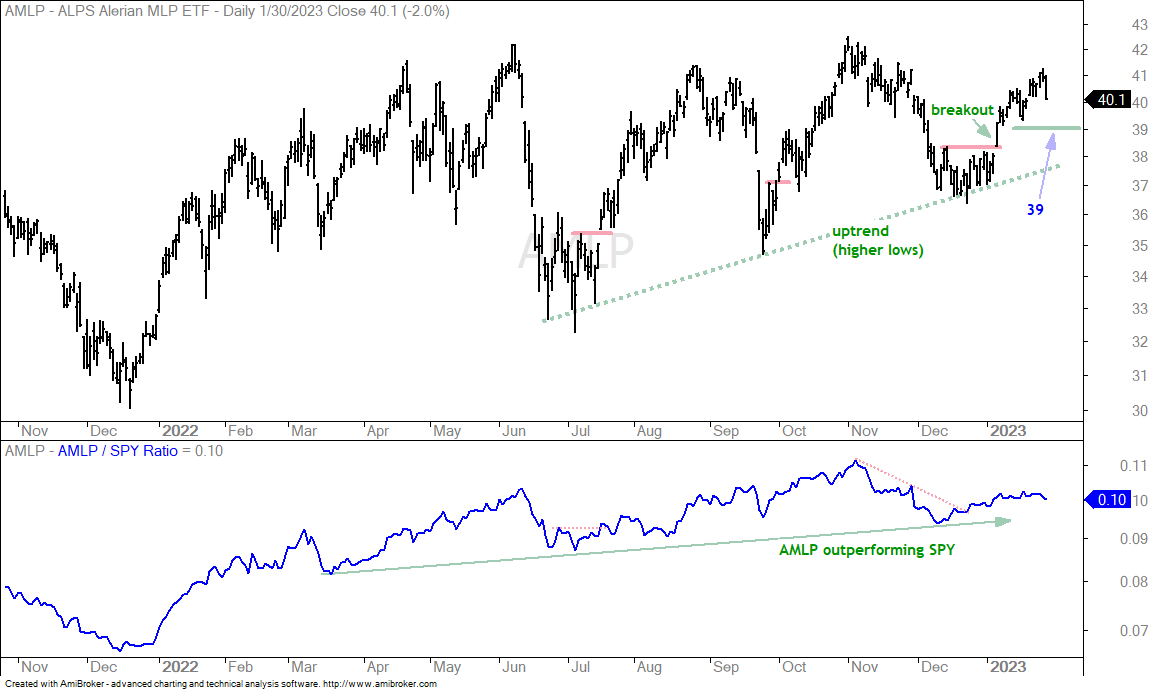
The energy-related ETFs have breakouts working, but the prospect of a weakening stock market and the reality of falling energy prices could weigh. The first chart shows the Energy SPDR (XLE) with a triangle breakout that is holding so far. A strong breakout will hold and a weak breakout will fold. The green line at 87 marks the line in the sand for this breakout. A close below this level would negate the breakout and could lead to further weakness.
Low Volatility and Defensive ETFs Lagging, but Setting Up
A tradable setup takes shape where there is a pullback or consolidation within an uptrend or after a sharp advance. Typically, a falling wedge, falling channel or triangle will form. Pullbacks and consolidations alleviate overbought conditions and pave the way for the next move higher. Some pullbacks extend further than expected and result in bigger trend reversals. Some pullbacks reverse after retracing around half of the prior advance.
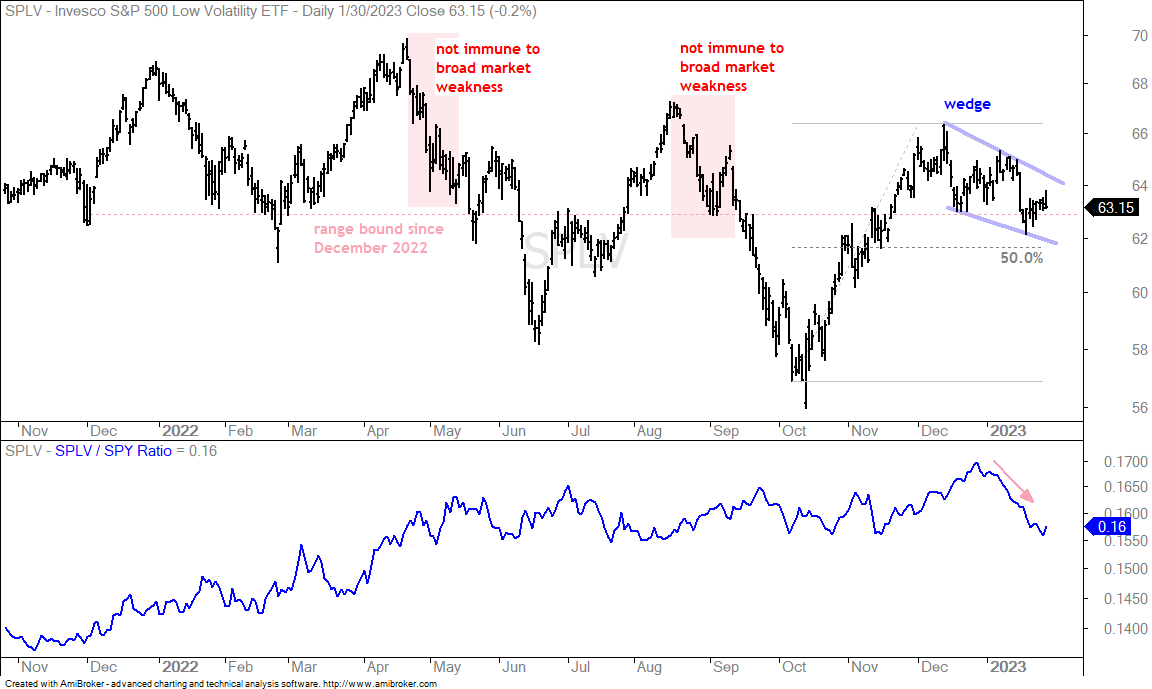
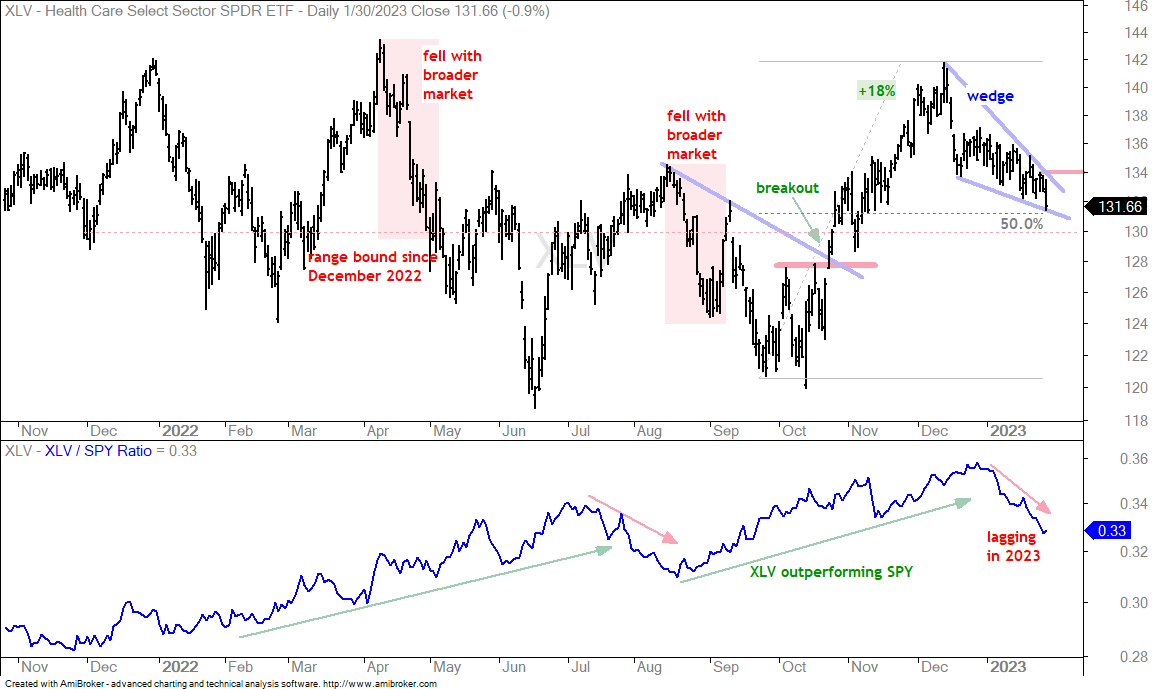
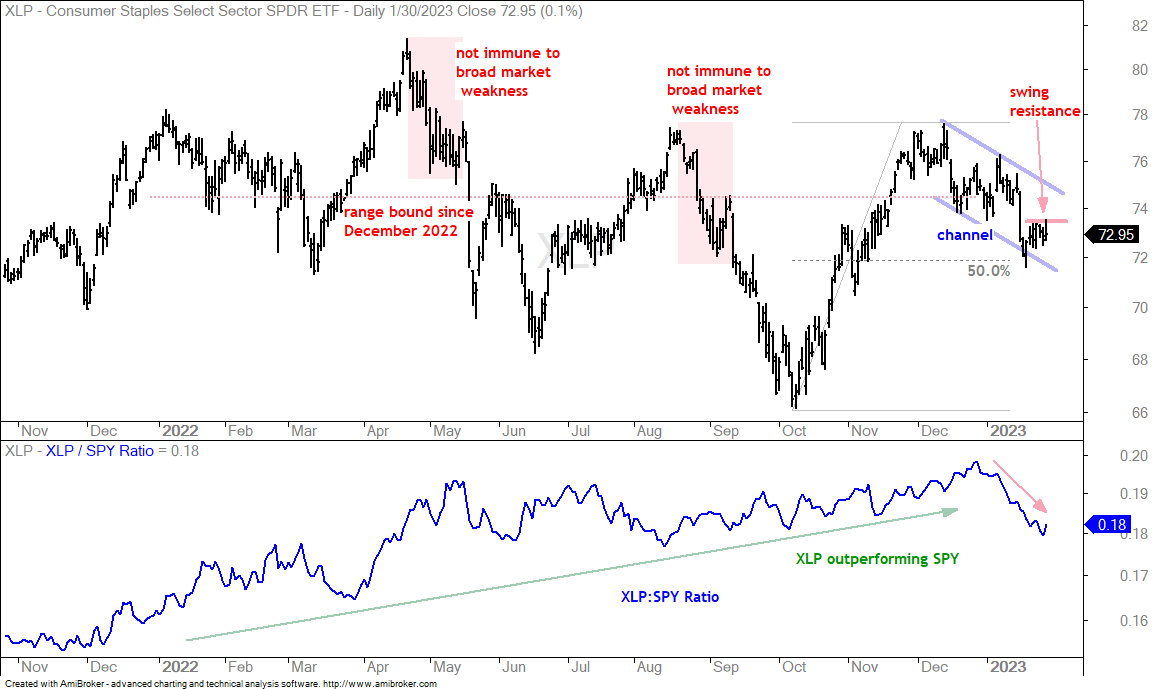
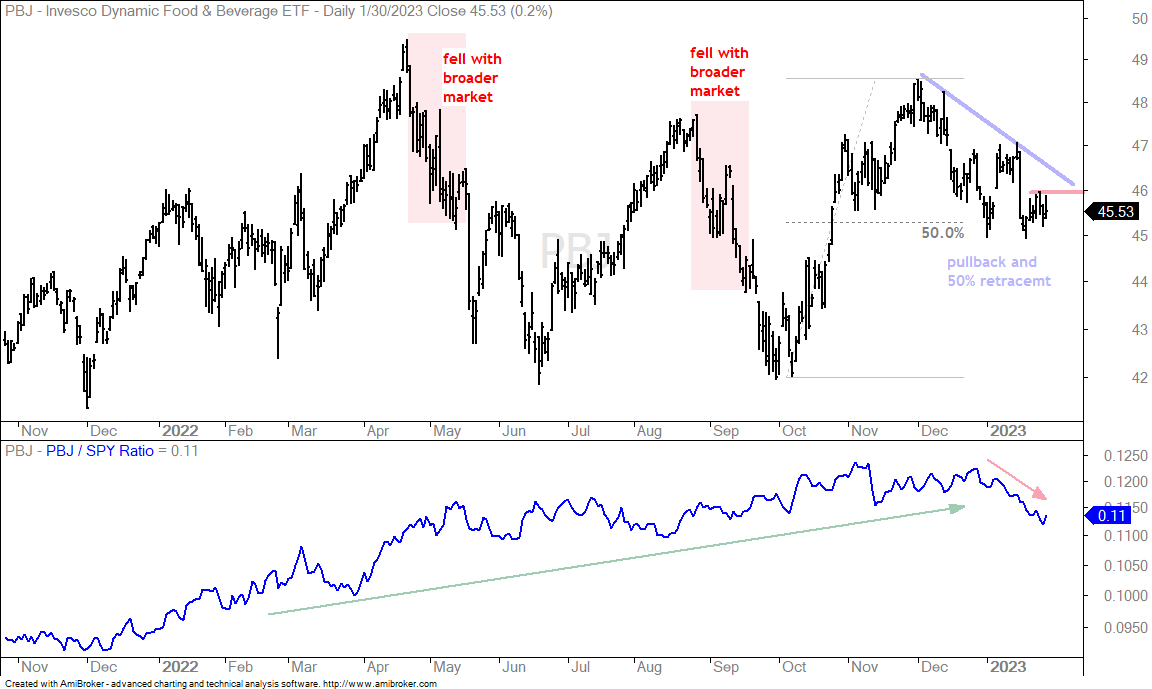
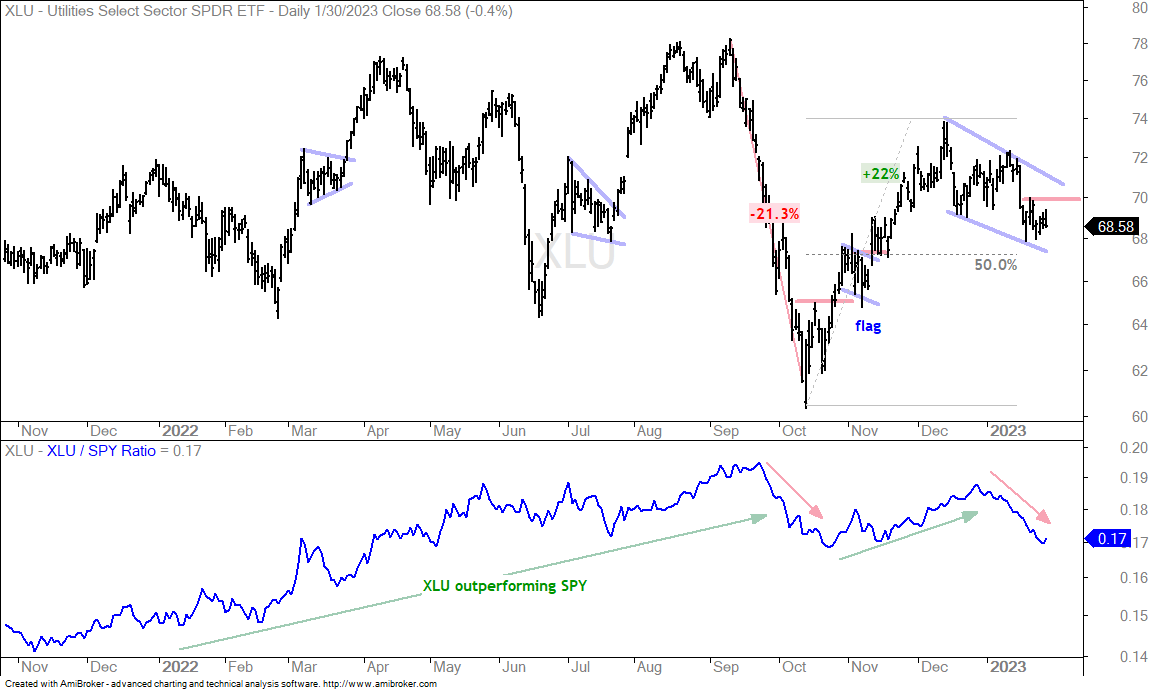
The S&P 500 Low Volatility ETF (SPLV), Healthcare SPDR (XLV), Consumer Staples SPDR (XLP), Utilities SPDR (XLU) and Food & Beverage ETF (PBJ) are leading lower here in 2023, but they retraced around half of their prior advances and show pullbacks after sharp advances. Some also formed short-term bullish continuation patterns. Long-term, all five ETFs are range bound since December 2022 and pretty much unchanged over the last 14 months.
There is, however, a catch to these bullish setups. The CBM is negative and a short-term trend reversal in SPY would likely weigh on these ETFs. Note that SPY fell sharply in April and again from mid August to mid September. These ETFs were not immune to broad market weakness and fell along with SPY. The red shading on these charts shows the two periods. These defensive ETFs held up better than SPY because their declines were less in percentage terms.
There is sometimes an identifiable downswing within the corrective pattern. For example, the XLP chart above shows a falling channel and a downswing in January. The red line marks downswing resistance and a breakout here would show the first sign of strength. Further strength above 75 is needed to break channel resistance. The chart below shows the Food & Beverage ETF (PBJ) with downswing resistance at 46.
Insurance and Defense Hold Up
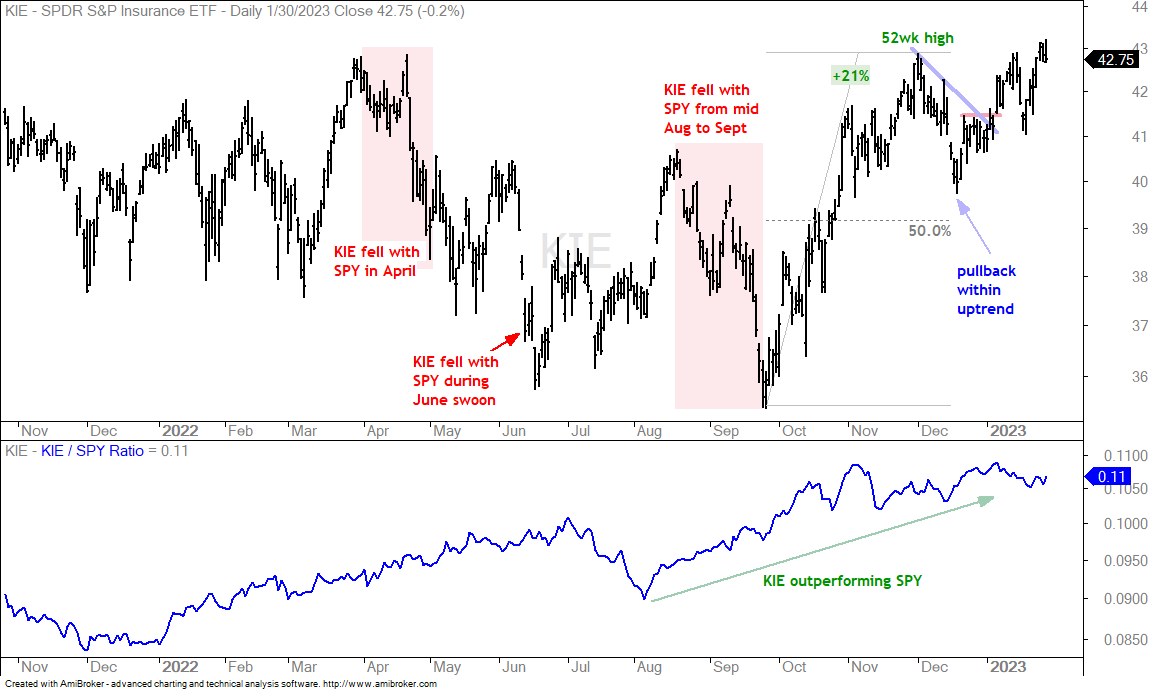
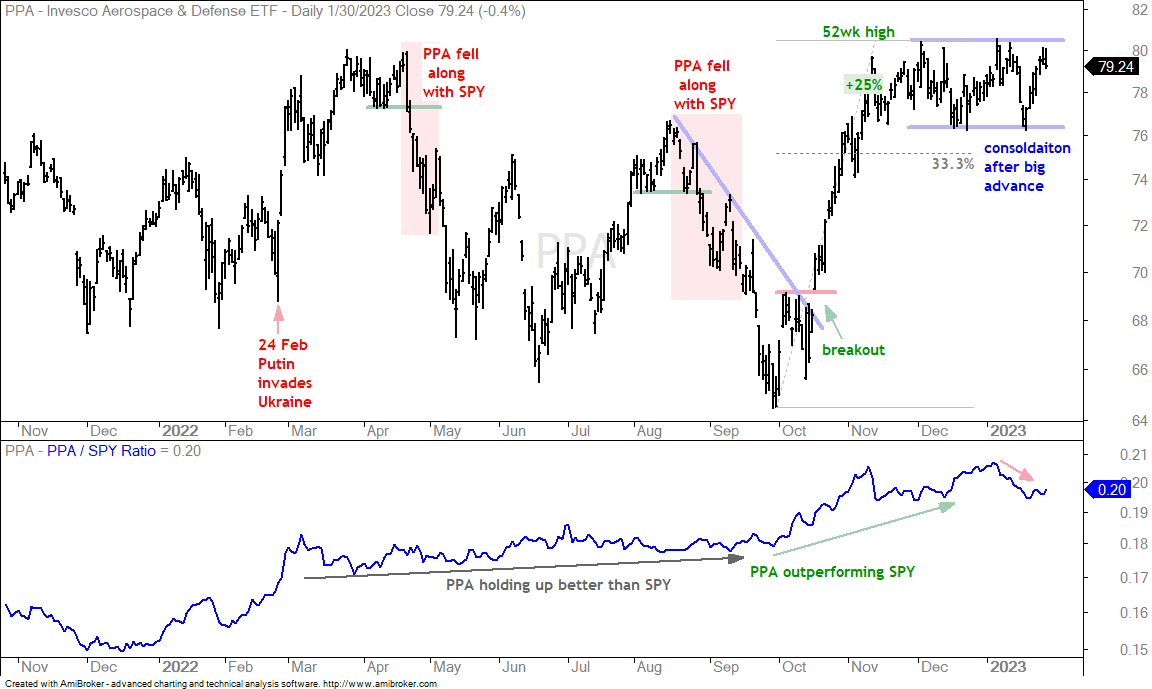
The Insurance ETF (KIE) and the Aerospace & Defense ETF (PPA) held up better than the five defensive ETFs shown above. These five pulled back in January, while KIE rose 4.4% and PPA gained 1%. The first chart shows KIE with a 52-week high in December, a pullback into mid December and a breakout in January. The ETF hit a new high over the last few days.
The next chart shows PPA falling along with SPY in April and again in mid August (red shading). The ETF surged in October-November and then consolidated near 52-week highs. Technically, a consolidation after a surge is a bullish continuation pattern. The only negative is the broad market environment, which could weigh if SPY turns lower.
IBB Holds Wedge Breakout
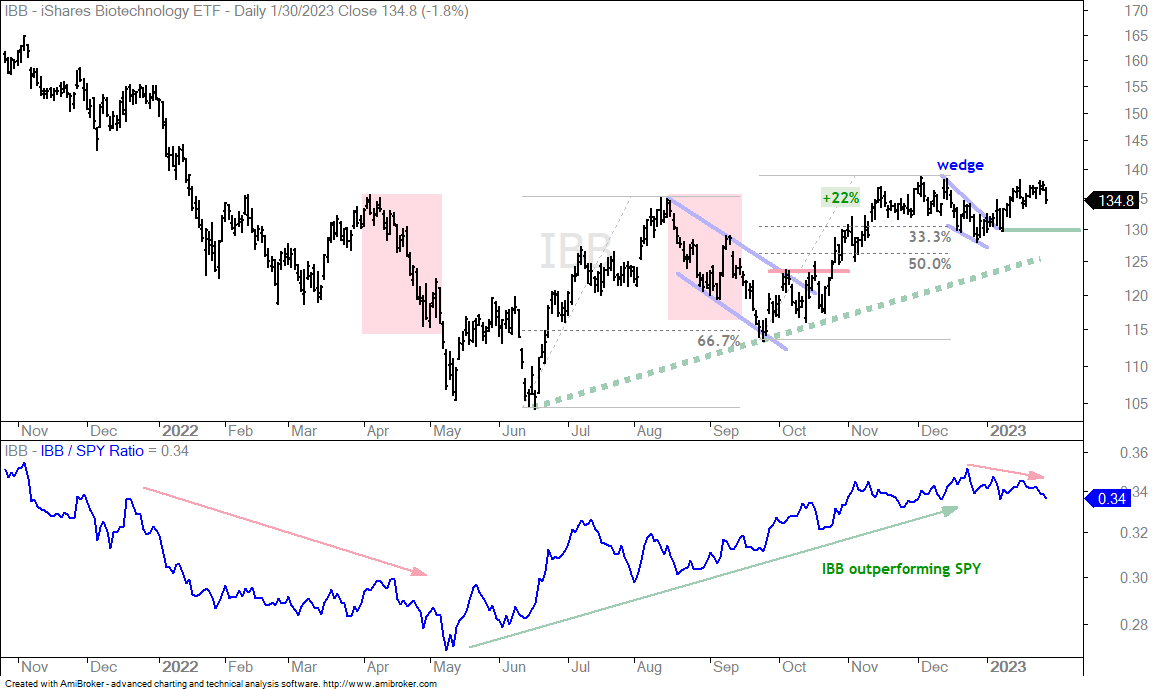
The Biotech ETF (IBB) remains in a long-term uptrend and the falling wedge breakout is the active short-term signal. The wedge breakout is holding, but we have not seen much follow through. IBB is fine as long as the wedge breakout holds. A close below 130 would negate this breakout and argue for a re-evaluation. Biotech stocks are stocks and IBB is also not immune to broad market weakness. The red shading shows IBB falling in April and August, along with the broader market.
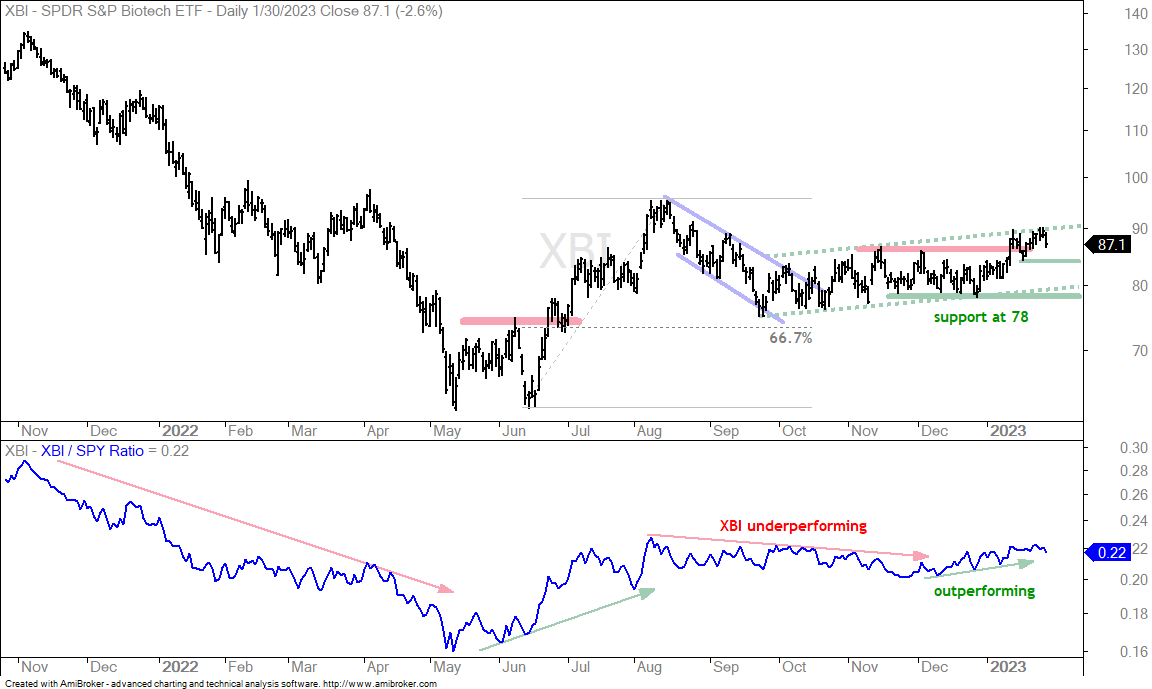
The Biotech SPDR (XBI) is a little harder to gauge. The ETF is rising since October with a choppy advance (green dashed lines). A break below 78, which is 11% lower would reverse this uptrend. It is hard to say what will happen within the channel (80-90 range). Those looking for a higher re-evaluation level can watch for a break at 84.
Home Construction ETF Continues to Lead
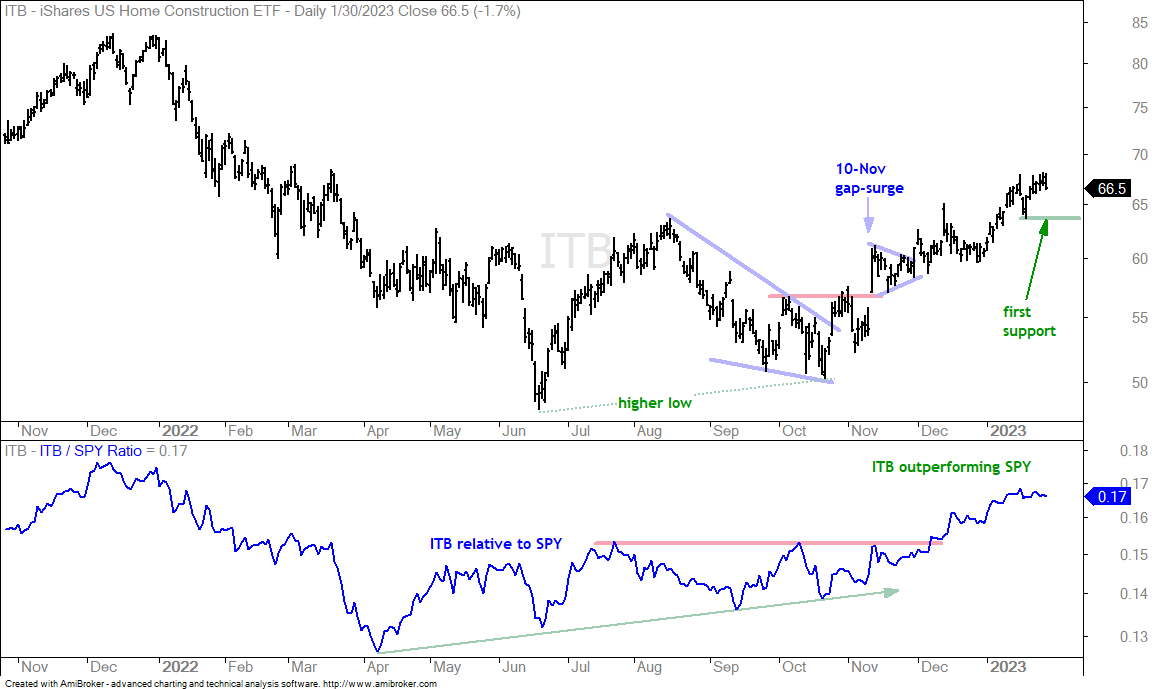
The Home Construction ETF (ITB) remains a market leader overall and the ETF is in an uptrend. It broke out with a surge above 60 on November 10th and then worked its way higher with a move above 65. I am marking first support at 63.50 (green line). A close below this level would reverse the immediate uptrend and argue for some sort of correction.
Marking Support for DB Base Metals and Copper (DBB, CPER)
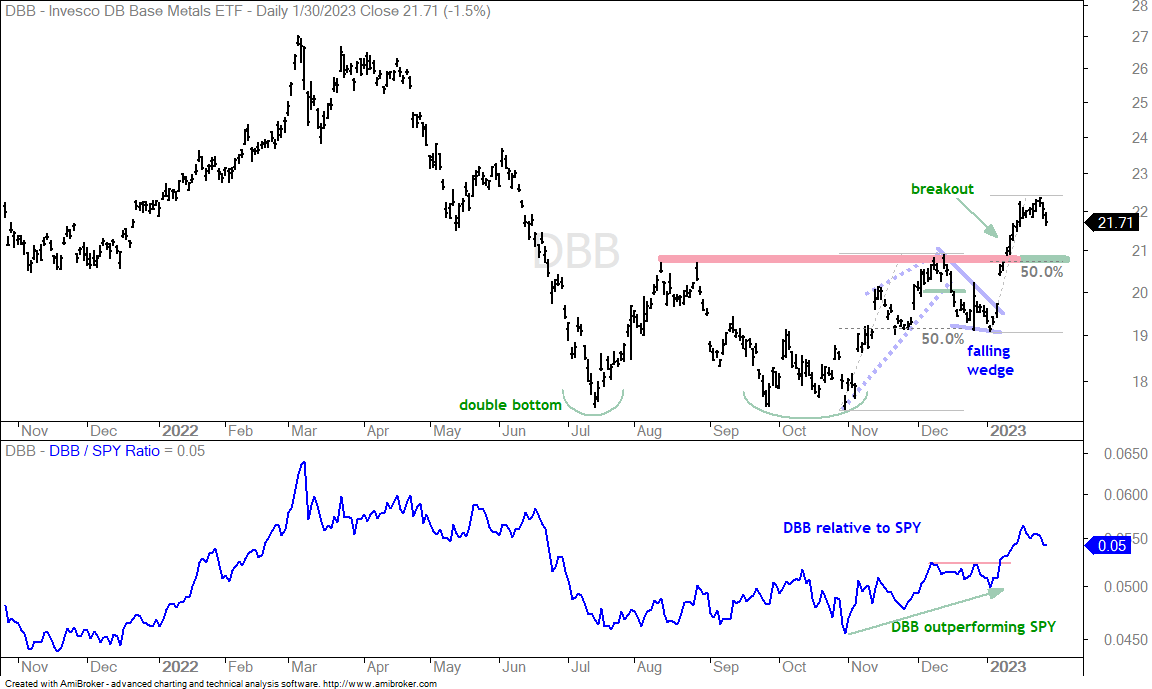
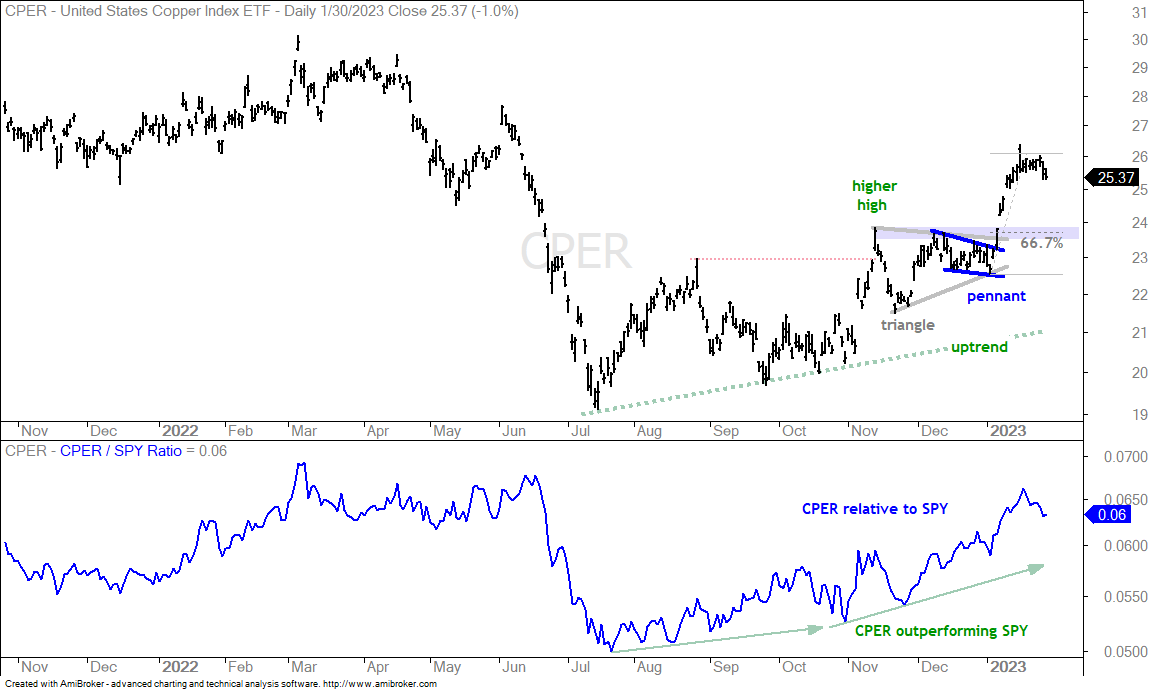
The DB Base Metals ETF (DBB) and Copper ETF (CPER) led the market higher in January with double digit moves that forged higher highs. They were quite overbought last week and remain overbought even as they fell back the last two days. I am still watching and waiting for a better setup. The first chart shows the DBB breakout in early January and the breakout zone turning first support to watch on a pullback. A move back to the 20.7 area would also retrace half of the January surge.
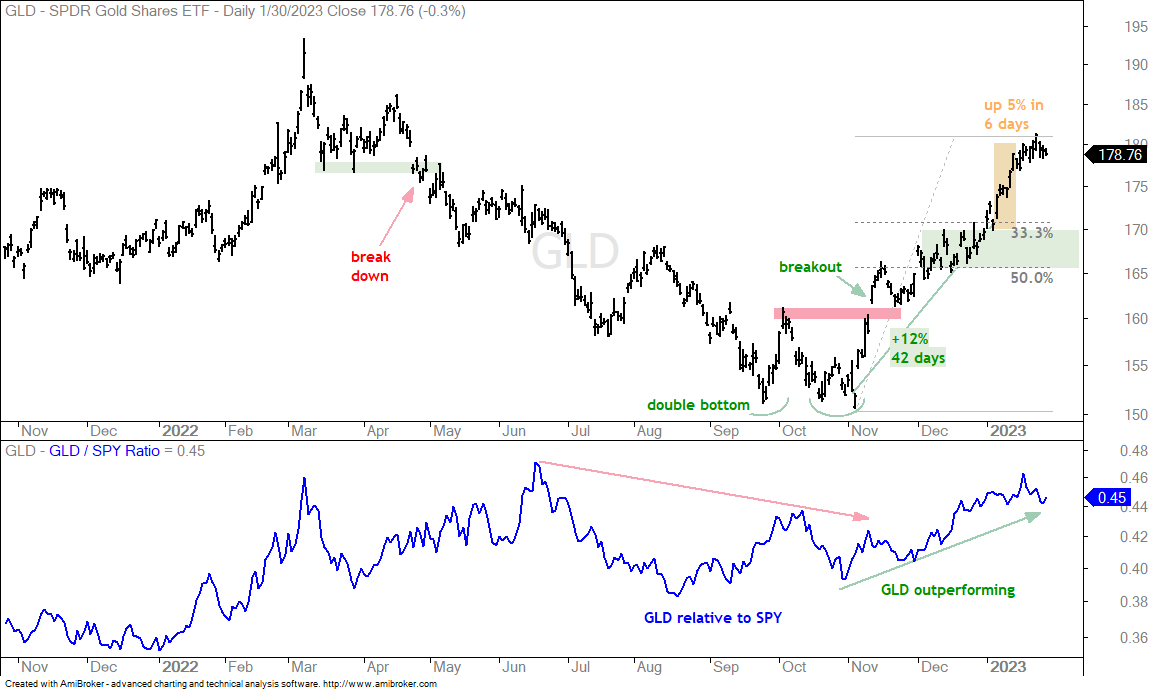
Gold SPDR Remains Extended (GLD)
I was concerned with the Gold SPDR (GLD) two weeks ago after a 5% surge in six days (yellow shading). GLD pushed even higher with a move above 180 last week and remains very overbought. Overbought does not guarantee a pullback or consolidation, but it does increase the odds going forward. The green shading marks the first support zone to watch.
You can learn more about my chart strategy in this article [7] covering the different timeframes, chart settings, StochClose, RSI and StochRSI.