Stocks extended their advance into mid August with new Trend Composite signals triggering in the Russell 2000 ETF (IWM) and EW Technology ETF (RYT) the last few days. Note that the Trend Composite has yet to trigger bullish for SPY or XLK. Trend Composite signals in the former two show strength coming from small-caps and mid-caps. It also shows that large-caps are lagging in a way. Regardless, the stock market has been on a tear since mid July with SPY up 13.5%, QQQ up 16.2% and IWM up 18.6%. Despite these big moves, IWM is the only one of the three above its 200-day SMA and with a positive Trend Composite. Also note that the Composite Breadth Model remains net bearish. There are very few setups right now because stocks moved sharply higher the last five weeks and many ETFs are short-term overbought. A chart setup occurs when there is a pullback after a big move or trend reversal.
About the ETF Trends, Patterns and Setups Report
This report contains discretionary chart analysis based on my interpretation of the price charts. This is different from the fully systematic approach in the Trend Composite strategy series. In this ETF Trends, Patterns and Setups report, I am looking for leading uptrends and tradable setups within these uptrends. While I use indicators to help define the trend and identify oversold conditions within uptrends, the assessments are mostly based on price action and the price chart (higher highs, higher lows, patterns in play). Sometimes the chart assessment can be at odds with the indicators.
This Week's Commentary Schedule
Tuesday – 16 August: Market-ETF Report and Signal-Rank Table Update
Wednesday – 17 August Market-ETF Video and Market Regime Update
Thursday – 18 August: Market-ETF Report and Signal-Rank Table Update
Saturday – 20 August: ETF Signal and Rank Table
Breadth Model Improves, but Remains Net Bearish
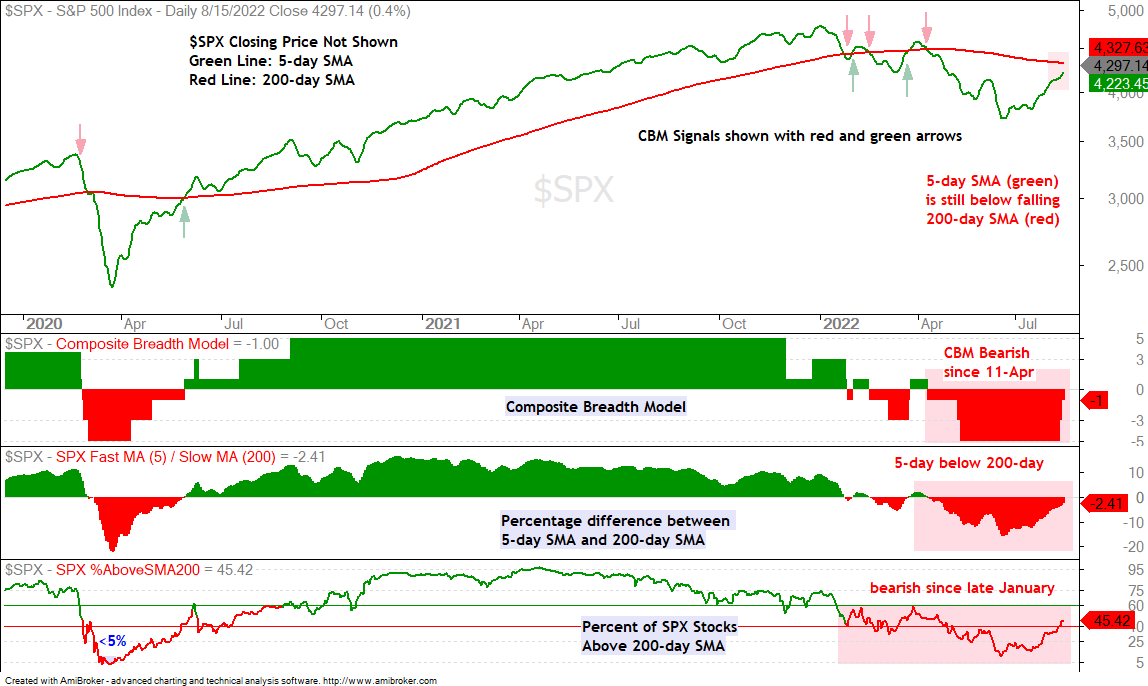
The Composite Breadth Model remains net bearish (-1), but improved as the broad market advance extended into mid August. Notice how the model moved from -5 to -1. The S&P 500 Thrust Model turned bullish on August 11th and the S&P 1500 Thrust Model turned bullish on August 12th. These models are driven by %Above 50-day SMA, %Above 20-day SMA and the 10-day EMA of Advance-Decline Percent. The Trend Models for the S&P 500 and S&P 1500 remain net bearish, and the 5-day SMA for the S&P 500 is around 2.4% below the 200-day SMA. Hence, two inputs are bullish (+2) and three are still bearish (-3) for a net of -1.
At this point, the market environment has moved from decidedly bearish to mixed with just over half of stocks in downtrends (below their 200-day SMAs). 45.42% of S&P 500 stocks are below their 200-day SMAs and 48.66% of S&P 1500 stocks are below their 200-day SMAs. The 200-day SMA is a real battle ground for the S&P 500 and this is where the fate of the market will be decided. The Composite Breadth Model is split and a 5/200 day SMA cross in the S&P 500 is needed to turn the model bullish.
The Trend is in Force Until
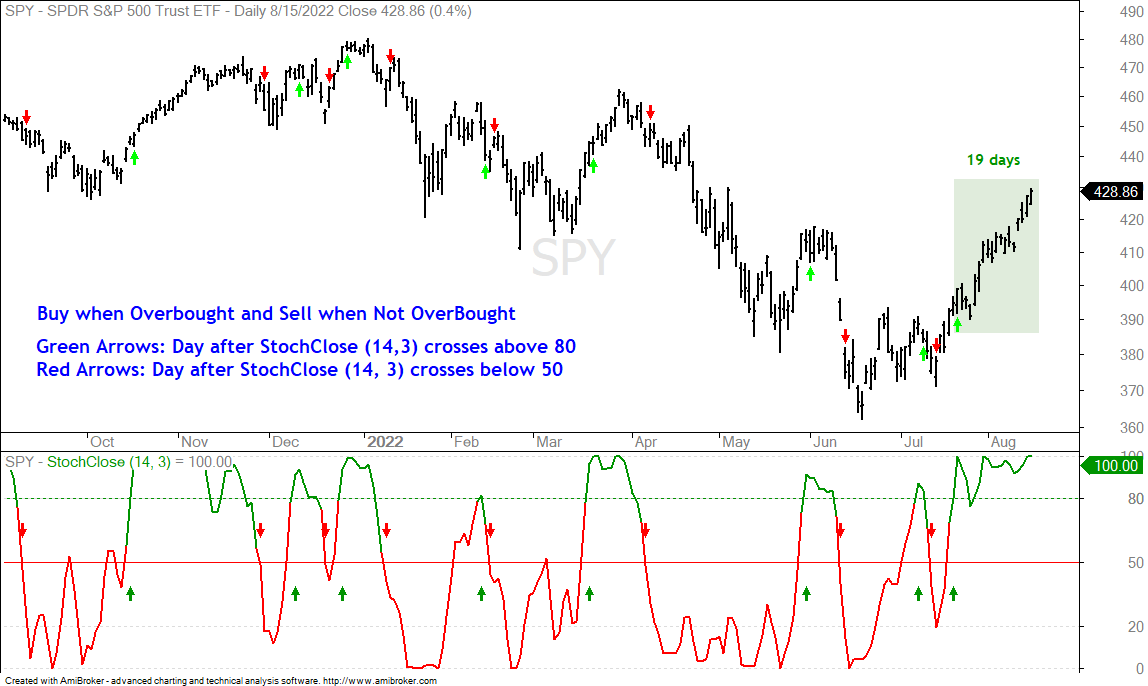
I put out a commentary this weekend[1] looking at overbought and oversold conditions using StochClose (14,3), which is similar to Stochastics (14,3). There were two key takeaways. First, overbought conditions last longer than oversold conditions. On average, overbought conditions lasted 17 days and oversold conditions lasted 11 days. Currently, SPY has been overbought for 19 days, which is just above average. Of 194 such signals since 2000, overbought conditions lasted twenty or more days 56 times and thirty or more days 18 times. Thus, we can expect stocks to become overbought and remain overbought longer than they remain oversold.
Despite longer overbought periods, it was still more profitable to buy when oversold and sell when not oversold (as opposed to buying when overbought and selling when not overbought). This is an interesting takeaway that validates mean-reversion strategies.
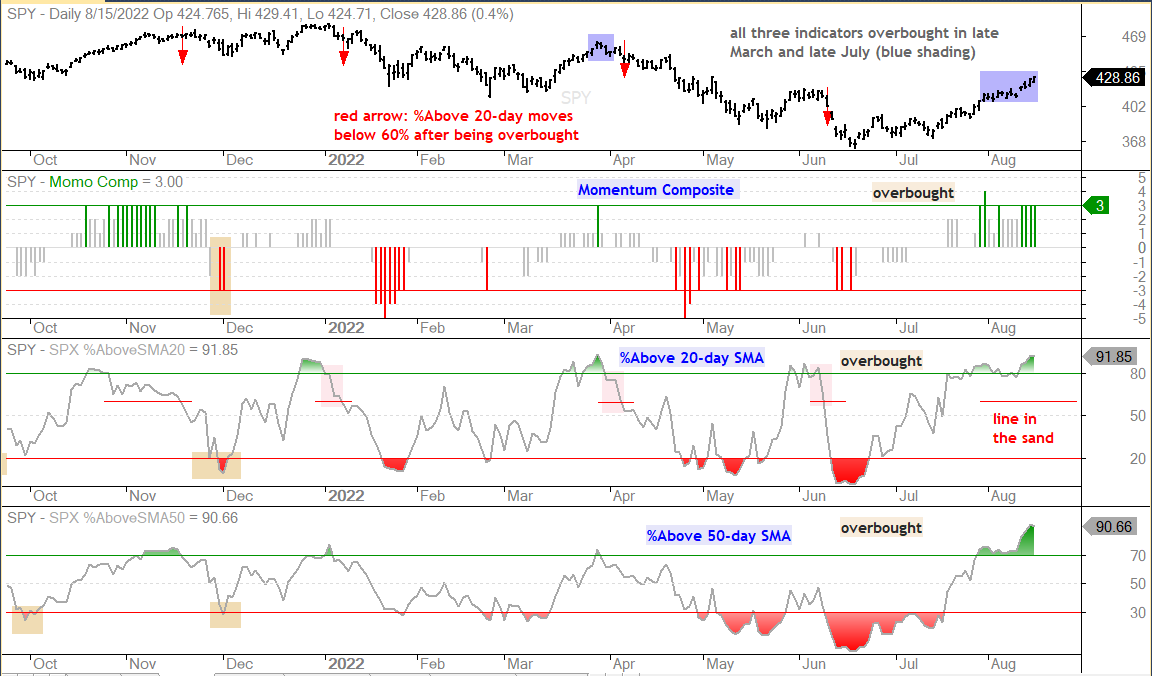
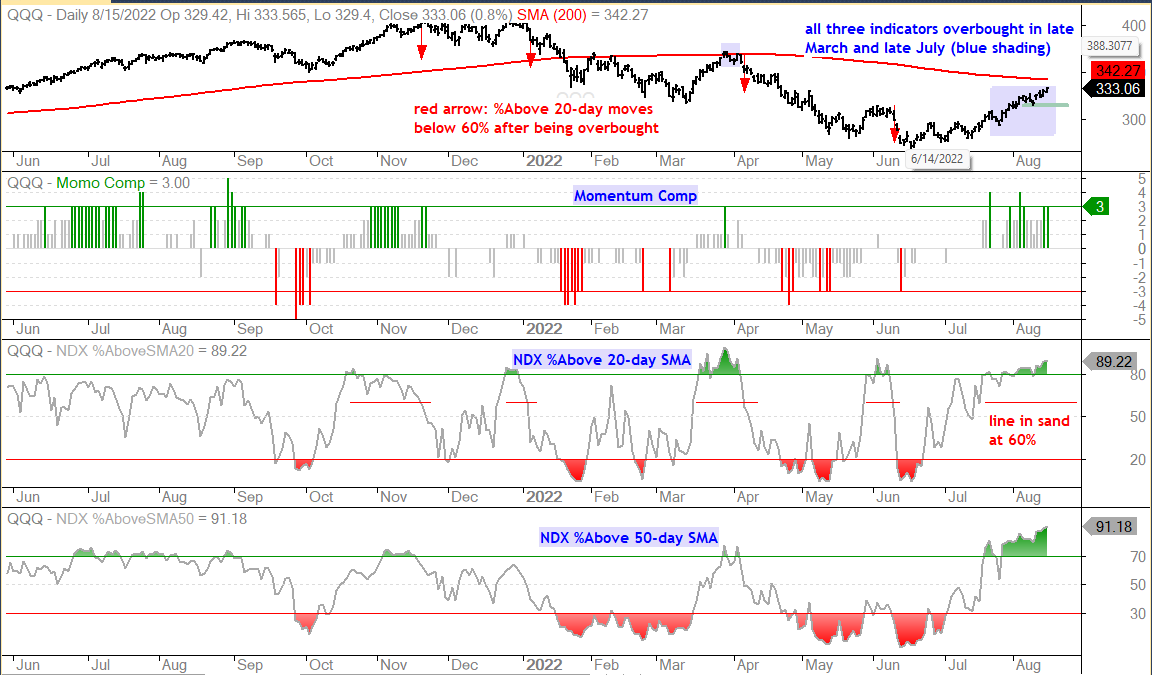
Charles Dow asserted that the trend is in force until proven otherwise. While Dow was mostly concerned with longer term trends, I think we can apply this to short-term trends. This also fits with the idea of overbought and staying overbought. The chart below shows the S&P 500 with the Momentum Composite, SPX %Above 20-day SMA and SPX %Above 50-day SMA. All three were “overbought” on July 28th and all three are overbought now (August 15 close). The blue shading on the S&P 500 price shows this 13 day period. Prior overbought conditions ended with a move below 60% in SPX %Above 20-day SMA and this is the level I am watching now (red line).
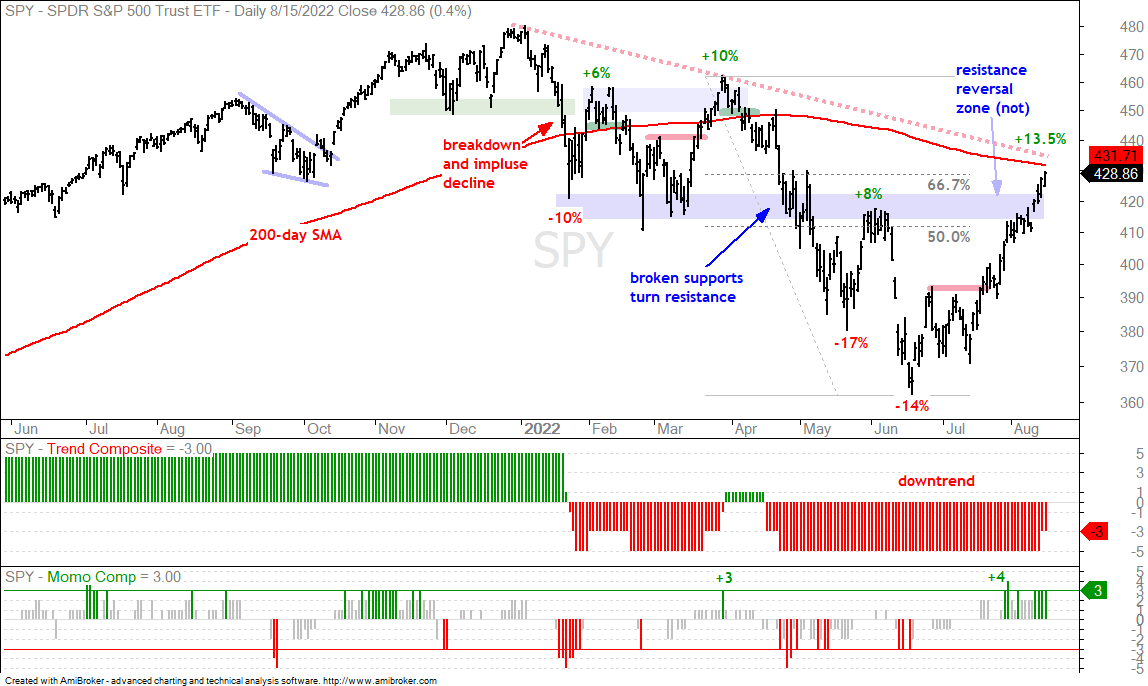
The next chart shows SPY with the resistance-reversal zone that never led to a reversal. In hindsight, it was the resistance-reversal zone seen by everyone and their dog (too obvious). This brings me back to overbought conditions and the short-term trend being in force until proven otherwise (reversed). Overbought conditions are more likely to last longer than expected and a reversal does not happen until there is some sort of signal. Resistance-reversal zones are interesting and produce possible setups, but signals drive decisions. In fact, SPY is at another resistance-reversal zone as it trades near the falling 200-day SMA.
So, the Composite Breadth Model is still net bearish and the S&P 500 5-day SMA is below the 200-day SMA. I do not have a long-term bullish signal for the stock market or SPY and this means the current advance is still considered a counter-trend move or bear market bounce. The short-term trend is up and has yet to be proven otherwise with a bearish signal. I am watching %Above 20-day SMA for a short-term bearish signal.
SPY, QQQ and IWM Hit Resistance-Reversal Zones
The next chart shows QQQ extending its advance and nearing the falling 200-day SMA. The long-term trend remains down and the short-term trend remains up. Again, I am watching NDX %Above 20-day SMA. A move below 60% would be short-term bearish.
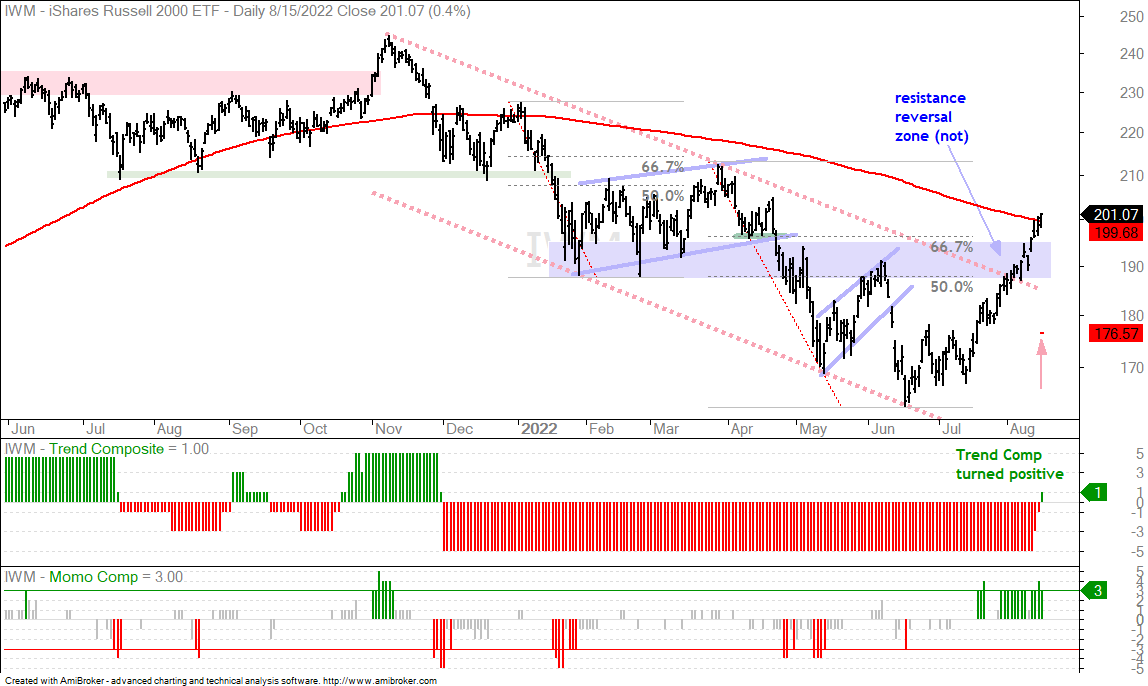
The next chart shows the Russell 2000 ETF (IWM) closing above its falling 200-day SMA the last two days and the Trend Composite turning positive on Monday. IWM was the first of the big three to turn bearish (December 1st). It is also the most prone to whipsaw. The red hash shows the 6xATR(22) trailing stop at 176.57, which is some 12% below the current level. Note that trend signals lag and occur after a significant move. The trend must extend for the signal to prove profitable.
More Trend Composite Signals (IWM, PPA, SPLV)
There are 274 ETFs in the Master List for the Trend Signal and Ranking Table. 168 are stock-based ETFs (US), 48 are non-stock ETFs and 58 are ETFs with foreign holdings. 34 of 168 stock-based ETFs are in uptrends (20%). This is still a pretty anemic number, but note that a fair number of ETFs are high beta. There are a dozen or so small-cap ETFs, 24 tech-based ETFs and 25 thematic high beta ETFs (ARKK, YOLO, DRIV, EDOC, HERO…). The Networking ETF (IGN) is the only tech-based ETF in an uptrend and none of the thematic beta ETFs are in uptrends. There is still some work to be done here.
The sector breakdowns are more bearish than bullish. Only two of the 11 sector SPDRs are in uptrends (Utilities SPDR (XLU) and Energy SPDR (XLE)). XLU is the only sector SPDR that hit a new high in mid August. The 11 equal-weight sectors are fairing better with uptrends in the EW Consumer Staples ETF (RHS), EW Industrials ETF (RGI), EW Technology ETF (RYT) and EW Utilities ETF (RYU). And, only two of the nine small-cap sector ETFs are in uptrends (Small-cap Industrials (PSCI) and Small-cap Utilities (PSCU)). The sector evidence is mixed, at best.
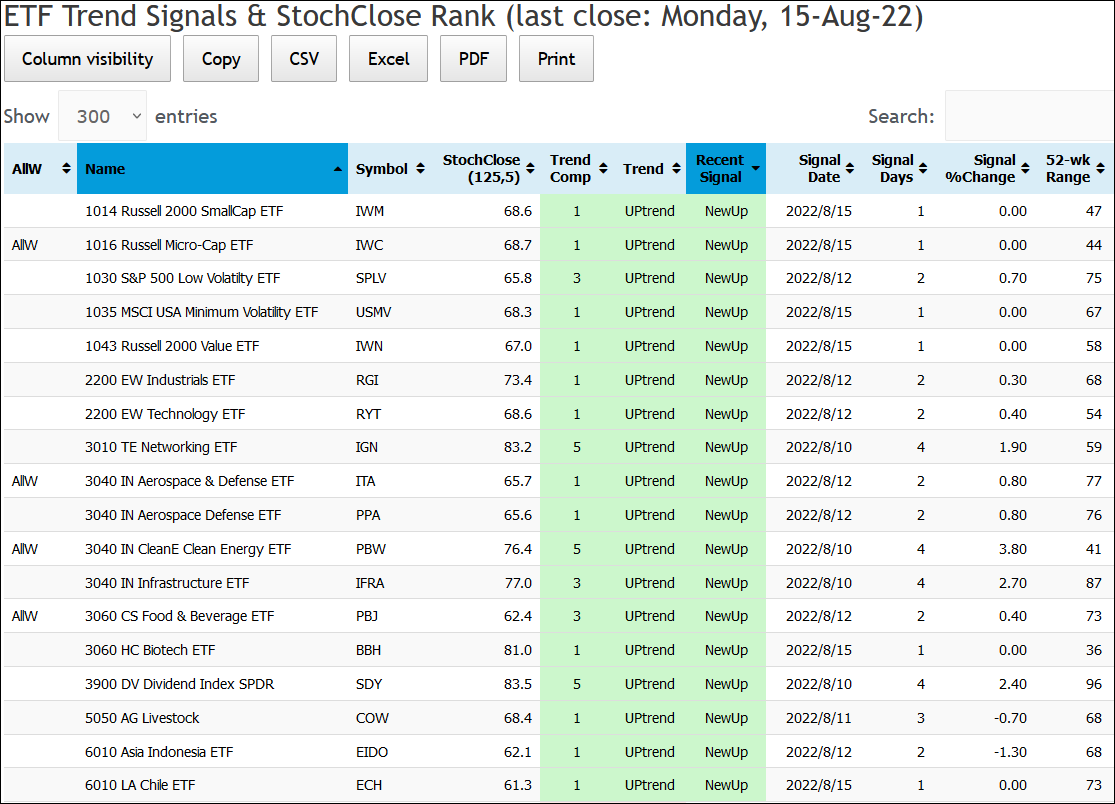
So where are these uptrends? The image below shows new uptrends in small-caps (IWM, IWN), industrials (RGI, PPA, ITA), low volatility (UMSV, SPLV) and high yield (IFRA, SDY). Strength in small-caps shows some risk-on, but strength in low volatility and high yield shows risk-off. Thus, the risk-off end of the market is leading, but there are pockets of strength at the risk-on end. These pockets include biotechs, clean energy, lithium, networking and equal-weight tech.
20+ Yr Treasury Bond ETF Breaks Down (TLT, TNX)
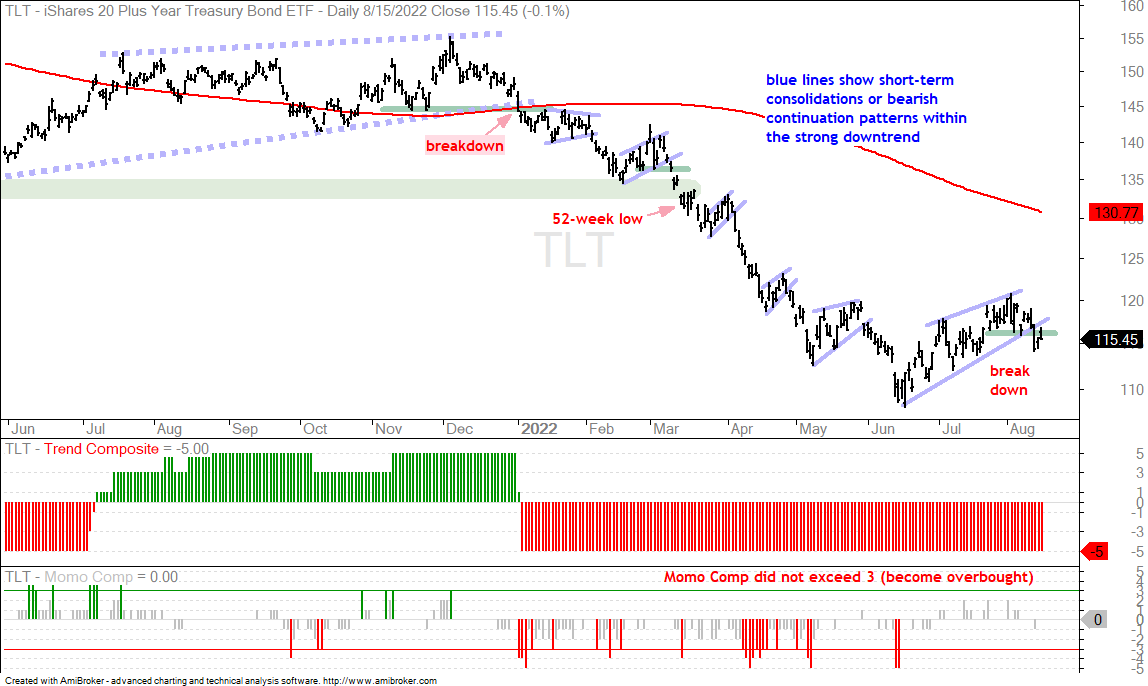
In contrast to SPY, there is a short-term bearish signal in the 20+ Yr Treasury Bond ETF (TLT). The chart below shows a rising wedge forming into early August. TLT is in a long-term downtrend so this wedge is deemed a counter-trend move. TLT broke wedge support with a sharp decline last Thursday and this move reverses the short-term uptrend. It also signals a continuation of the bigger downtrend. A close above 120 would argue for a re-evaluation.
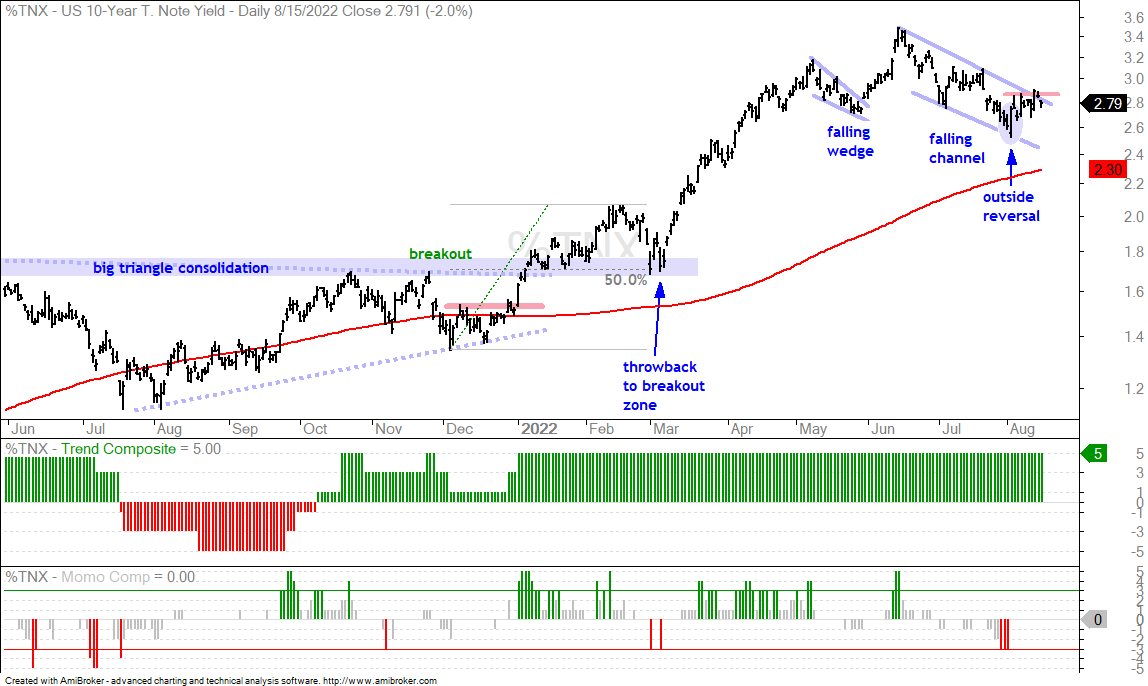
The next chart shows the 10-yr Treasury Yield with a falling channel correction into early August, an outside reversal on August 2nd and breakout close above wedge resistance last Thursday. Even though the 10yr yield fell back after the breakout, the long-term trend is up and the falling channel is a correction within this uptrend. The breakout is working and I expect Treasury yields to move higher.
You can learn more about the ATR Trailing Stop and exit strategies in this post[2], which includes a video and charting options for everyone.
DB Agriculture ETF Breaks Out as Wheat Firms (DBA, WEAT)
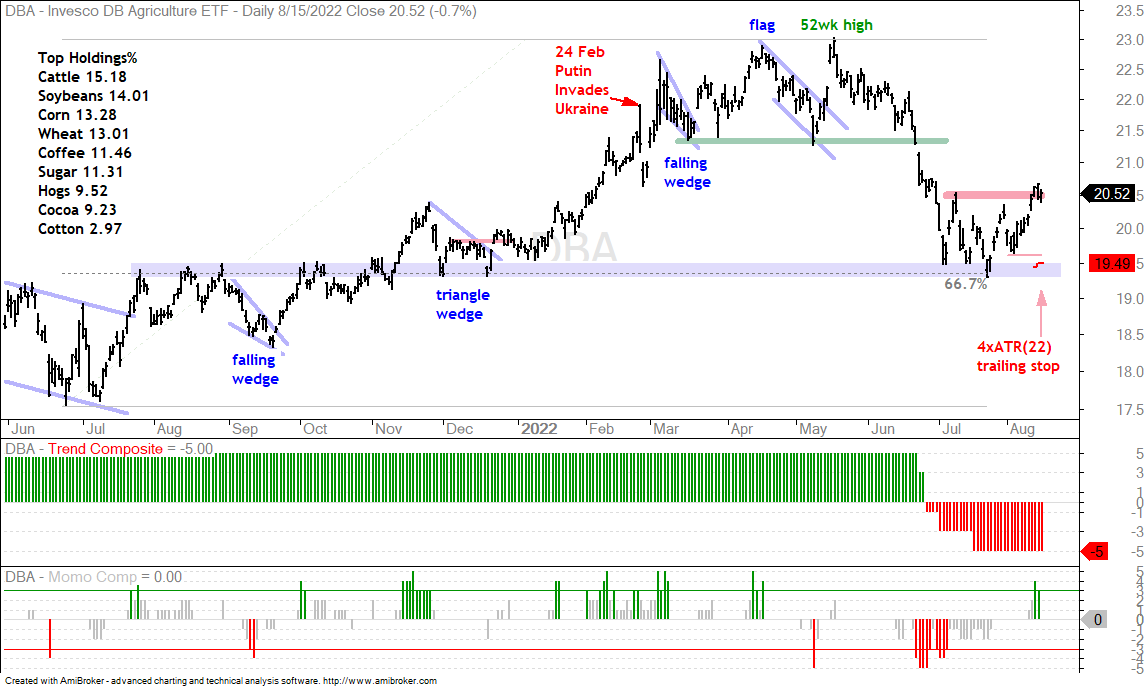
The DB Agriculture ETF (DBA) surged last week and broke above the July highs. Even though the Trend Composite remains negative, the price chart shows potential because the ETF hit a new high in May and the decline into July retraced around 2/3. This decline also returned to a support zone in the 19.5 area. The red hash shows the ATR Trailing Stop set at 19.49 (4 x ATR(22)). I chose four for the ATR multiplier to place the initial stop just below the early August low.
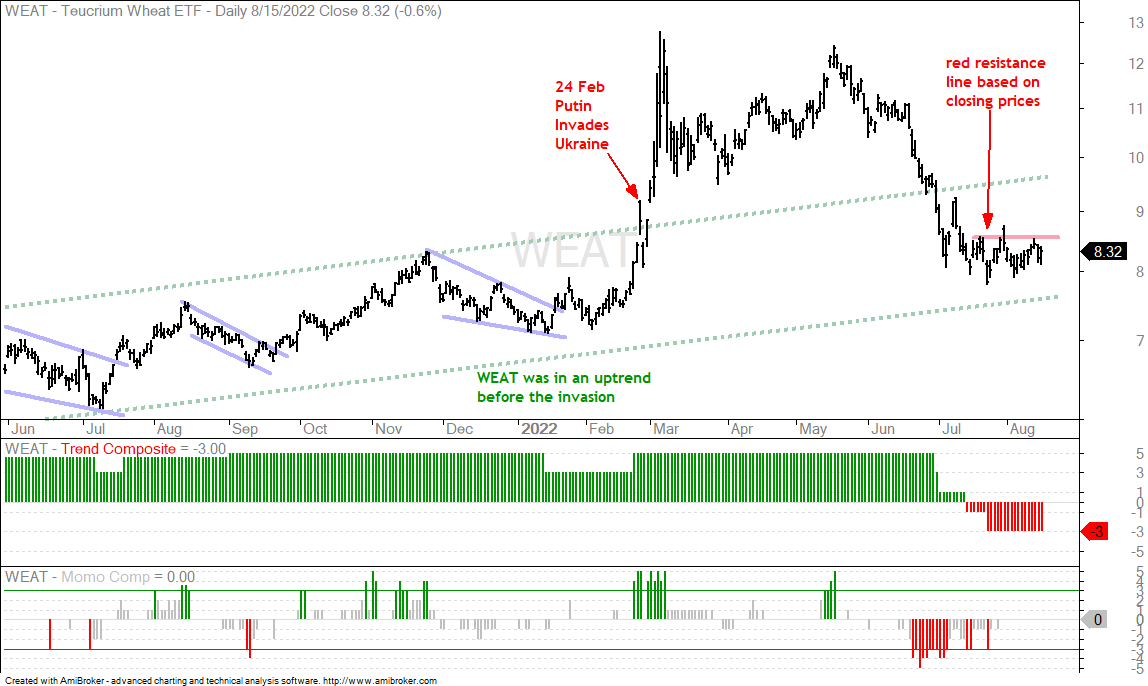
The Wheat ETF (WEAT) shows the difference between a setup and a signal. Not all setups lead to signals and not all signals lead to profits. For me, a setup occurs when there is a pullback or correction within an uptrend or after a big move. WEAT surged into March, stalled into mid June and plunged in the summer. The ETF returned to the prior uptrend (green rising channel) and firmed around 8 since mid July. The setup is a big pullback after the February-March surge. A resistance break (close above 8.5) would turn this setup into a signal.
Coffee ETF Breaks Out (JO)
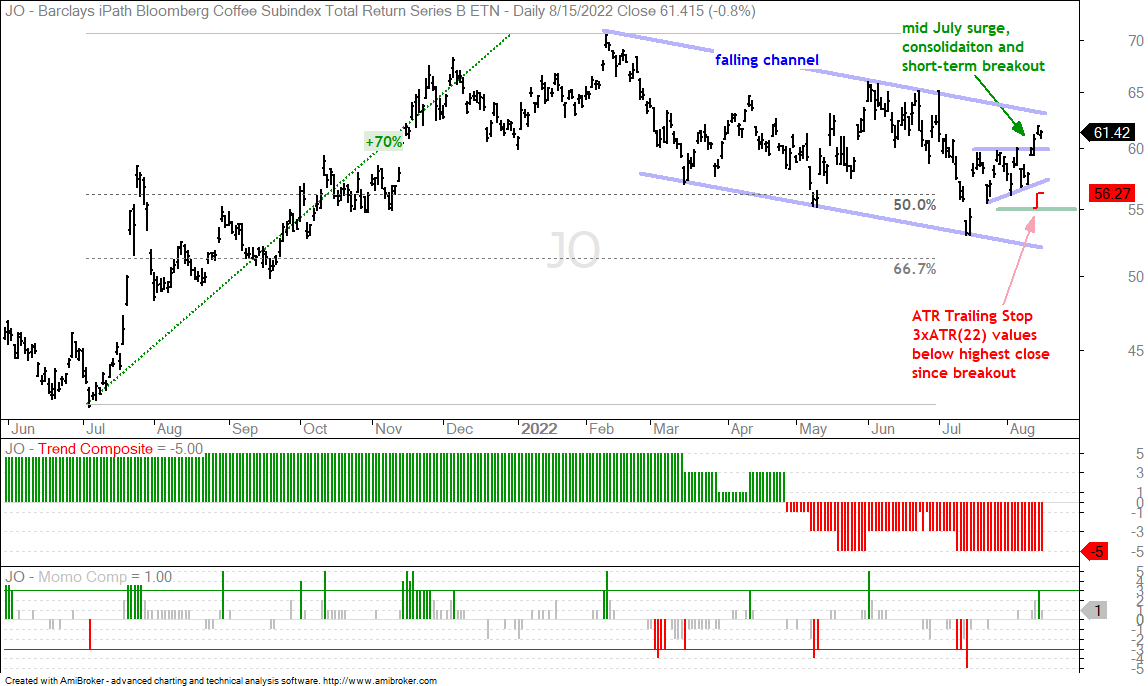
Coffee is also part of the DB Agriculture ETF and showing some short-term leadership with a short-term breakout. Overall, the ETF remains within a falling channel and the Trend Composite is negative. I consider the falling channel as a correction after the 70% advance. The short-term breakout is the first sign of strength that could lead to a bigger channel breakout in the 65 area. The ATR Trailing Stop is at 56.27 for reference.
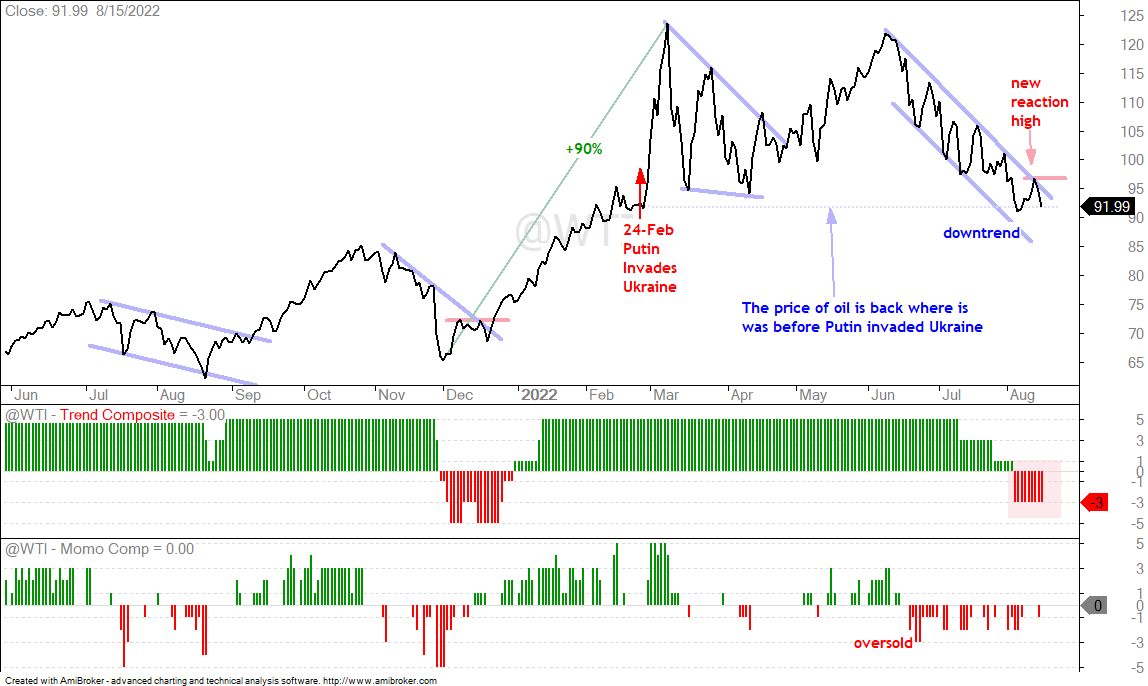
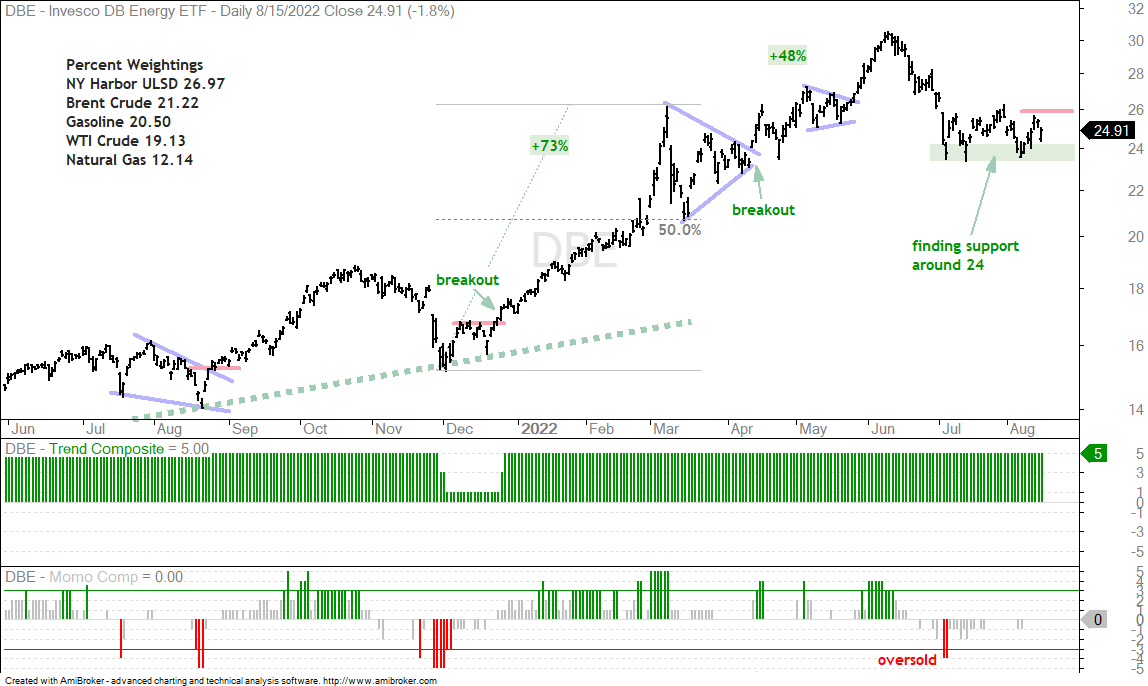
Oil Establishes New Resistance Level (WTIC, DBE)
West Texas Intermediate ($WTIC) was hit hard on Monday and this decline established a new reaction high (short-term peak) to watch for a breakout. Let’s forget support from the spring lows and the key retracements for now and focus on the immediate trend. WTI sports a series of lower lows and lower highs since late June and formed a falling channel to define this downtrend. The sequence needs to be broke for a reversal and a close above last week’s high (97) would reverse this downtrend.
The DB Energy ETF (DBE) is dominated by gasoline and oil with natgas accounting for just 12% of the ETF. Weakness in oil and gasoline is weighing on DBE as it triggered the ATR Trailing Stop with a decline last week. The Trend Composite remains positive because DBE is well above its March low, but it is hard to imagine DBE moving out as long as oil is weak.
You can learn more about my chart strategy in this article[3] covering the different timeframes, chart settings, StochClose, RSI and StochRSI.
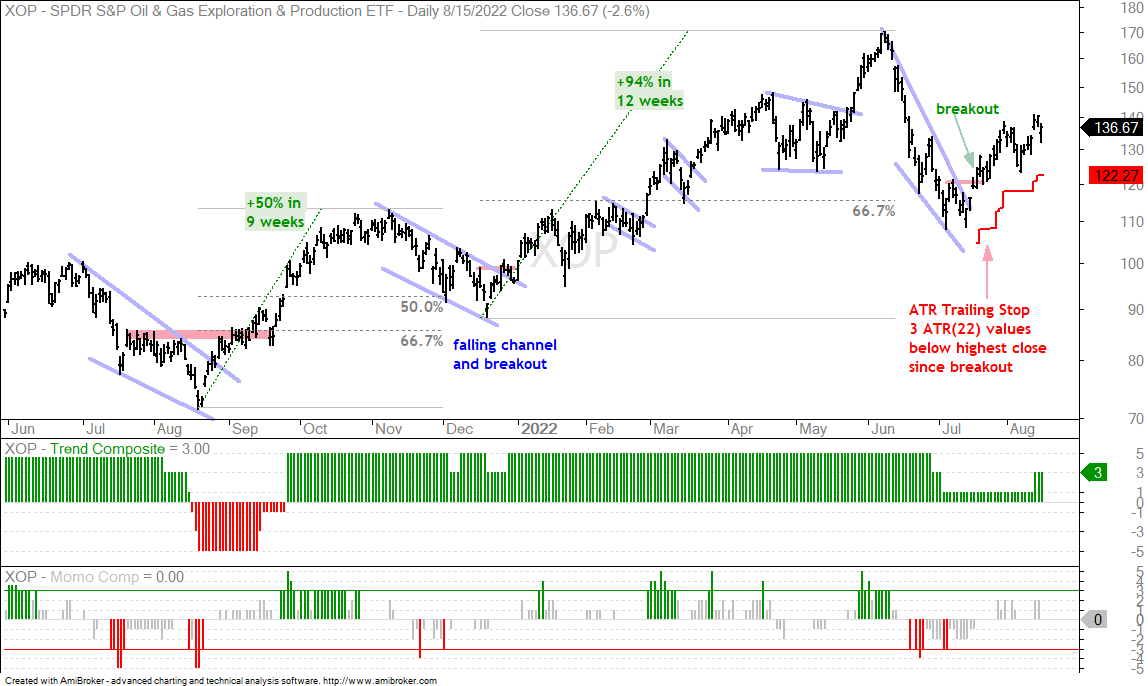
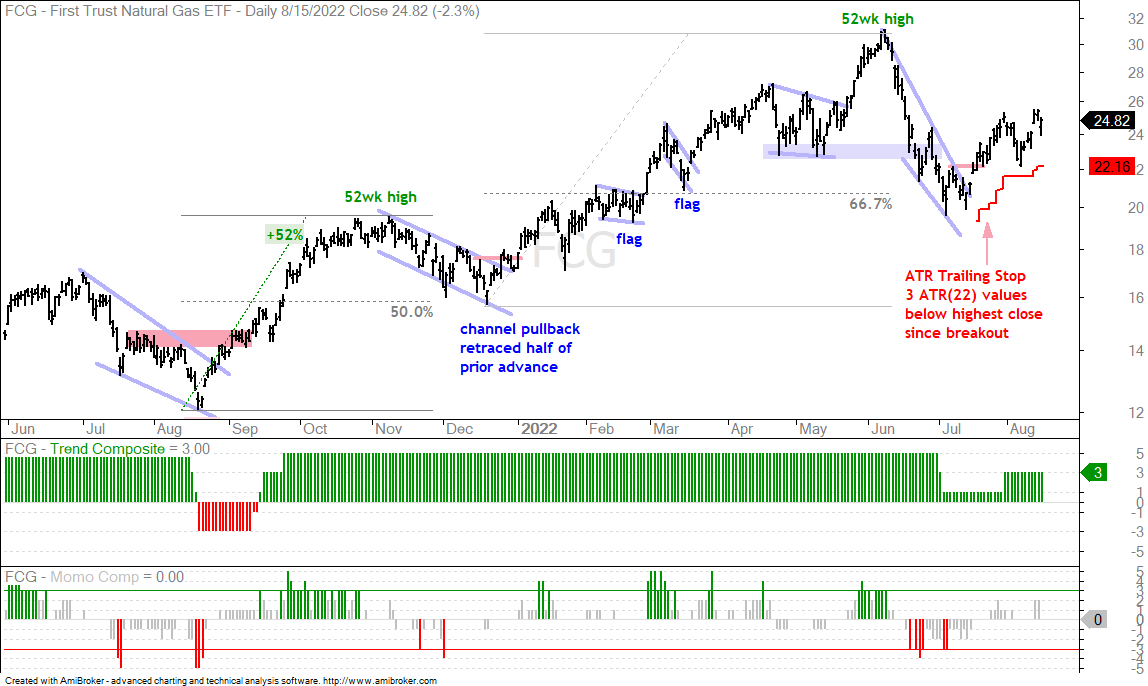
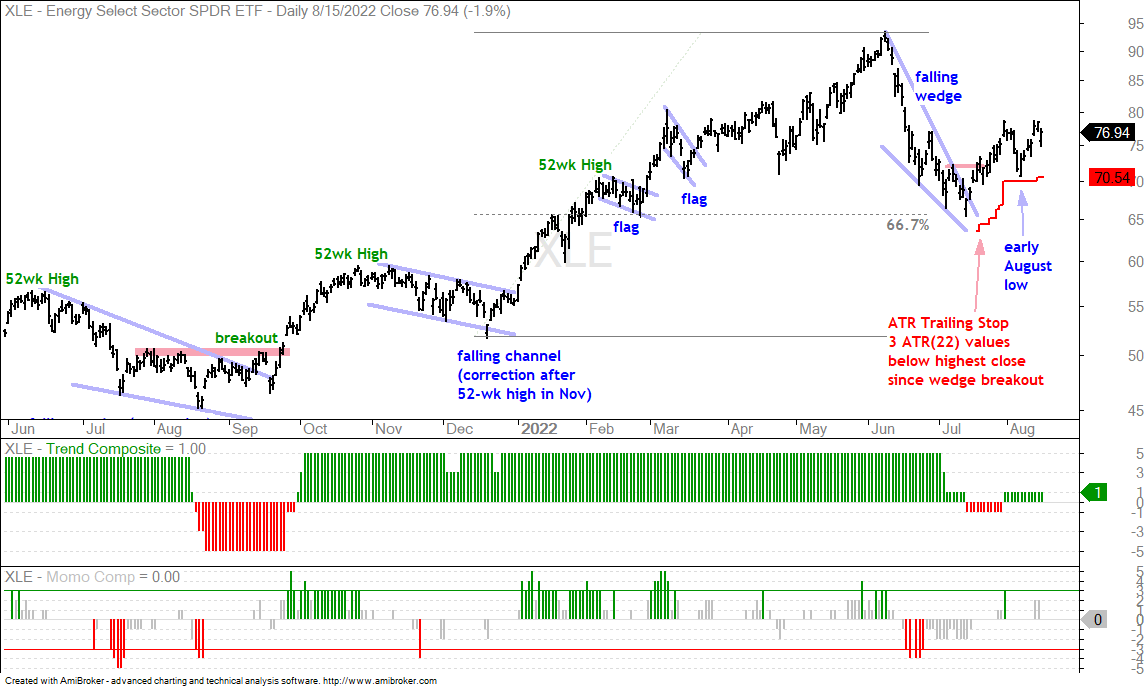
Updates for Energy-ETF Stops (XLE, XOP, FCG)
The Energy SPDR (XLE), Oil & Gas Exploration & Production ETF (XOP) and Natural Gas ETF (FCG) broke out of falling wedge patterns in mid July, fell back into early August and bounced last week. The wedge breakouts are holding overall and remain bullish until proven otherwise (wrong). Last week’s lows provide a natural support level to watch for the first signs of failure. A close below these lows would fully erase last week’s bounce and jeopardize the wedge breakouts. The charts also show the 3xATR(22) trailing stops. I used 3 as the multiplier to place the initial stop just below the wedge lows. These stops have since risen and are in line with the early August lows.
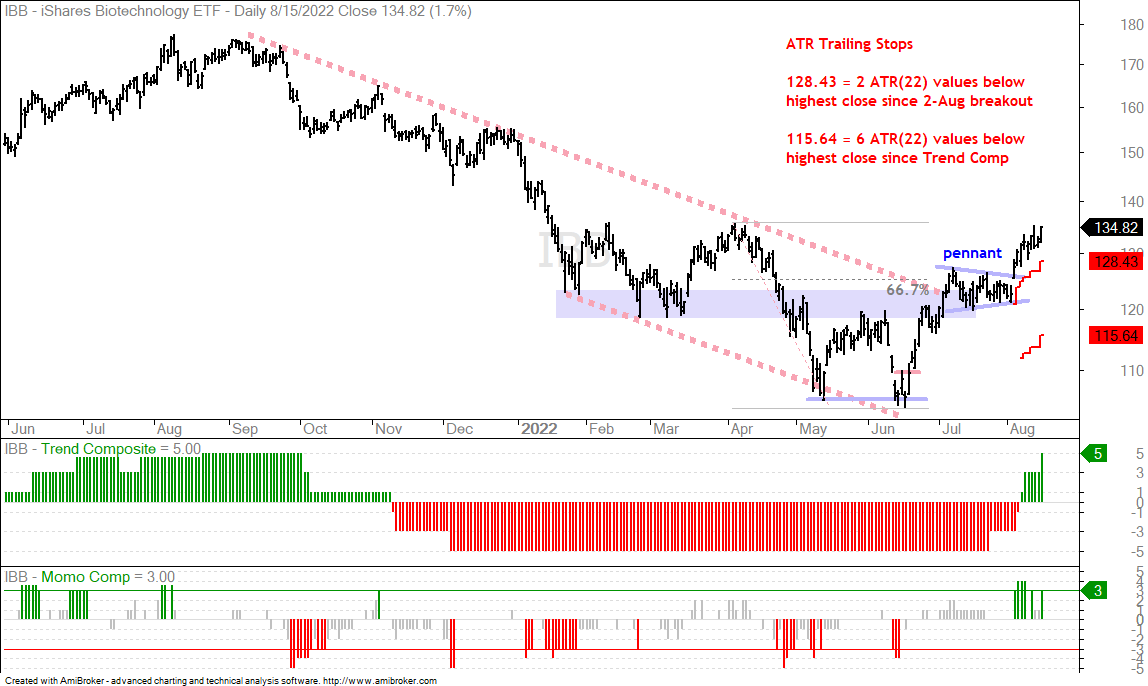
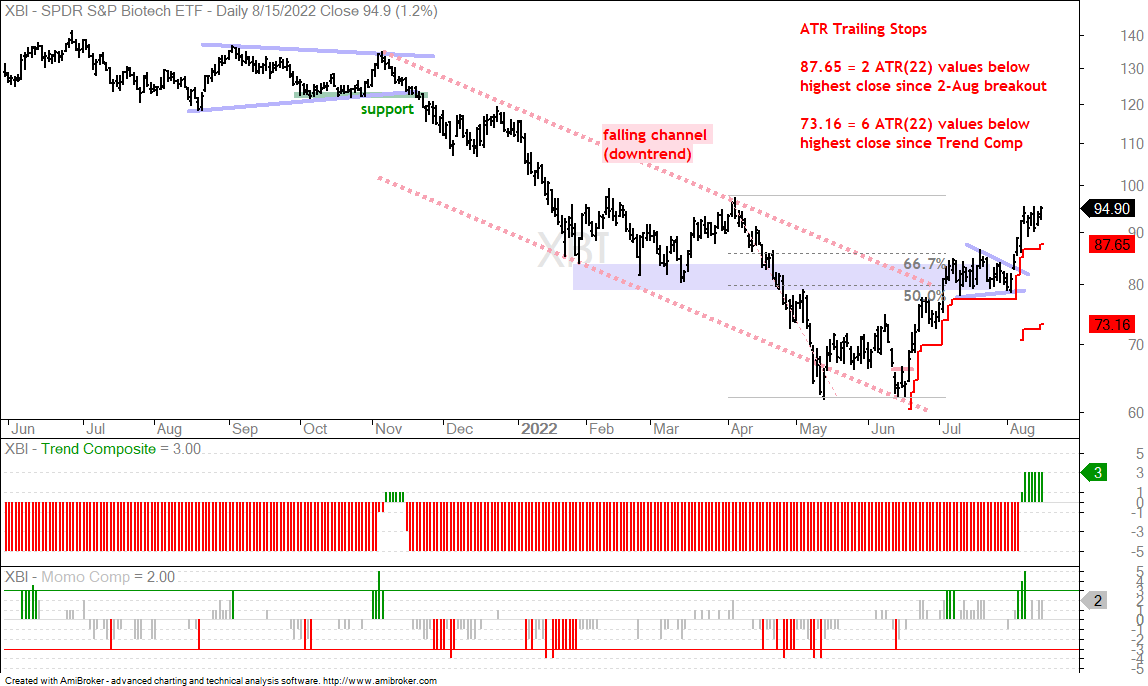
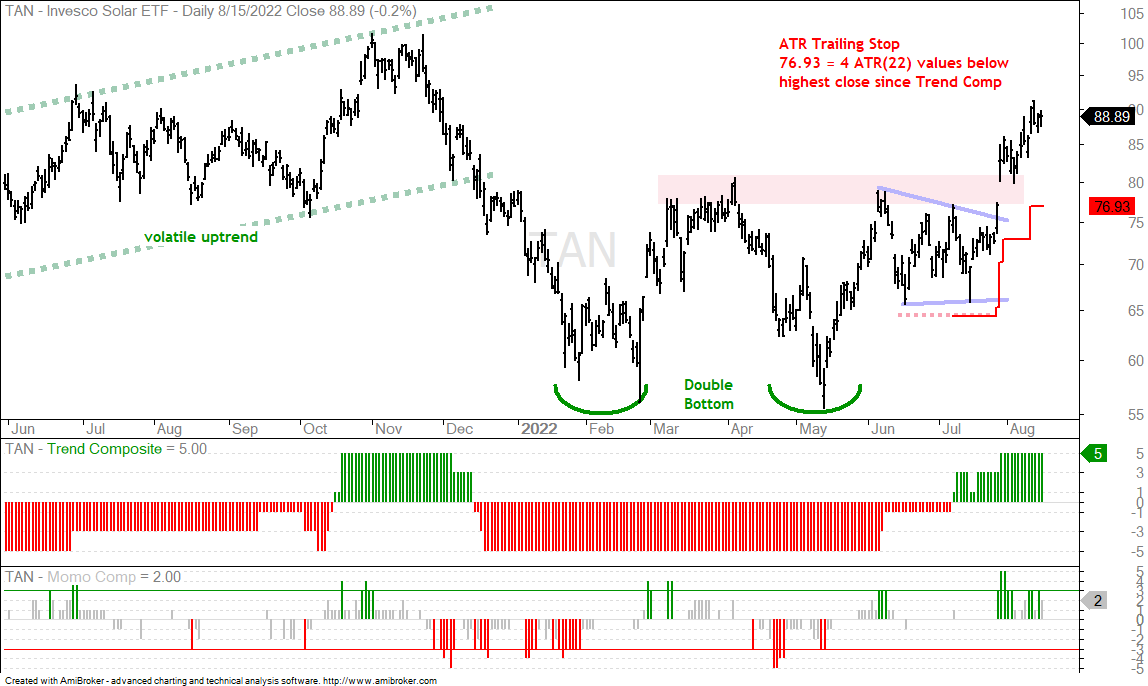
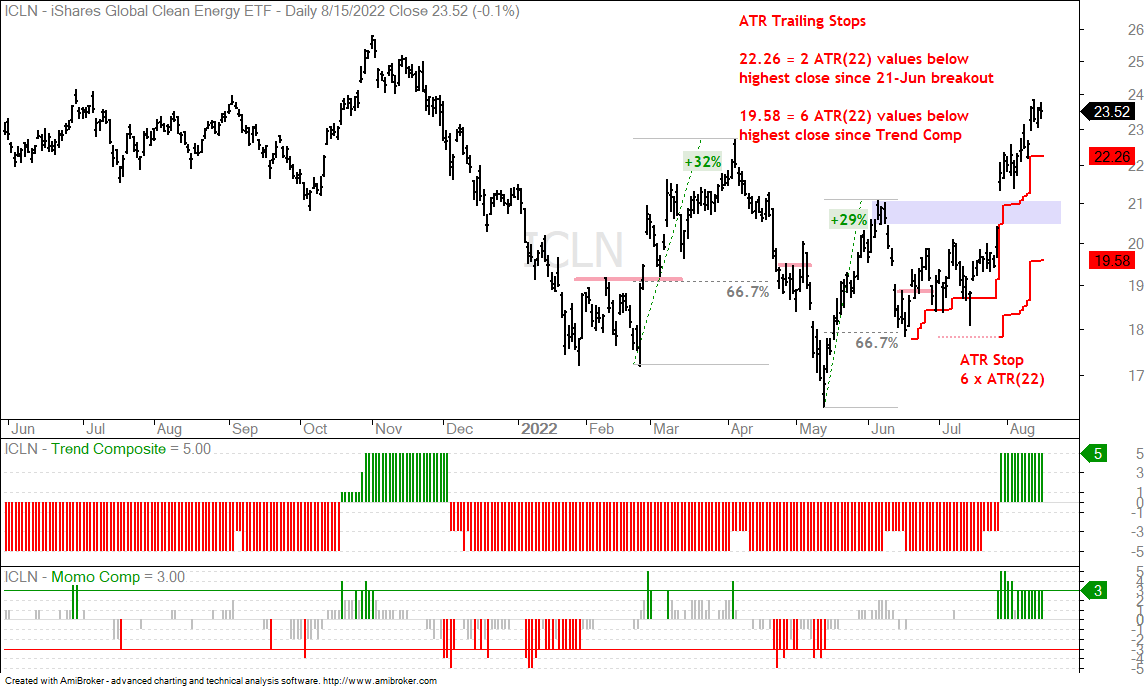
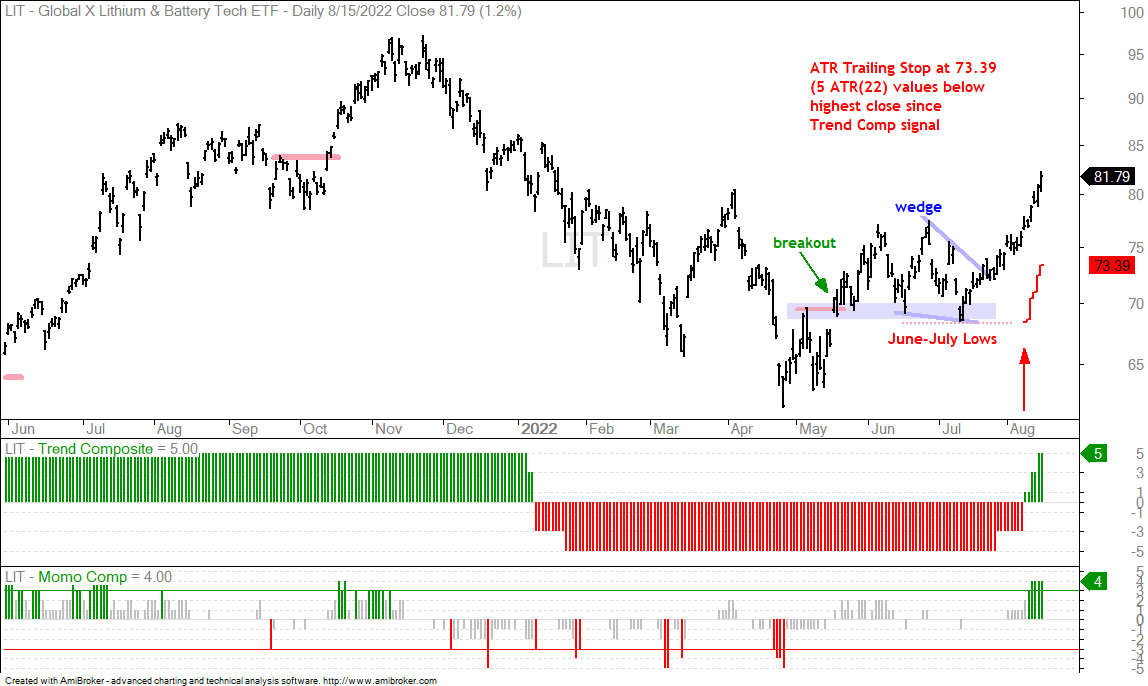
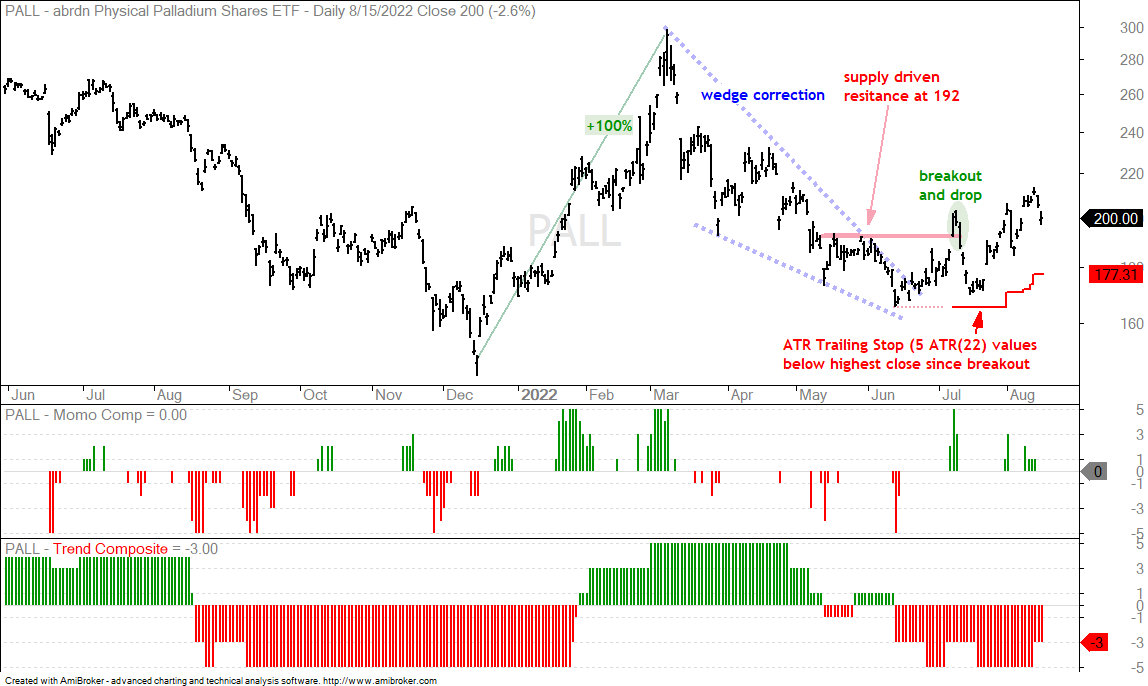
The next five charts update the ATR Trailing Stops for the Trend Composite signals in the Biotech SPDR (XBI), Biotech ETF (IBB), Solar Energy ETF (TAN), Global Clean Energy ETF (ICLN) and Lithium Battery Tech ETF (LIT). The Trend Composite turned positive for all five and I added trend-following trailing stops. The last chart shows the Palladium ETF (PALL) with an update for the stop.
Previous Commentary
Thecommentary (here)[5] on Thursday, August 11th, covered the following: