- trendinvestorpro.com - https://trendinvestorpro.com -

Market and ETF Report – SPY Challenges 200-day, 3 Key Groups to Watch, Healthcare and Water Leading (Premium)

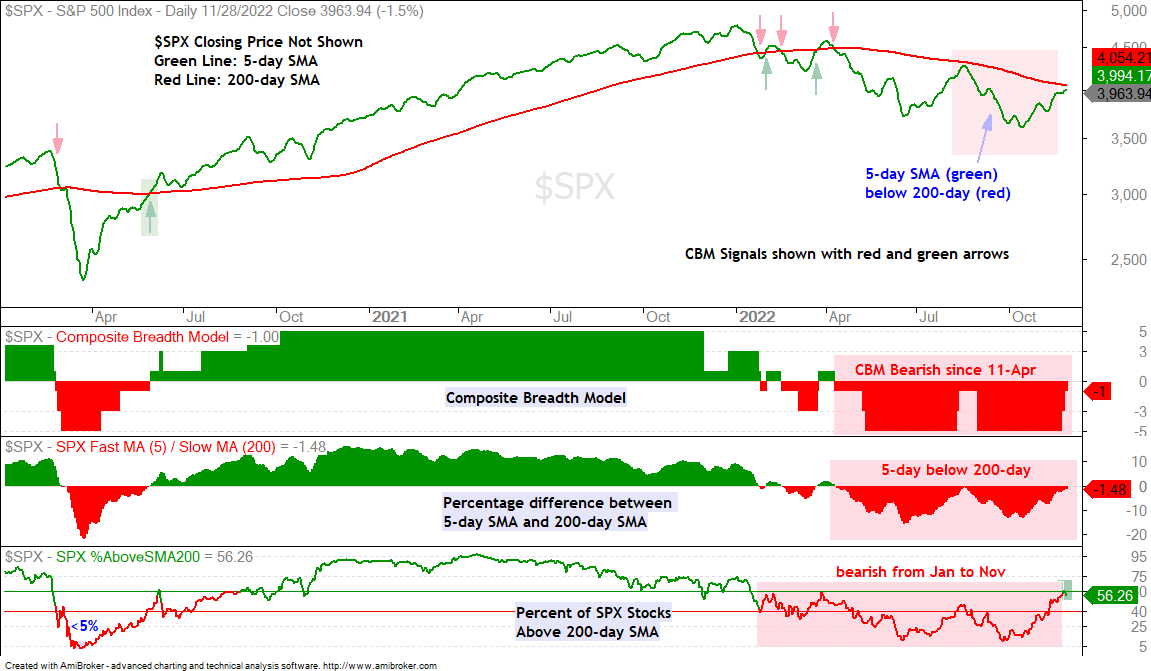
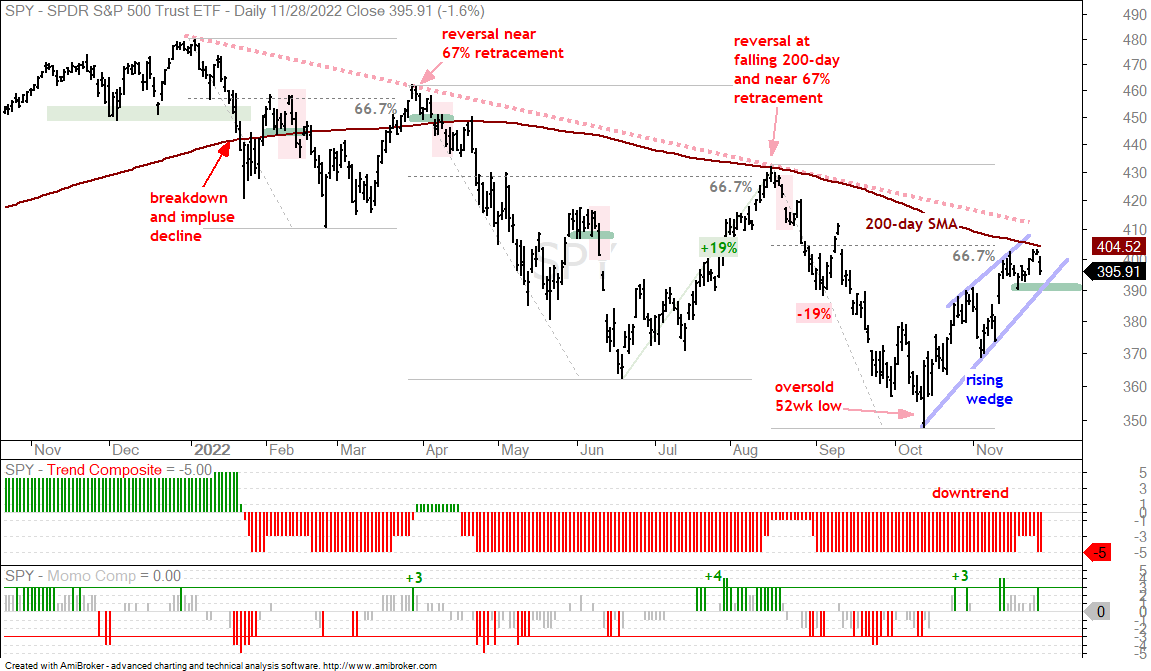
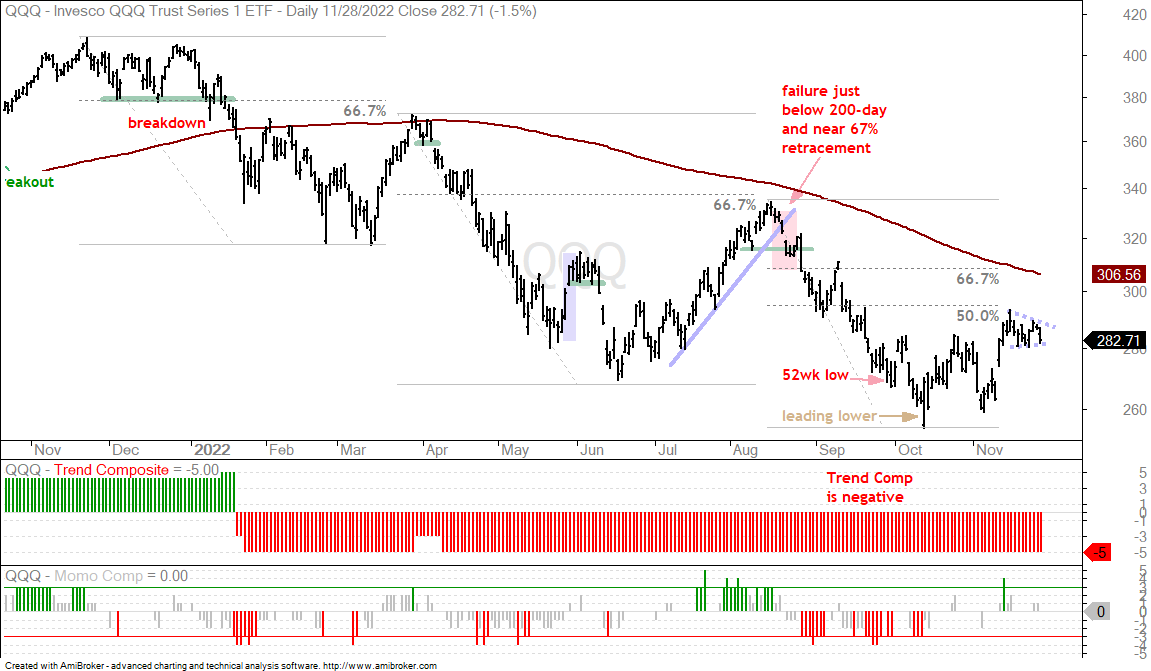
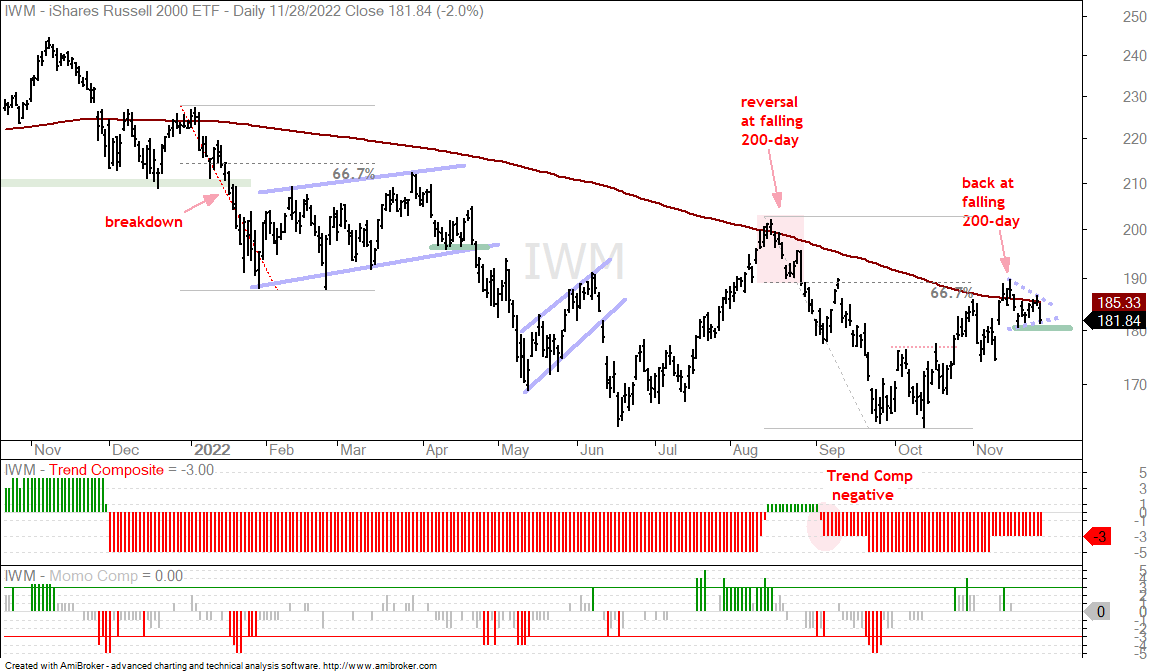
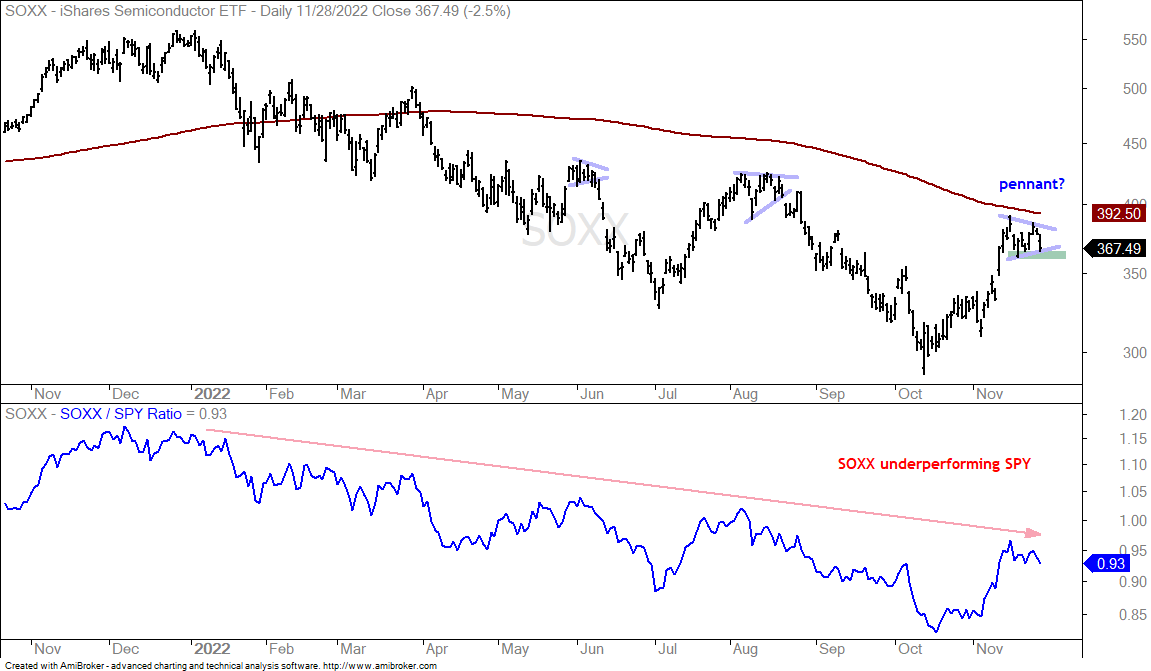
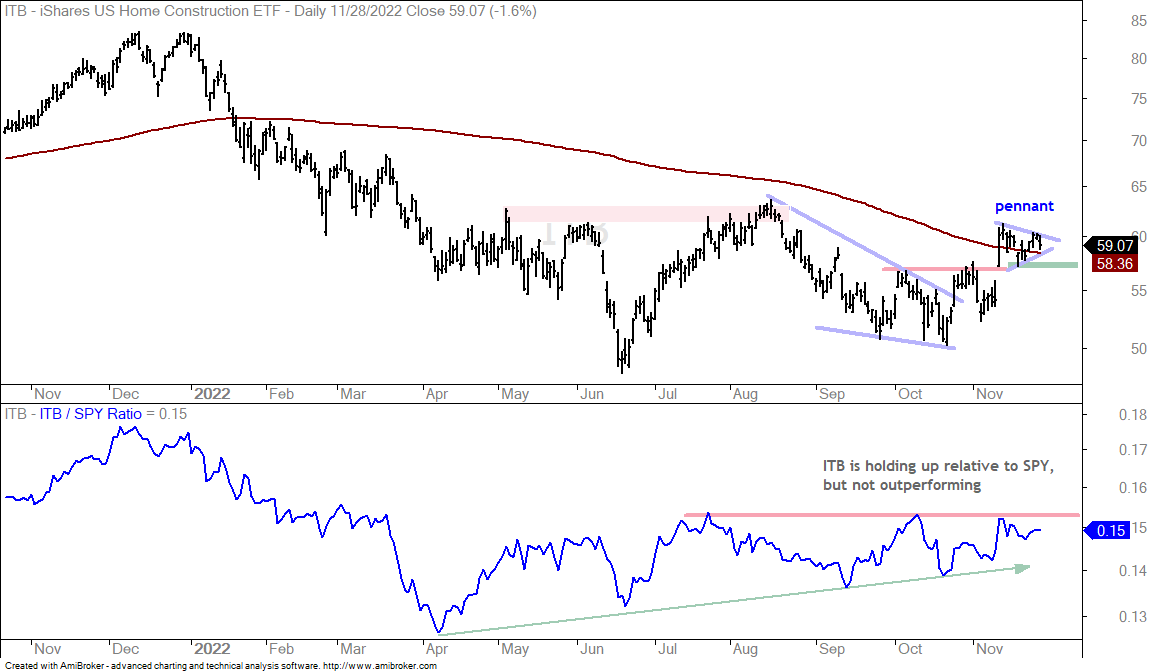
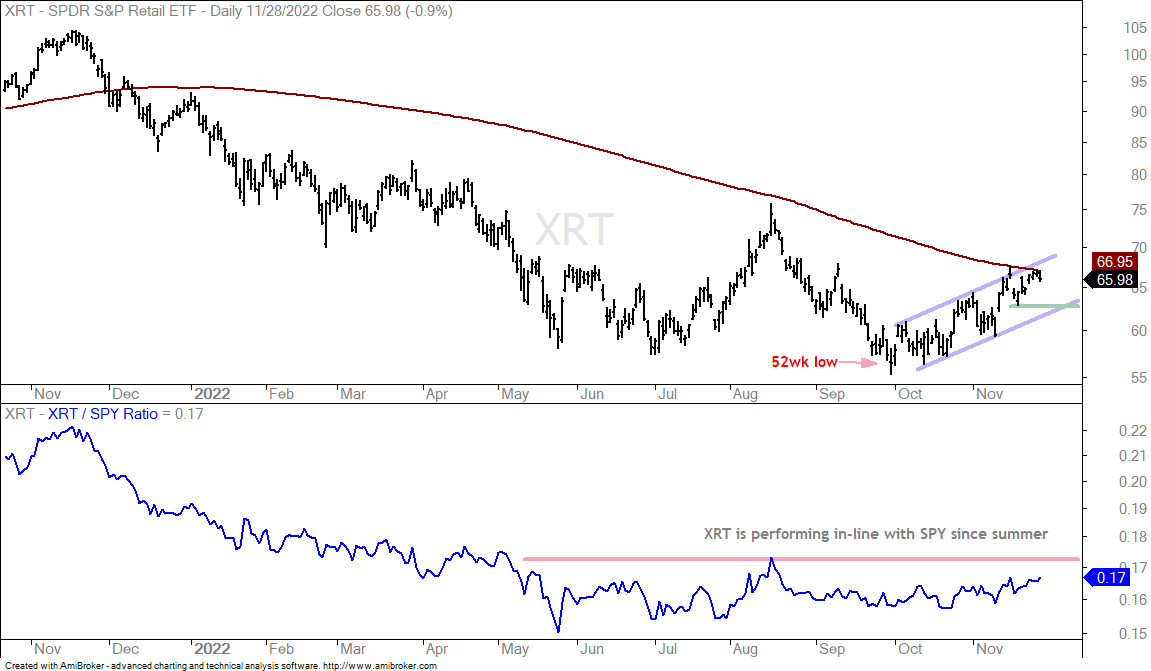
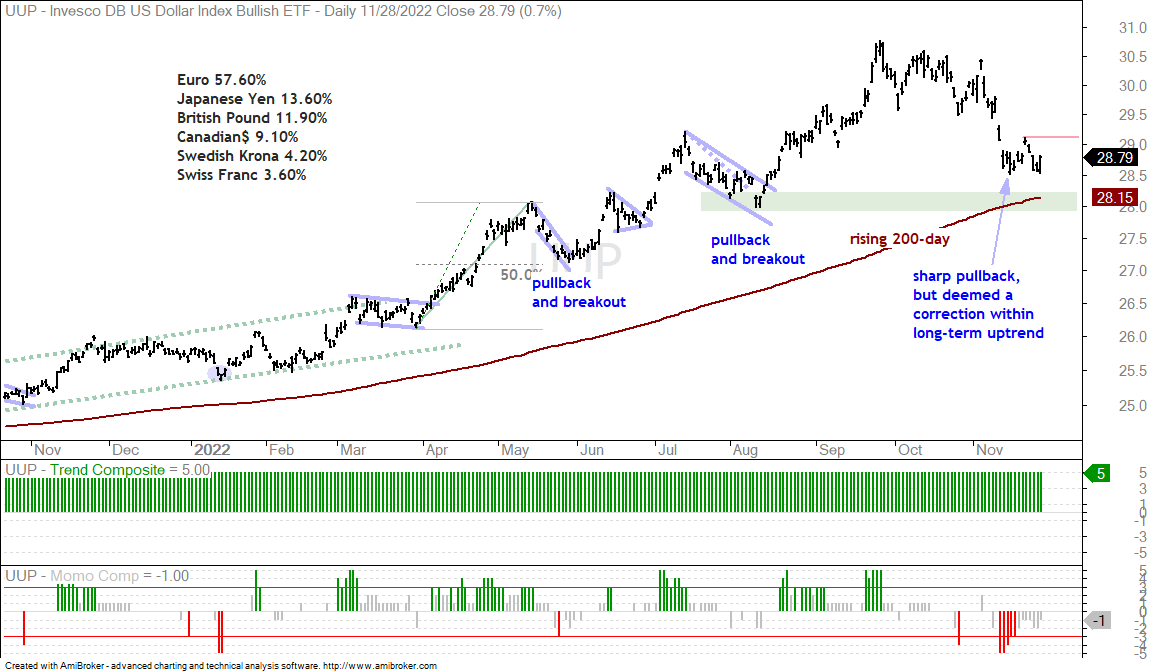
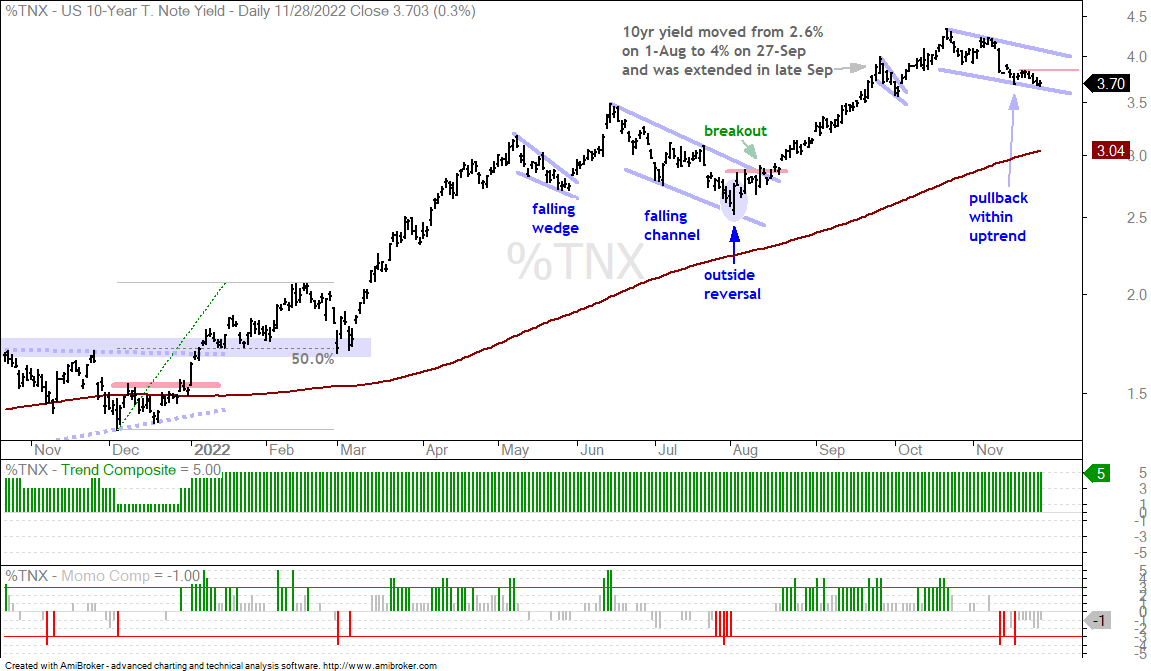
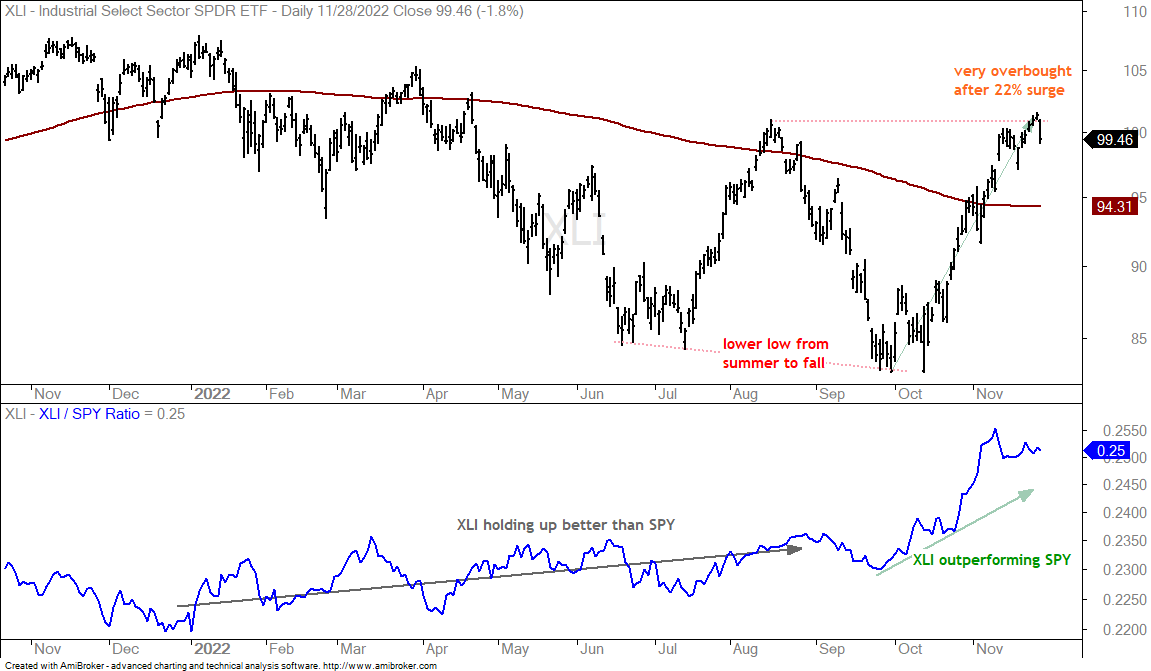
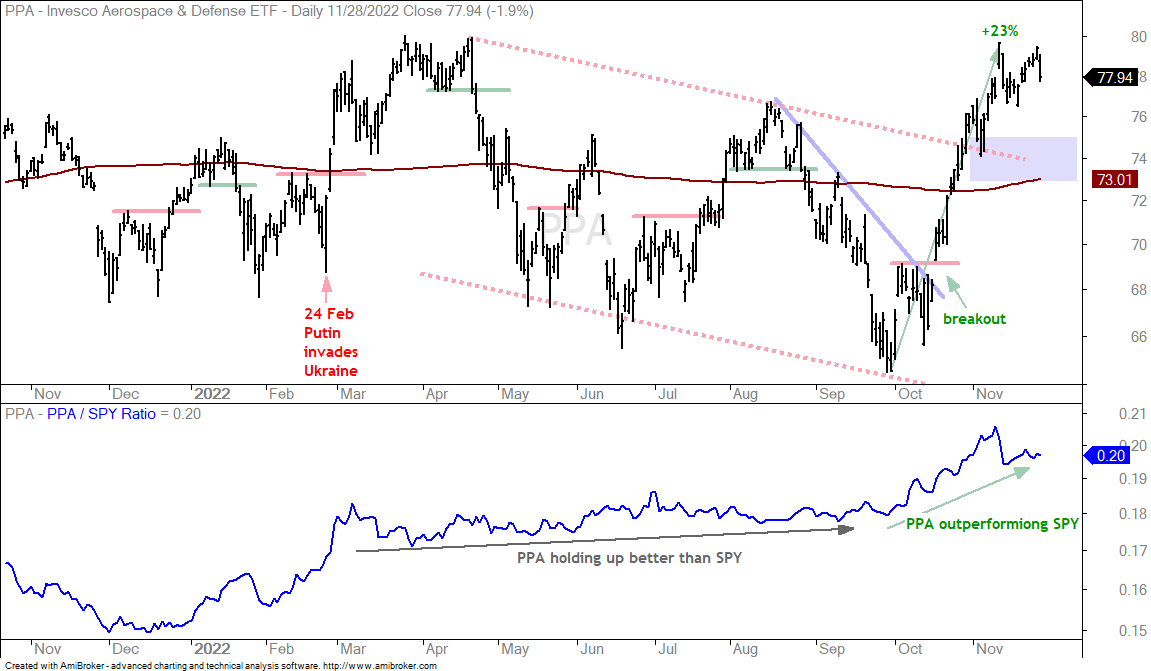
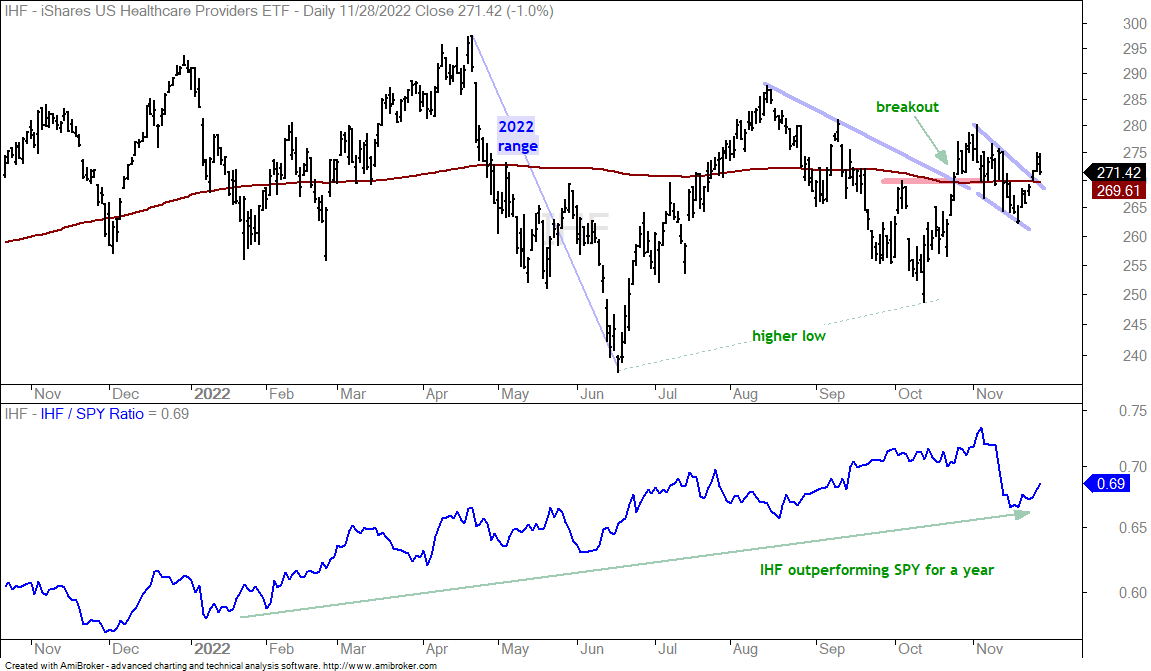
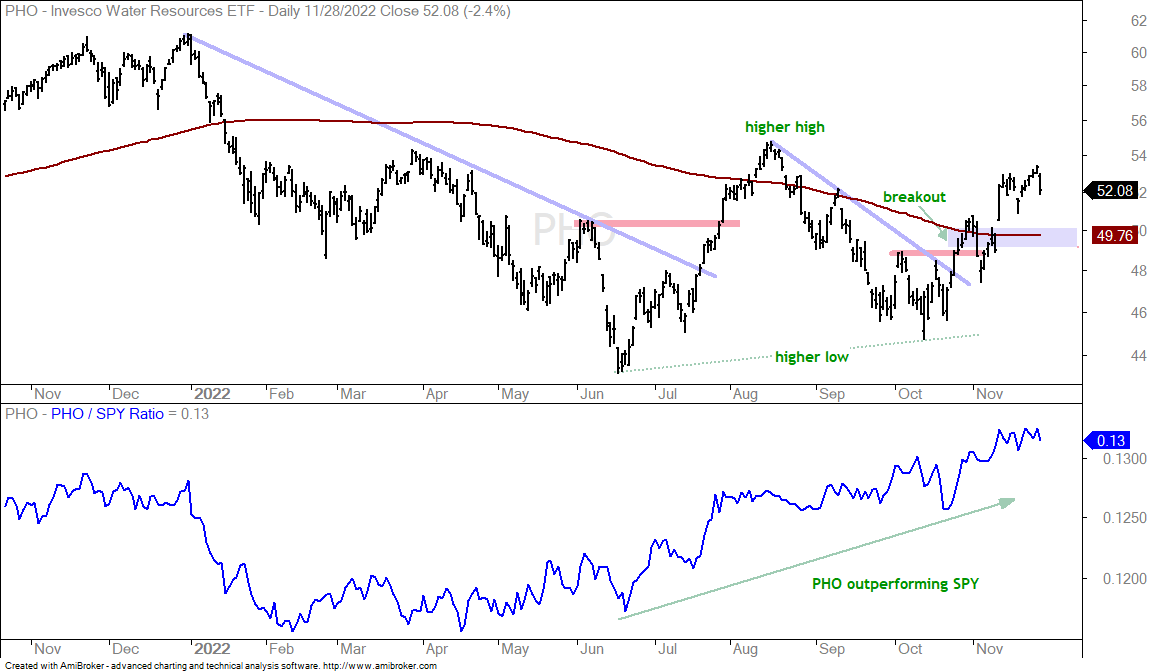
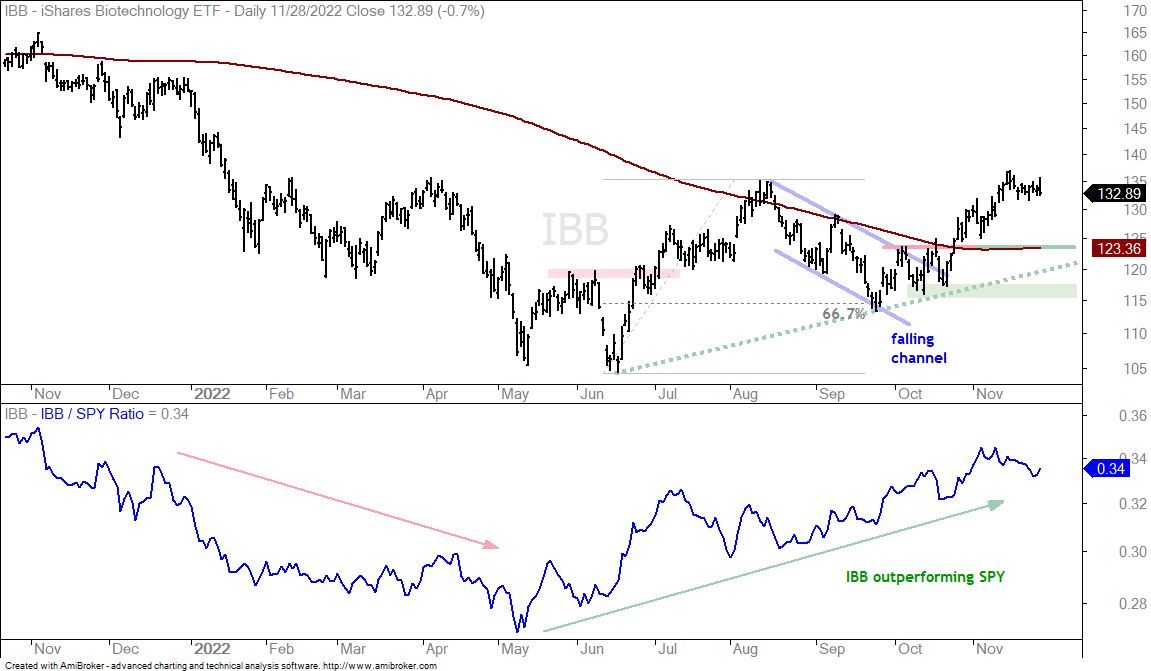
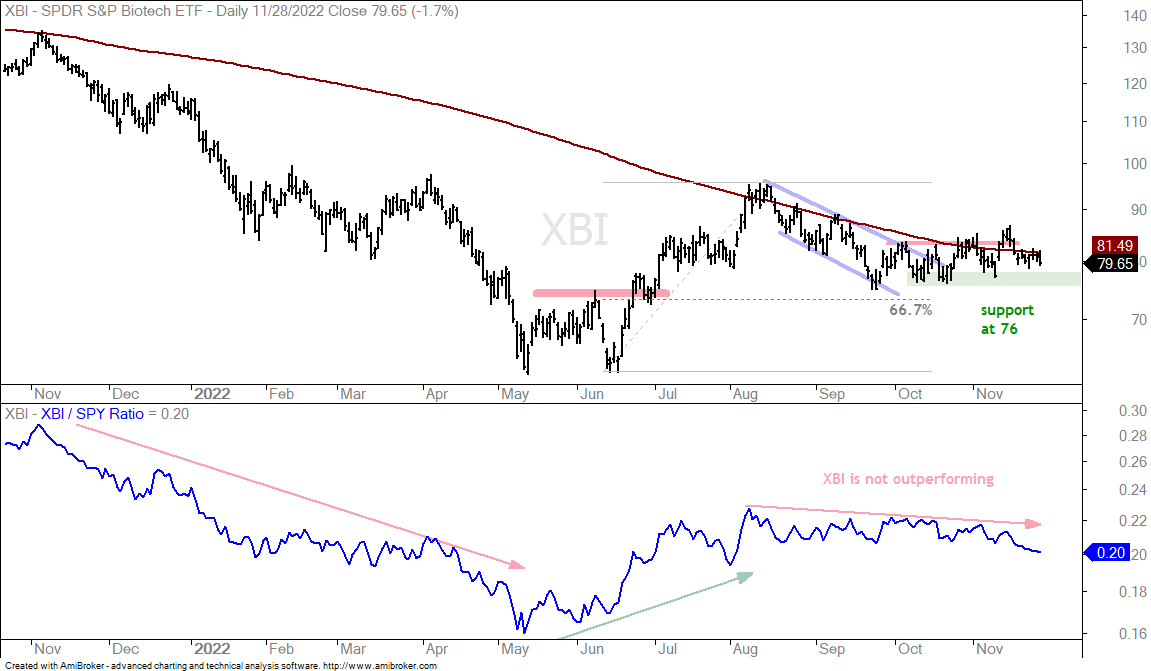
The battles for the 200-day remain in focus for several ETFs. The S&P 500 and some key industry group ETFs surged towards their falling 200-day SMAs. Follow through would trigger a breakout and potential long-term trend reversal, while failure to follow through and short-term reversals would keep the long-term downtrends alive. The macro picture is also interesting because the Dollar fell towards its rising 200-day and the 10-yr Treasury Yield is correcting within an uptrend. My focus remains on ETFs related to healthcare, aerospace & defense, energy and water. Most of these are defensive groups, which makes sense because the Composite Breadth Model remains bearish.

About the ETF Trends, Patterns and Setups Report

This report contains discretionary chart analysis based on my interpretation of the price charts. This is different from the fully systematic approach in the Trend Composite strategy series. In this ETF Trends, Patterns and Setups report, I am looking for leading uptrends and tradable setups within these uptrends. While I use indicators to help define the trend and identify oversold conditions within uptrends, the assessments are mostly based on price action and the price chart (higher highs, higher lows, patterns in play). Sometimes the chart assessment can be at odds with the indicators.

Composite Breadth Model Improves, but Remains Bearish

There were some improvements in the Composite Breadth Model as the Thrust Models triggered bullish over the last four trading days. This means two inputs are bullish and three are bearish for a CBM score of -1. The S&P 500 and S&P 1500 Trend Models are still bearish and the 5-day SMA for the S&P 500 remains below the 200-day SMA. One of these three inputs needs to turn bullish to turn the Composite Breadth Model positive.  

The Thrust Models also triggered bullish in mid August, but the other three inputs remained bearish, and so did the Composite Breadth Model. Thrust signals are one thing and trend signals are another. This is why we need to see follow through to thrust signals and some sort of trend signal to confirm the short-term thrust signals. There was also improvement with the S&P 500 Trend Model as the percentage of S&P 500 stocks above the 200-day SMA exceeded 60% for the first time since mid January.

You can learn more about my chart strategy in this article [1] covering the different timeframes, chart settings, StochClose, RSI and StochRSI.

SPX %Above 20-day SMA Remains Overbought

The next chart shows the S&P 500 SPDR (SPY) advancing some 13% from mid October to late November and almost touching its falling 200-day SMA. The long-term trend is still down on this chart and I consider this a counter-trend bounce. Also notice that the advance retraced around 2/3 of the prior decline with a rising wedge. The retracement amount and pattern are typical for counter-trend bounces, as is a failure near the falling 200-day SMA. The trend is up as long as the wedge rises and I am marking support at 390.

The next chart shows SPY with SPX %Above 20-day SMA and SPX %Above 50-day SMA indicators. %Above 20-day exceeded 80% and became overbought in mid October. It has remained overbought since because we have yet to see a move below 60%, which would end overbought conditions and show short-term deterioration. This is a classic case of becoming overbought and staying overbought. Keep in mind that this indicator was also overbought from mid July to mid August. The red arrow-lines show prior signals, which worked out pretty well. This is no guarantee for future success, but a break below 60% and a SPY break below 390 would reverse the short-term uptrend.

QQQ and IWM are Lagging

QQQ retraced around half of the August-October decline and formed a lower high from mid to late November. In contrast, SPY retraced 2/3 and formed a slightly higher high over the last two weeks. QQQ is still lagging and weighing on the broader market. There is, however, a short-term bullish alternative to consider. QQQ surged in early November and then consolidated with a possible pennant. A pennant breakout would argue for a pop towards the falling 200-day SMA.

The next chart shows IWM battling the falling 200-day SMA over the last 2-3 weeks. IWM also forged a lower high from mid November to late November and is underperforming SPY the last few weeks. A pennant is also possible here and a break above last week’s high would be short-term bullish.

Three Industry Group ETFs to Watch (SOXX, ITB, XRT)

The Semiconductor ETF (SOXX), Home Construction ETF (ITB) and Retail SPDR (XRT) are battling their 200-day SMAs after advances since October. These three represent key groups within the economy/market and upside follow through would be quite positive. Breakdowns could foreshadow a short-term trend reversal in SPY.

The first chart shows SOXX surging some 25% and then stalling with a potential pennant just below the falling 200-day SMA. I am calling this pennant potential because it has yet to be confirmed with an upside breakout. Notice that prior pennants failed after surges in late May and July. Technically, the long-term trend is still down and SOXX is underperforming SPY. This means the odds favor another failure. However, a pennant break and move above the 200-day would be quite positive for the tech sector and the market.

The next chart shows the Home Construction ETF (ITB) surging above the 200-day SMA in early November and then consolidating with a pennant. The breakout surge is holding and a follow through pennant breakout would be bullish. Failure to break out and a support break would be negative.

The next chart shows the Retail SPDR (XRT) hitting a new low in late September and then advancing to the falling 200-day SMA. The long-term trend is down and this is still considered a counter-trend bounce. A channel break would reverse the short-term uptrend and argue for a continuation of the bigger downtrend. The indicator window shows the XRT:SPY ratio flat-lining since summer as XRT performs in-line with SPY. A break above the August high would show relative strength and be positive.

You can learn more about exit strategies in this post [2],
which includes a video and charting options for everyone.

The Macro Movers (Dollar, Bonds, Gold)

There are some strong correlations at work right now and we should watch these relationships for clues on stocks. The Dollar and Yields are moving lower as the Euro, Bonds, Stocks and Metals move higher. We never know how long these correlations will hold or the strength of the relationships. For now, they exist and should be part of the game plan. The first chart shows the Dollar Bullish ETF (UUP) falling back towards its rising 200-day SMA. The long-term trend is up and I consider this a correction within a bigger uptrend. UUP firmed in the 28.5 area the last two weeks and an upside breakout would be short-term bullish.

The Dollar fell in reaction to the rise in the 20+ Yr Treasury Bond ETF (TLT) and fall in the 10-yr Treasury Yield. The next chart shows TLT with a downside acceleration (selling climax) in to mid October and reversal (yellow shading). TLT is up around 12% since mid October and the bounce retraced less than half of the prior decline. I consider this a counter-trend bounce (bear market bounce).

The next chart shows the 10-yr Treasury Yield falling back below 4% and correcting within a bigger uptrend. Yields fell sharply the November 10th with a better-than-expected inflation report. Brace yourself because another report is coming in early December! I will not speculate on inflation, but the decline in the 10yr looks like a correction within an uptrend and the mid November highs mark the first level to watch (red line). A breakout here would provide the first sign that yields are turning back up. This could lead to a downturn in TLT and upturn in UUP.  

The Gold SPDR (GLD) surged in early November and broke above its early October high, and out of a falling channel. This surge-breakout occurred with Dollar weakness and the Dollar could hold the key going forward. Long-term, I am not ready to call for an uptrend because GLD is still below the falling 200-day SMA and the Trend Composite remains negative. Short-term, GLD fell back to the breakout zone, which turns first support, and formed a falling flag of sorts. The ETF broke out with a surge last week and then fell back on Monday. There is still a short-term breakout in the making with support marked at 161. A break here would be negative, as would an upside breakout in the Dollar.

The Trend Composite aggregates signals in five trend indicators: Bollinger Bands (125,1), Keltner Channels (125,2), 5-day Rate-of-Change of 125-day SMA, StochClose (125,5) and CCI-Close (125). The Trend Composite and ten other indicators are part of the TIP Indicator Edge Plugin for StockCharts ACP [3]

ETFs Above 200-day and Leading, but No Setup (IGN, XLV, XLE)

ETFs are clearly leading if they meet three requirements: First, they formed higher lows from June to September. Second, they exceeded their summer highs. Third, they broke above their 200-day SMAs. ETFs with these three characteristics include: XLV, XLE, IGN, KIE, IBB, XES, XOP and FCG. There are not that many. The Networking ETF (IGN) is the only tech-related ETF in this group because the others formed lower lows from summer to fall. Tech remains a laggard overall.

The next chart shows the Healthcare SPDR (XLV) surging some 13% from September to November and breaking out in late October. The ETF is in a large trading range over the past year, but in the upper half of this range and the cup is half full (bullish). Should XLV pull back, the breakout zone and 200-day SMA mark first support to watch for a bounce.

The Energy SPDR (XLE) is the only sector to record a new high in November, which makes it the clear leader. The ETF surged some 38% in route to this new high and became overbought. XLE stalled the last few weeks and this stall could be a flag, which is a short-term bullish continuation pattern. A breakout at 95 would signal a continuation higher. I am more inclined, however, to wait for a decent pullback to alleviate short-term overbought conditions. Should we see a pull back, the breakout zone and 50% retracement mark the first support level to watch. The Oil & Gas Exploration & Production ETF (XOP) and Natural Gas ETF (FCG) have similar charts.

You can learn more about exit strategies in this post [2],
which includes a video and charting options for everyone.

Industrials and Finance Get Extended

The Industrials SPDR (XLI) and the Finance SPDR (XLF) are above their 200-day SMAs and both exceeded their August highs, but they formed lower lows from summer to fall. Thus, they only have two of the three leading characteristics. The charts below show XLF and XLI surging over 20% and becoming short-term overbought in late November. They are leading, but there is no setup on the chart and I would wait for a tradable pullback, such as a falling flag or wedge that retraces around half of the prior advance. Note that XLK, XLY and XLC are still below their 200-day SMAs and lagging.

Leading, but Less So (PPA, IHF, PHO)

The Aerospace & Defense ETF (PPA), Healthcare Providers ETF (IHF) and Water Resources ETF (PHO) are leading, but also have just two of the three leading characteristics. The first chart shows PPA breaking out in mid October and surging some 23%. There was a shallow pullback into mid November and another pop toward 80. Again, I do not see a setup on this chart because PPA is quite extended short-term and ripe for a rest. Should PPA pull back, I would watch the 73-75 area for support and a short-term bullish setup (blue shading).

The next chart shows the Healthcare Providers ETF (IHF) with a breakout in late October and a falling wedge pullback into November. IHF broke out of this wedge with a surge last week and also moved back above the 200-day. Overall, IHF is flat as a pancake, but the price-relative (IHF:SPY ratio) is in an uptrend because the ETF is holding up better than SPY. This is a defensive ETF that would likely lag should SPY break its 200-day SMA and turn bullish.

The next chart shows the Water Resources ETF (PHO) with a higher low from summer to fall and a breakout in late October. PHO did not come close to its August high, but broke the 200-day and is outperforming. Should we see a pull back, the breakout zone and the 200-day SMA mark first support to watch.

IBB Holds Strong as XBI Struggles

The Biotech ETF (IBB) is in a leading uptrend and without a setup working right now, The ETF surged from June to August, corrected into September with a falling channel and broke out in October. IBB extended after the breakout and is trading above its 200-day SMA. Should we see a pullback, the breakout zone and 200-day mark the first level to watch for support. The October lows mark key support going forward. The indicator window shows the IBB:SPY ratio rising as IBB outperforms SPY.

The next chart shows the Biotech SPDR (XBI) struggling since October as it trades around 80. The ETF attempted breakouts in late October and mid November, but these failed to hold as XBI fell back into its range. Relative weakness is a concern here and a break below 76 would be bearish.  

I will cover commoditiy and the commodity-related ETFs on Thursday.

You can learn more about my chart strategy in this article [1] covering the different timeframes, chart settings, StochClose, RSI and StochRSI.

Thanks for tuning in and have a great day!