- trendinvestorpro.com - https://trendinvestorpro.com -

Market and ETF Report – Pullbacks Materialize for Market Leaders, Defensive ETFs Remain with Corrective Patterns (Premium)

The stock market moved from a defensive and risk-off bias in 2022 to an offensive and risk-on bias in 2023. Tech, high-beta and consumer discretionary ETFs are leading in 2023 with some of the biggest moves year-to-date. Many became overbought in early February and then pulled back. Some ETFs held up better and simply consolidated. There are lots of pennants, falling flags and falling wedge patterns on the charts now and I am watching these for short-term breakouts that would signal a continuation higher. Even though the defensive and risk-off ETFs are lagging this year, they remain on my radar because their pullbacks in 2023 looks like corrections after big advances into yearend.
About the ETF Trends, Patterns and Setups Report

This report contains discretionary chart analysis based on my interpretation of the price charts. This is different from the fully systematic approach in the Trend Composite strategy series. In this ETF Trends, Patterns and Setups report, I am looking for leading uptrends and tradable setups within these uptrends. While I use indicators to help define the trend and identify oversold conditions within uptrends, the assessments are mostly based on price action and the price chart (higher highs, higher lows, patterns in play). Sometimes the chart assessment can be at odds with the indicators.

Report Schedule

  • Tuesday – 14 Feb: Market/ETF Report
  • Wednesday – 15 Feb: Market/ETF Video
  • Thursday – 16 Feb: Updates for the Systematic Strategies

The Trend is for Systematic

I am working on signal tables and a page to track performance for three strategies currently running at TrendInvestorPro (see list below). I also plan on creating a single page to track the recent signals for easier tracking. These should be up and running by the end of the month. You can find the current signal tables on the main analysis page and here are links to the strategy articles.

Market Regime is Bullish for Stocks

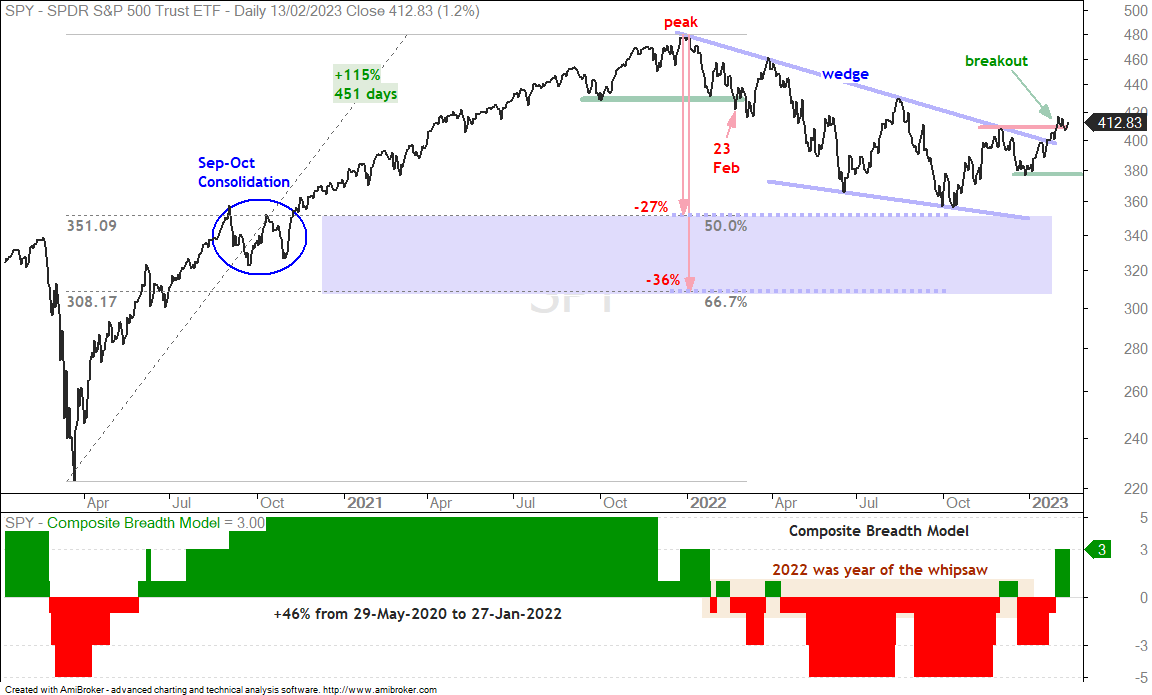
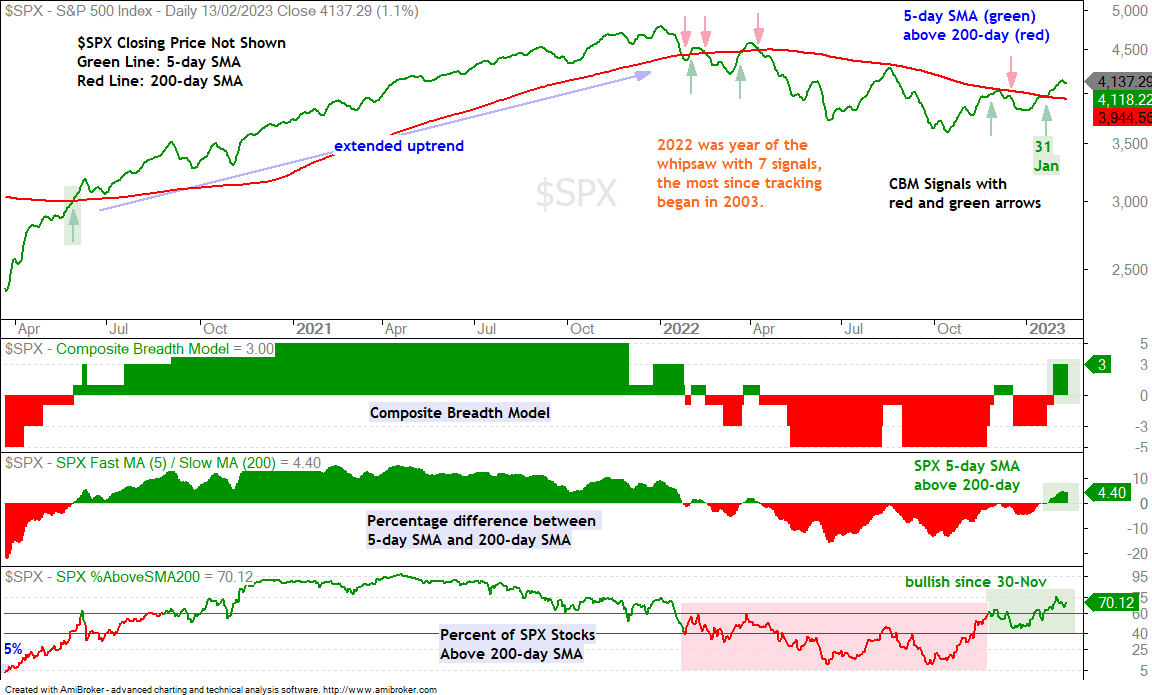
The Composite Breadth Model turned positive with a move to +3 on January 31st and the weight of the evidence is bullish for stocks. The 5-day SMA for the S&P 500 is above the 200-day SMA and around 70% of S&P 500 stocks are above their 200-day SMAs. This is the highest percentage since January 2022.

SPY with Higher High and Uptrend

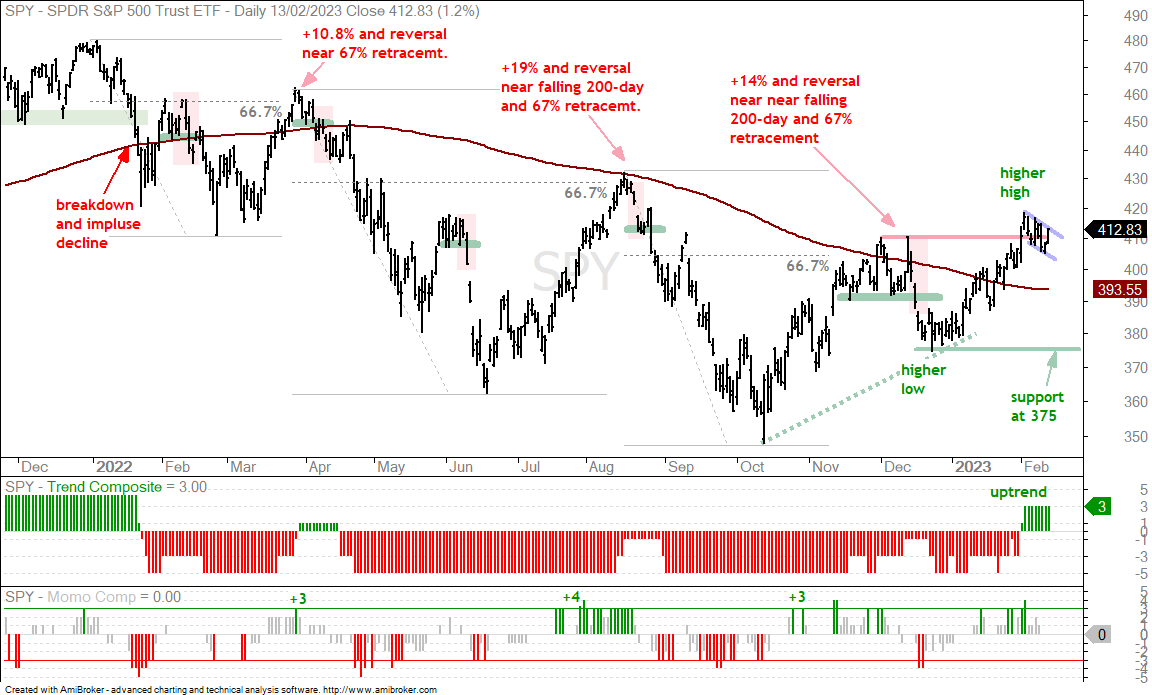
The first chart shows the S&P 500 SPDR (SPY) with a higher low in December and a higher high in early February. SPY is above the 200-day SMA and the Trend Composite turned positive on February 1st. The evidence on this chart points to an uptrend for the most important benchmark for US stocks. Short-term, SPY fell back the last two weeks and formed a falling flag, which, in classical technical analysis terms, is a bullish continuation pattern. It represents a pullback after an advance and an upside breakout would signal a continuation higher.

QQQ Holds Double Bottom Breakout               

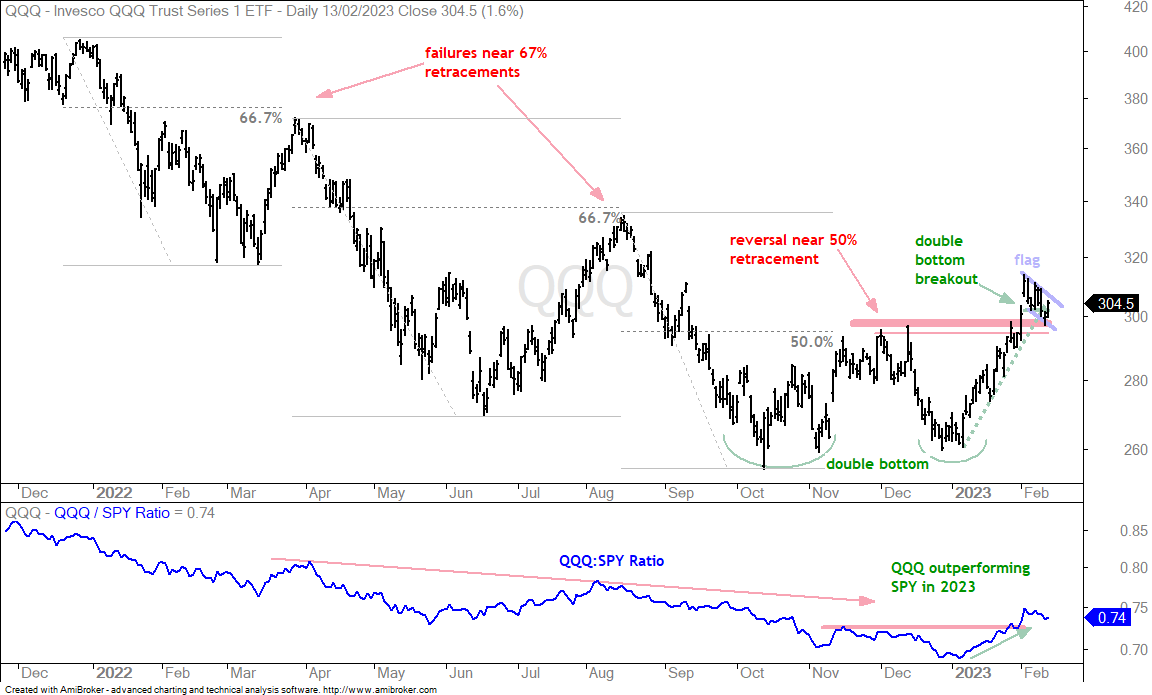
The Nasdaq 100 ETF (QQQ) has a double bottom breakout working with two lows in the 260 area and a break above the intermittent high. Short-term, the ETF surged from 260 to 310 and then fell back the last two weeks. QQQ broke short-term support with a sharp decline last Thursday-Friday. See the green dashed trendline extending up from the early January low. The short-term support break reverses the short-term uptrend and argues for a pull back. The ETF was overbought near 310 and ripe for a pullback or consolidation. A falling flag is taking shape with the blue lines defining this pullback. A flag breakout would end the pullback and signal a continuation higher.

Tech, Software and Cybersecurity Hold Upswing Support

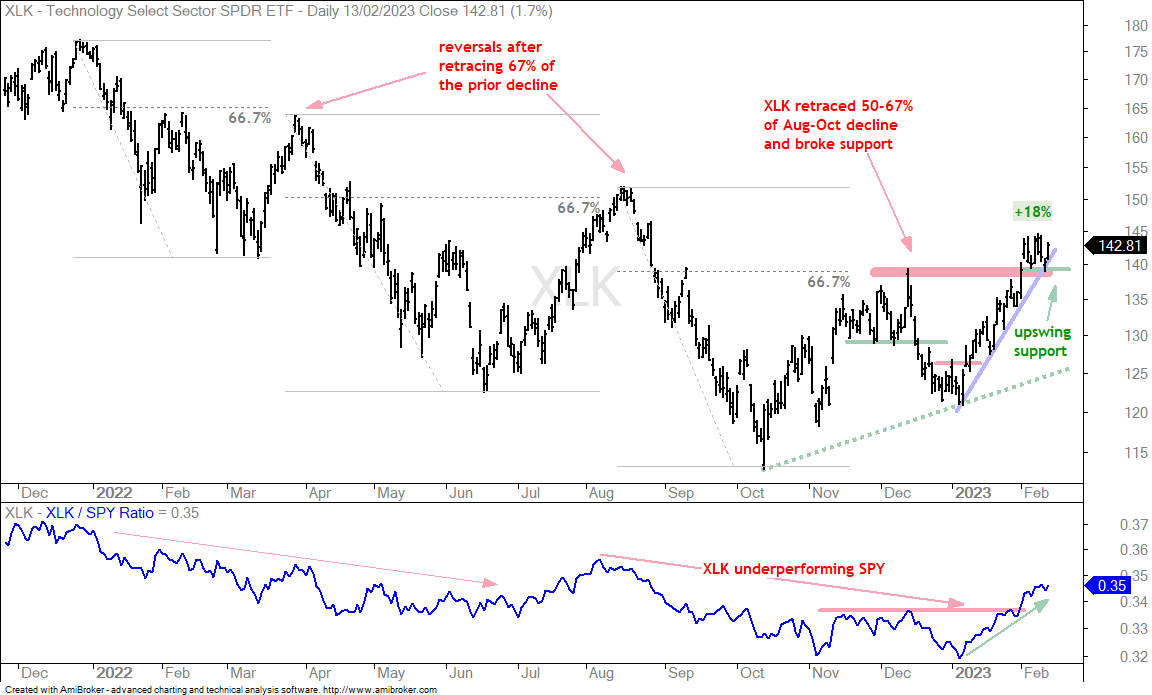
Before looking at some other tech-based ETFs, let’s look at the Technology SPDR (XLK), which is holding short-term support and slightly stronger than QQQ. As with SPY, XLK formed a higher low and a higher high over the last few months and is in an uptrend. The ETF surged some 18% into early February and became short-term overbought. XLK then consolidated above the breakout level (red line) and did not break short-term support. Thus, the short-term uptrend remains intact with support marked at 139. A break here would reverse the short-term uptrend and argue for a pullback.

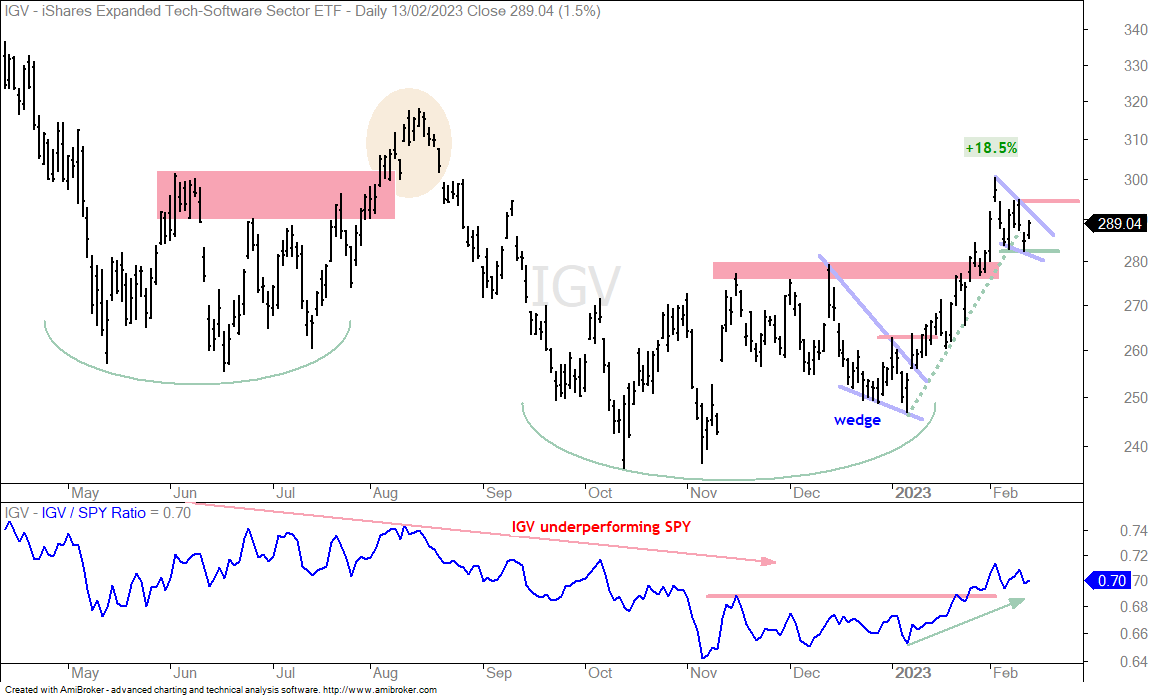
The Software ETF (IGV) is holding up relatively well in February because it did not break short-term support. A break below 282 would reverse the short-term uptrend and argue for a deeper pullback. For now, the ETF surged some 18% and formed a pennant consolidation with resistance marked at 294.50, a break of which would be bullish.

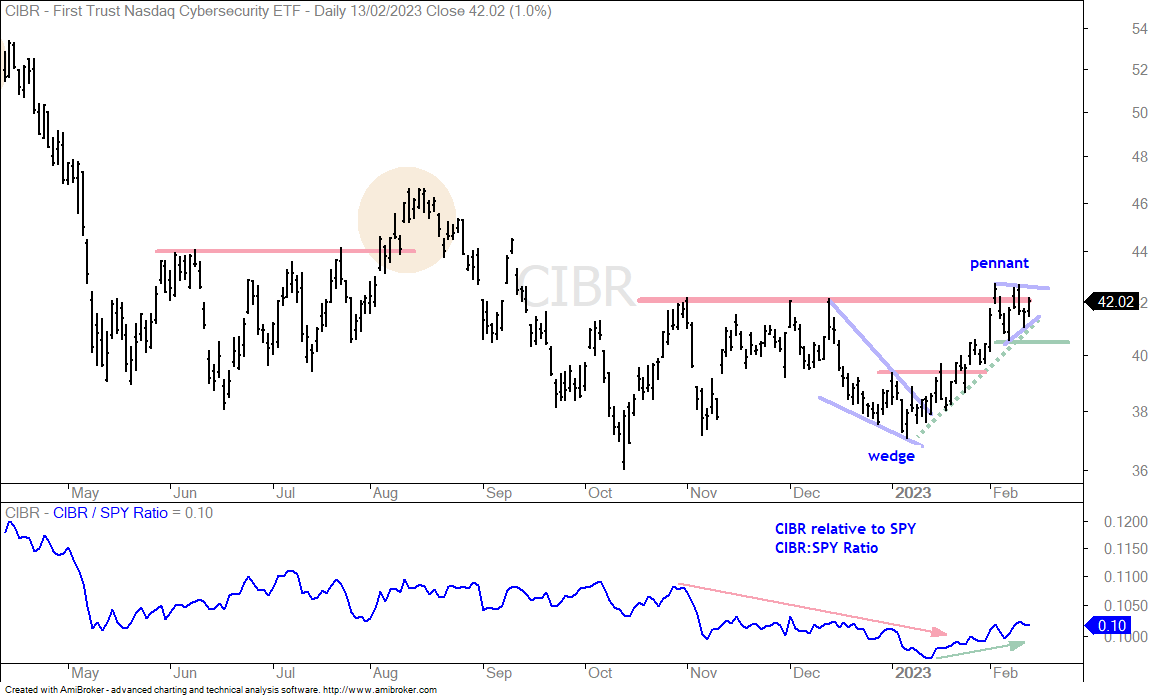
The next chart shows the Cybersecurity ETF (CIBR) with one of the stronger short-term charts. The ETF surged with the rest of the tech group in January and then consolidated in February. The ETF did not test the early February low (support at 40.50) and held up better than many other tech based ETFs. A pennant formed and a breakout would signal a continuation higher.

Short-term Support Break or Normal Pullback

(SOXX, SKYY, FDN, FINX, IPAY, DRIV)

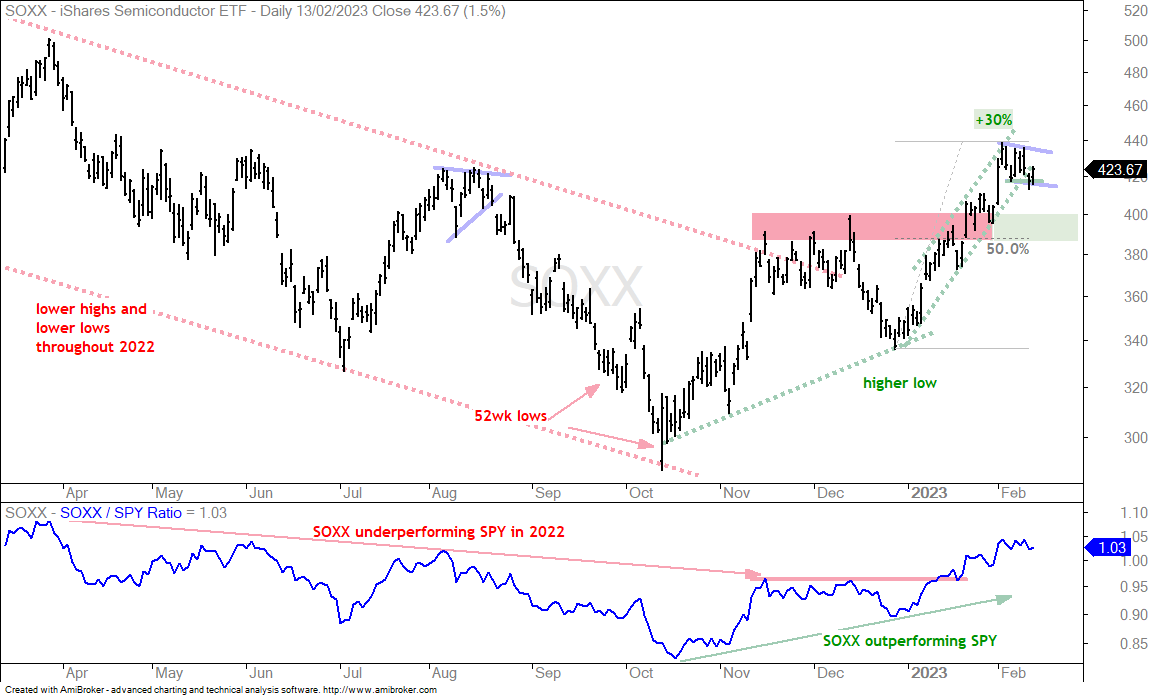
Some tech-based ETFs broke short-term support with deeper pullbacks over the last two weeks. Some barely broke support and then bounced on Monday (SOXX). Some clearly broke support and then bounced on Monday (FDN). Note that none of them became short-term oversold on these pullbacks, which suggest that the pullbacks are relatively shallow. The first chart shows the Semiconductor ETF (SOXX) with a surge above the December high and a small falling flag the last two weeks. Technically, this is a short-term consolidation within an uptrend and a bullish continuation pattern. Technically, a flag breakout above last week’s high would signal a continuation higher.

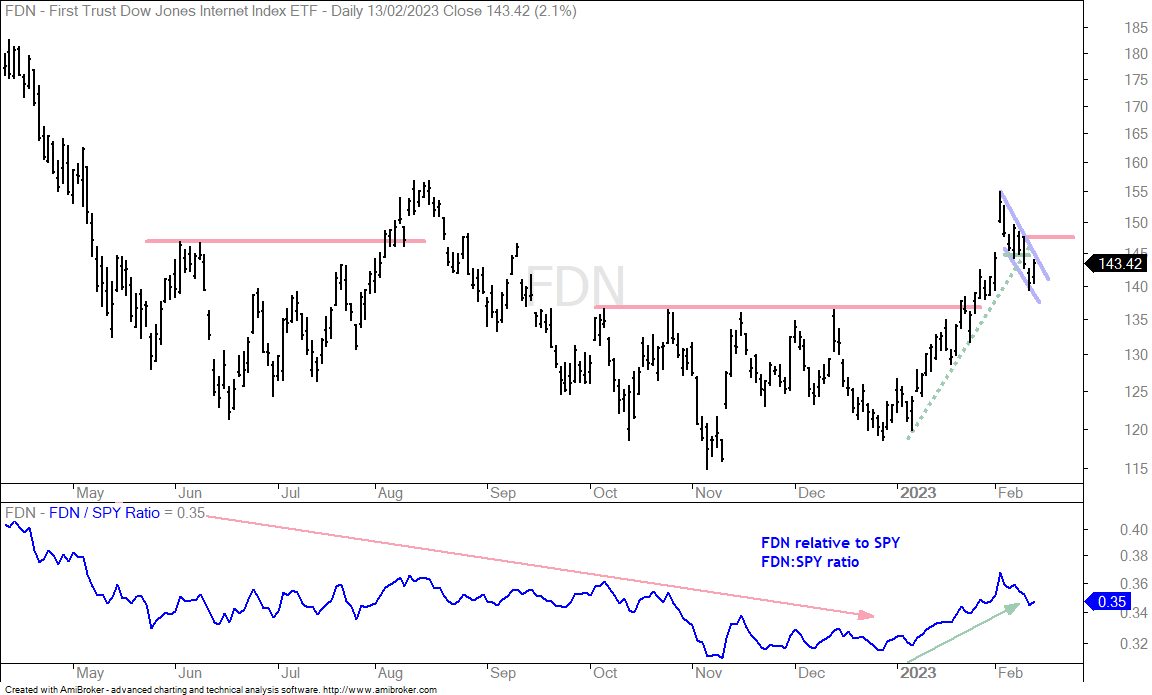
The next chart shows the Internet ETF (FDN) with a deeper pullback and a steeper falling flag. A move above 147.5 would break wedge resistance and signal a resumption higher.

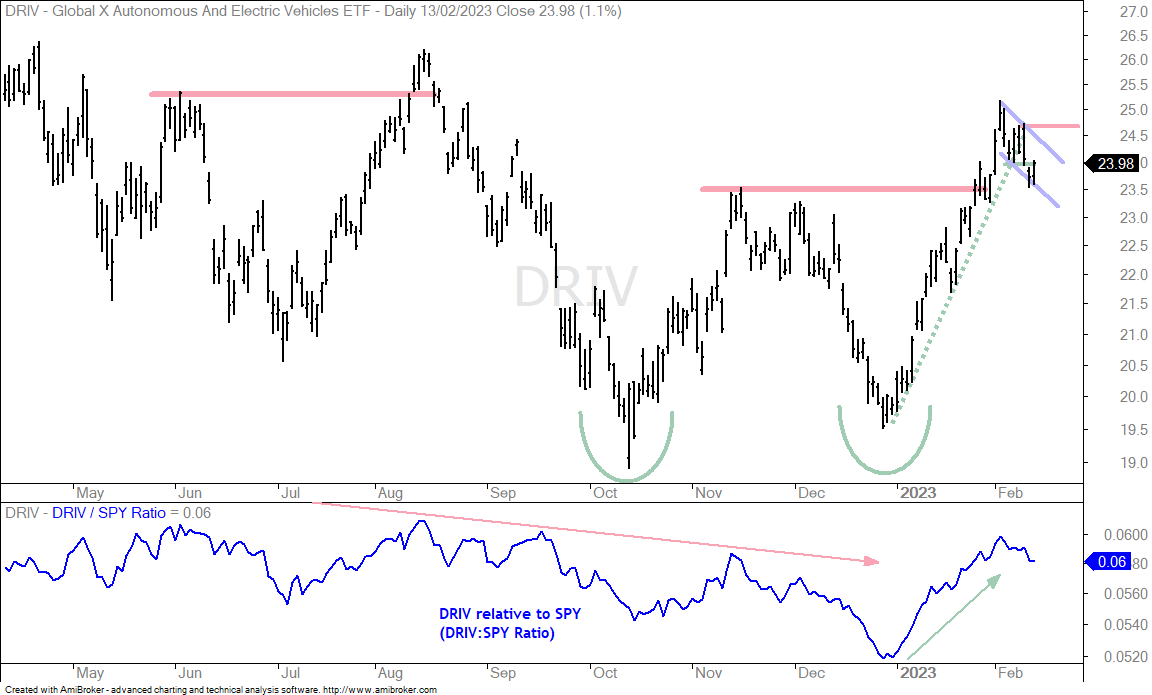
The next chart shows the Autonomous EV ETF (DRIV) with a falling flag and resistance marked at 24.70.

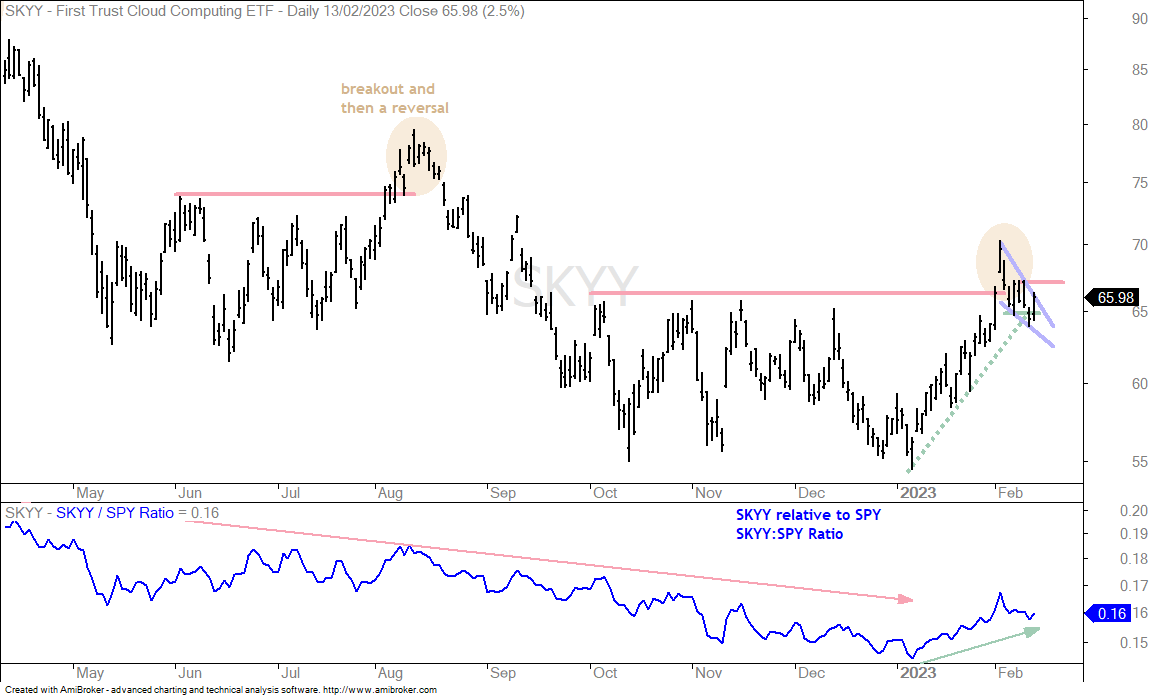
The next chart shows the Cloud Computing ETF (SKYY) with a falling wedge and short-term resistance marked at 67.

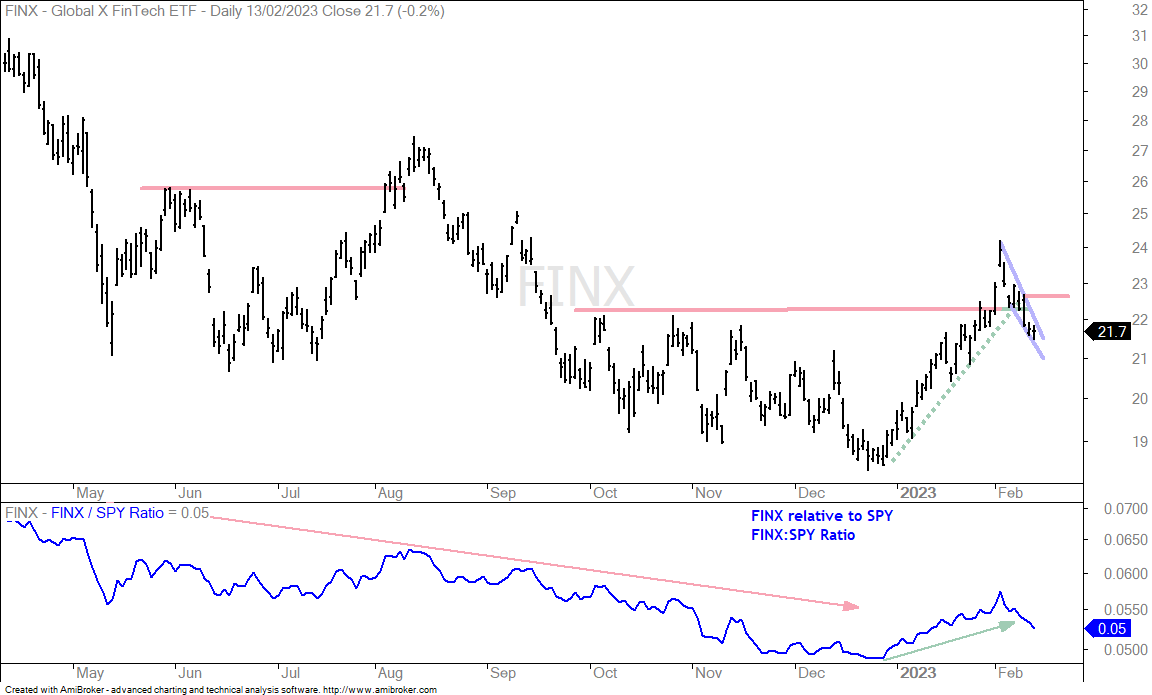
The next chart shows the FinTech ETF (FINX) with a falling wedge and resistance marked at 22.60. Notice that FINX fell .2% on Monday and did not bounce with the rest of the market.  

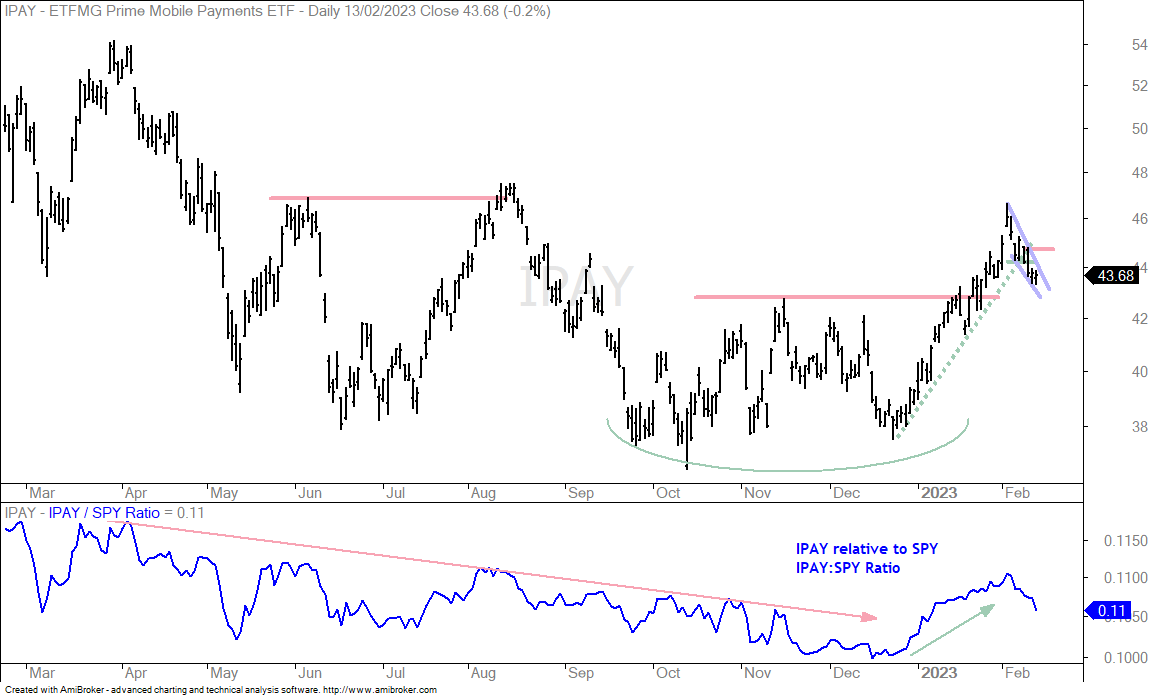
The next chart shows the Mobile Payments ETF (IPAY) with a falling wedge and resistance marked at 44.80. IPAY did not bounce on Monday either.  

Leaders with New Highs (KIE, PPA, XES, PHO, ITB)

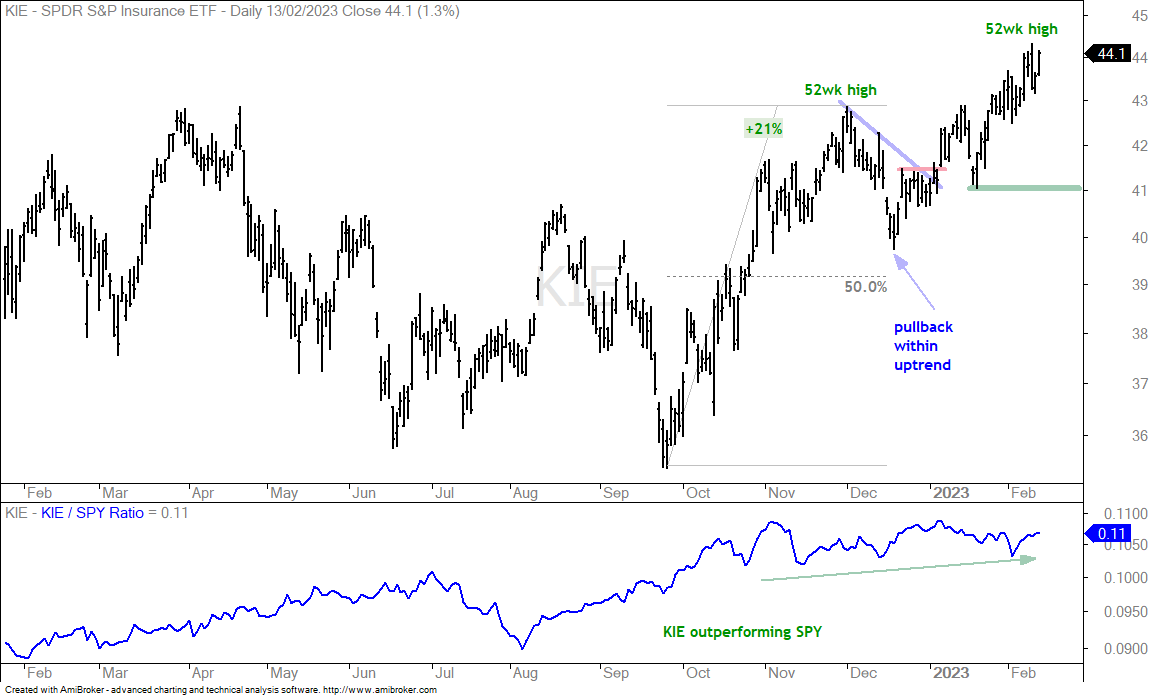
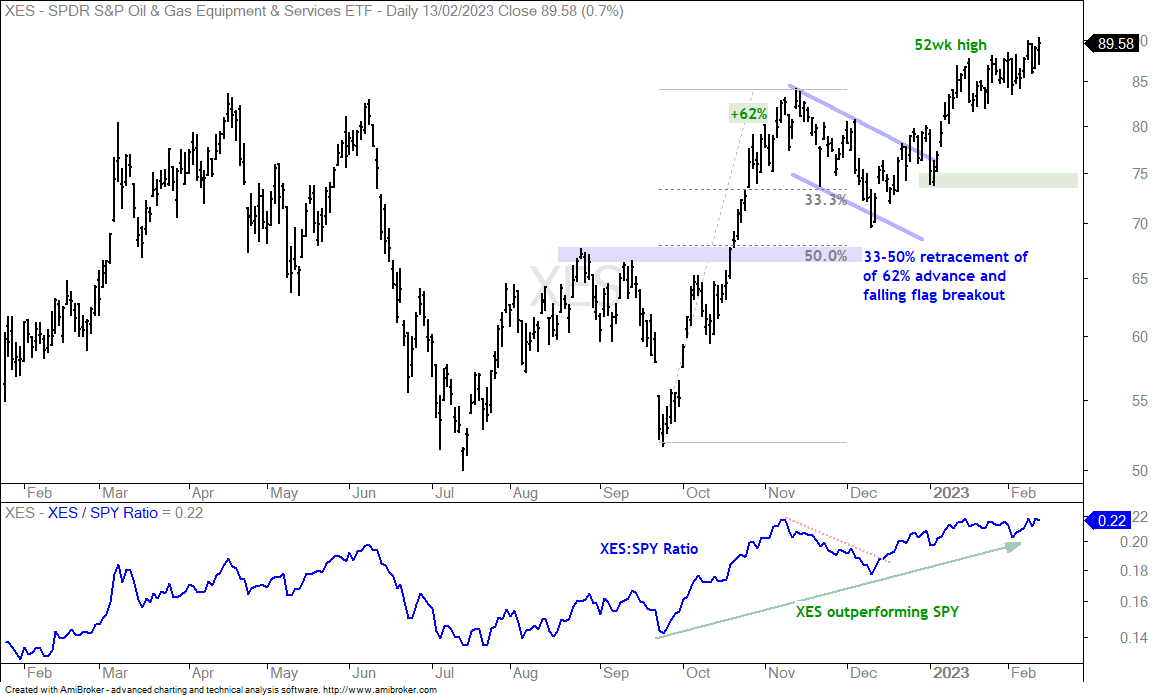
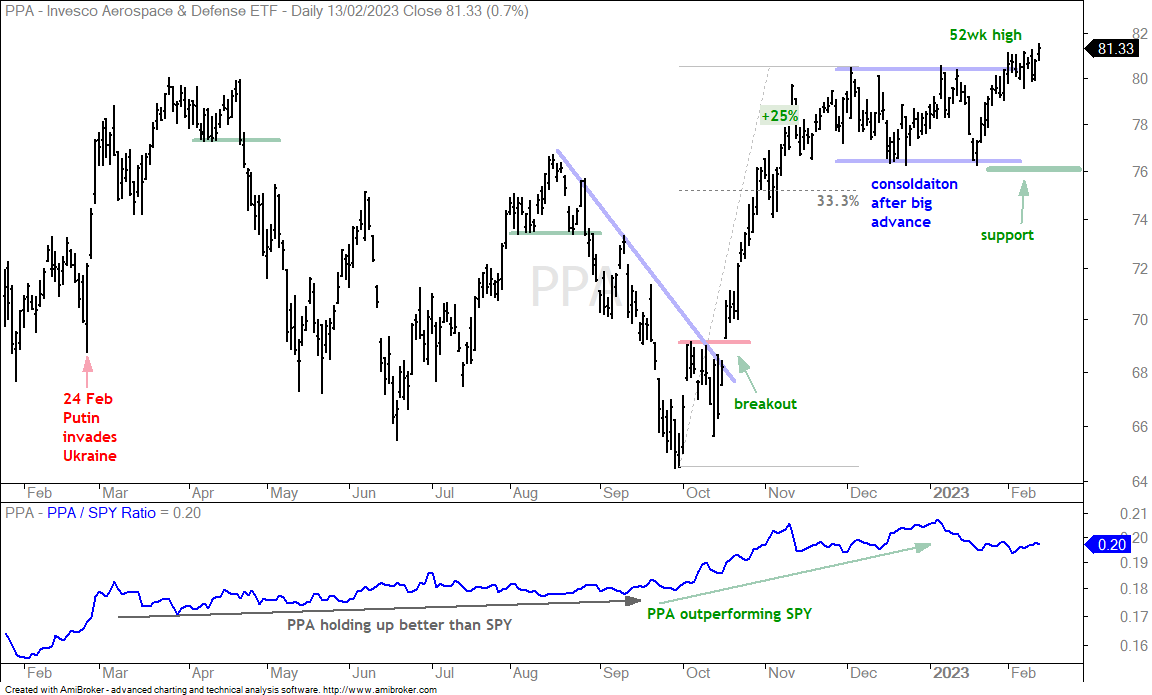
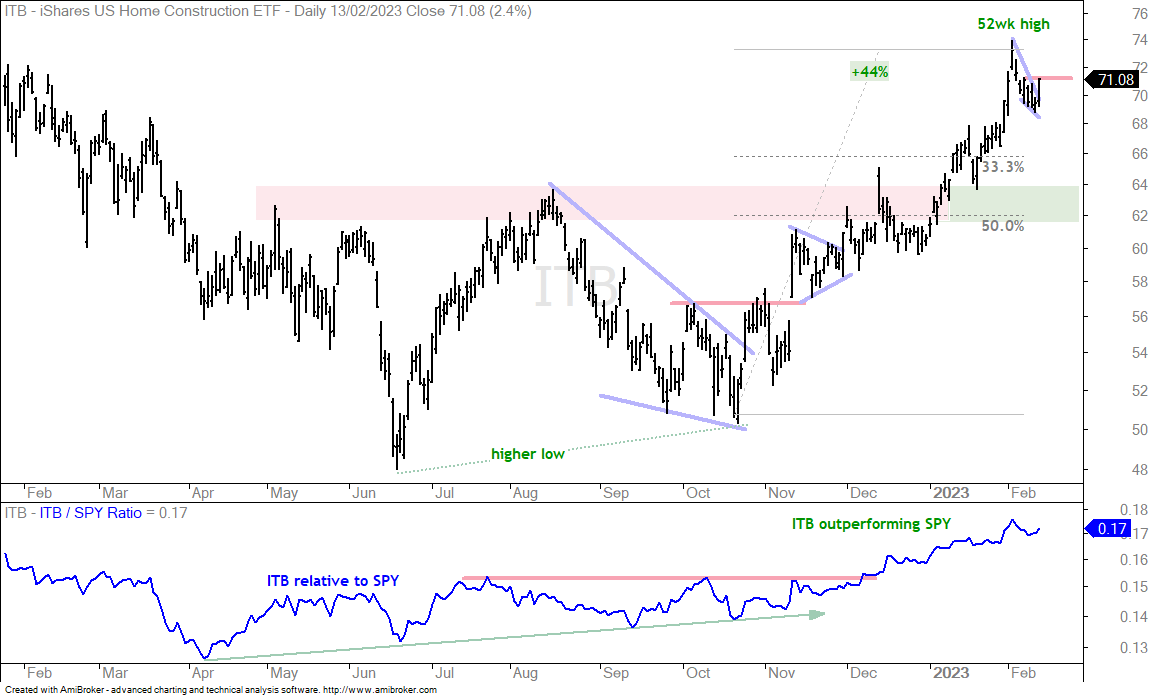
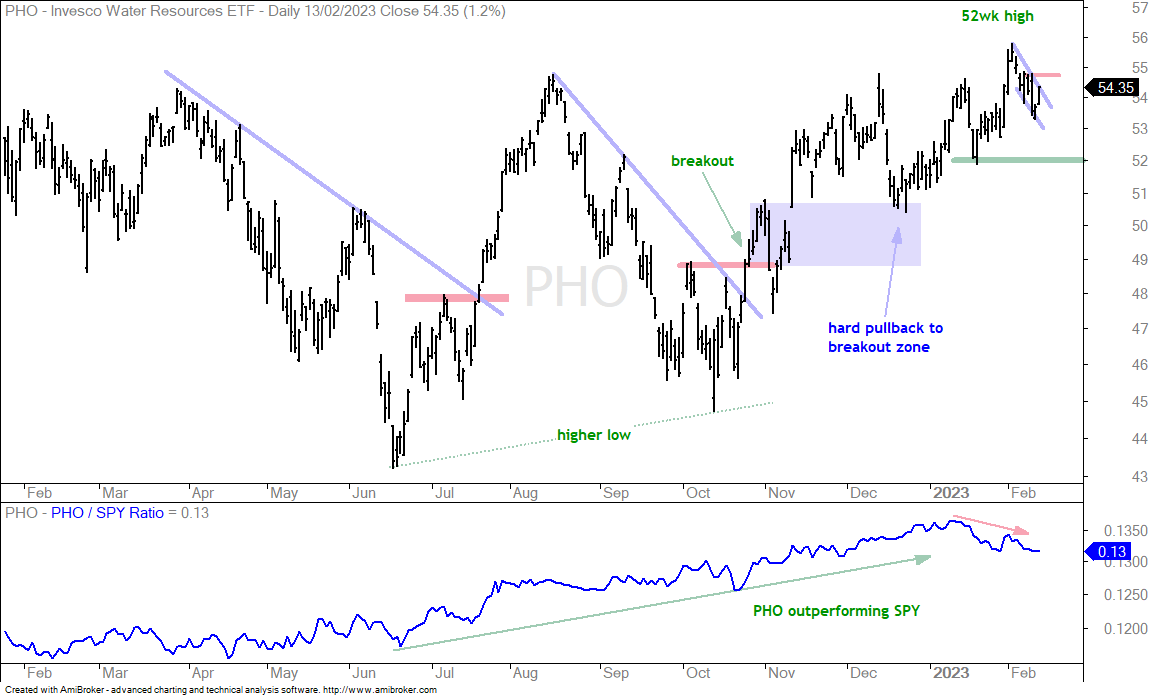
The tech-related are leading here in 2023 (29 trading days), but they are all down over the last 12 months and the Semiconductor ETF (SOXX) is the only one that is positive over the last six months. The long-term leaders are ETFs that hit 52-week highs in February (KIE, PPA, XES, PHO, ITB). Some of these ETFs are underperforming here in 2023, but they are positive over the last 12 months and clearly in leading uptrends. The first chart shows the Insurance ETF (KIE) with a 52wk high in December, a pullback into yearend, a breakout in early January and an extension to new highs in February. There is no setup on this chart, just a leading uptrend.

The next chart shows the Oil & Gas Equipment & Services ETF (XES) with a pattern similar to KIE. XES surged into November, corrected into December, broke out in late December and hit new highs the last few weeks.

The next chart shows the Aerospace & Defense ETF (PPA) with a  25% surge and new high in early December. The ETF consolidated into January and broke out with a surge into early February.

The next chart shows the Home Construction ETF (ITB) surging 44% with a move that tagged 74 in early February. The ETF fell back the last week or so with a falling wedge and popped again on Monday. A breakout at 71.5 would be short-term bullish. I would be careful here because ITB is still very extended and ripe for a deeper pullback or longer consolidation.

The next chart shows the Water Resources ETF (PHO) with a breakout surge in late October, a hard pullback in December and a trend resumption here in 2023. PHO hit a 52-week high in early February and then fell back with a falling flag. Flag resistance is set at 54.80.

Biotech ETFs Pull Back within Uptrends

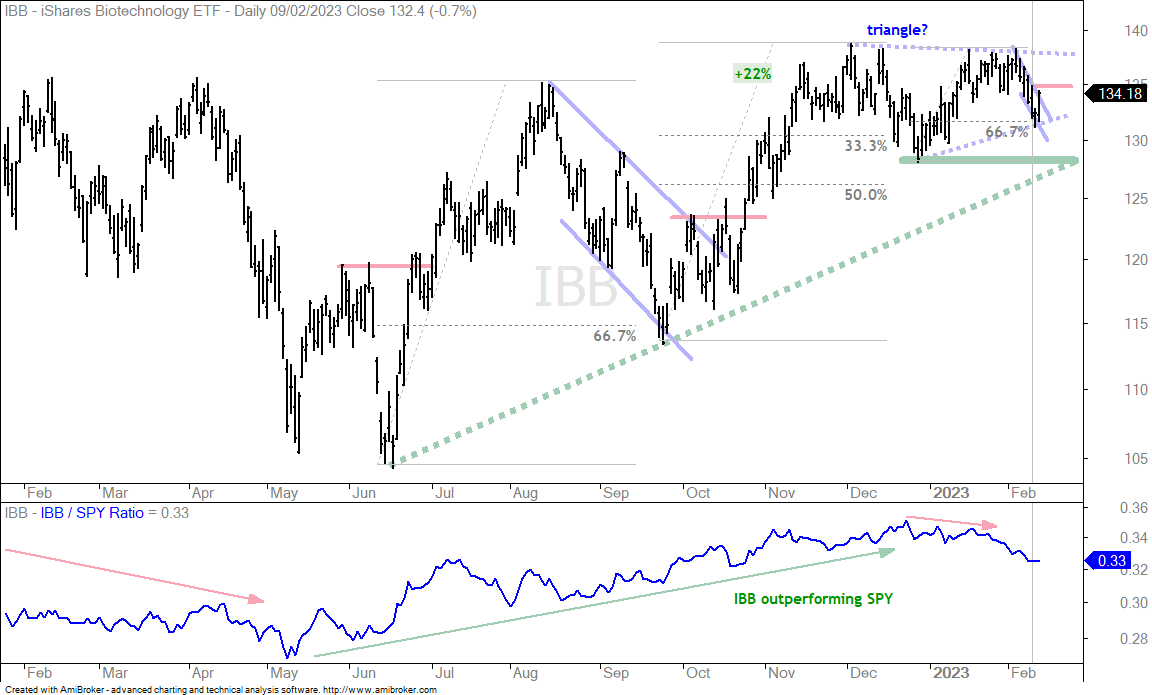
The Biotech ETF (IBB) led the market from May to December as it advanced from 105 to 138. Trading turned choppy the last few months as the ETF moved sideways from mid November to mid February. The overall trend is still up and a triangle could be forming. This would be a consolidation after the 22% advance and a bullish continuation pattern. The swing within the triangle is down in February with a falling flag that retraced around 2/3 of the prior advance. A break above 135 would reverse this downswing and increase the chances of a triangle breakout.

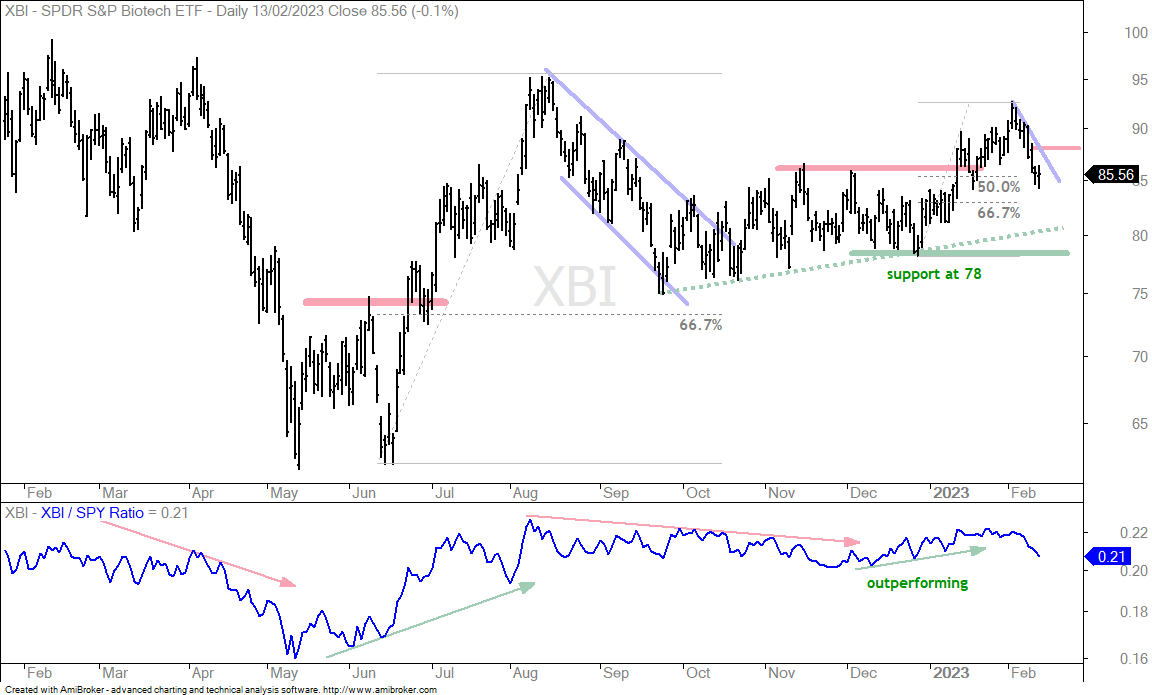
The next chart shows XBI with an uptrend since the September low and a breakout in January. The ETF retraced around half of the December-February advance with a pullback. A breakout at 88 would reverse this short-term slide.  

XLE Reverses Downswing within Triangle

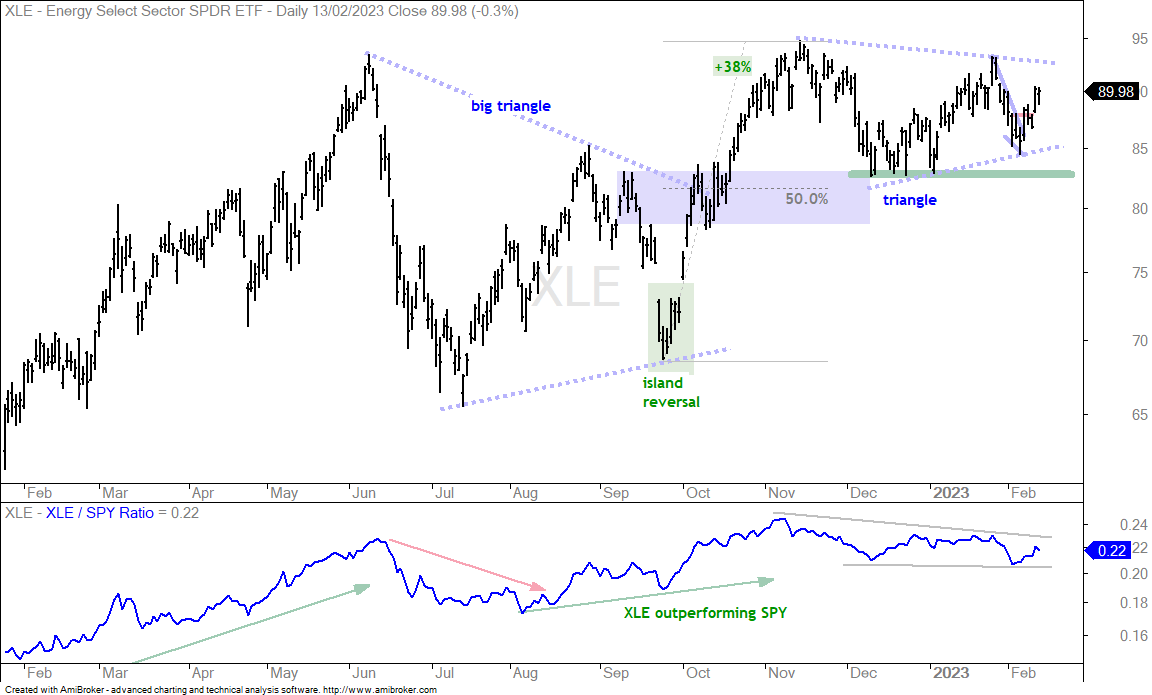
The Energy SPDR (XLE) also formed a triangle after a sharp advance and reversed the downswing with a bounce the past week. The triangle is a consolidation after the 38% advance and a bullish continuation pattern. The downswing reversed with last week’s breakout and this increases the odds of a triangle breakout.

Low Volatility and Defensive ETFs Setting Up

(SPLV, XLV, XLP, PBJ, XLU)

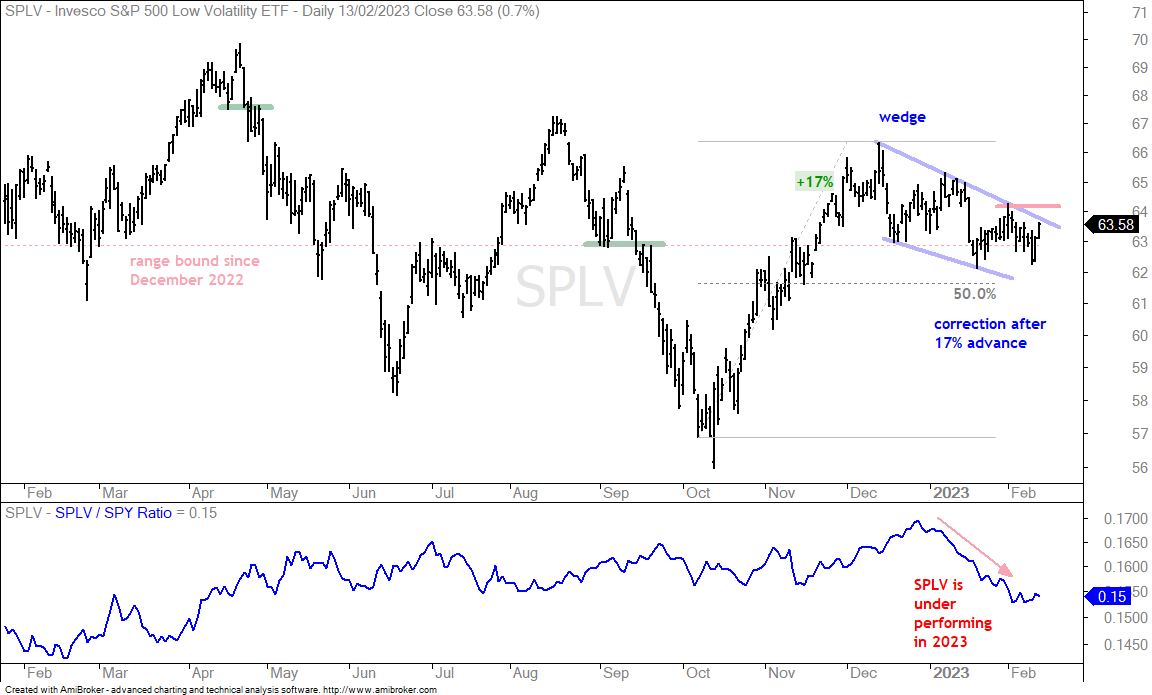
The low volatility and defensive ETFs are lagging the last few months as money moved into the offensive end of the market in 2023. Defensive groups include high-dividend, consumer staples, healthcare and utilities. These groups do not necessarily rise when the broader market falls, but they often fall less and outperform the broader market during periods of weakness. I continue to see bullish setups in the form of pullbacks after big advances. The pullbacks are short-term downtrends and breakouts would reverse these downtrends. Breakouts would also signal a continuation of the prior advance. The first chart shows the S&P 500 Low Volatility ETF (SPLV) with a 17% advance and falling wedge pullback that retraced less than half. A break above the early February high would reverse the short-term downtrend.

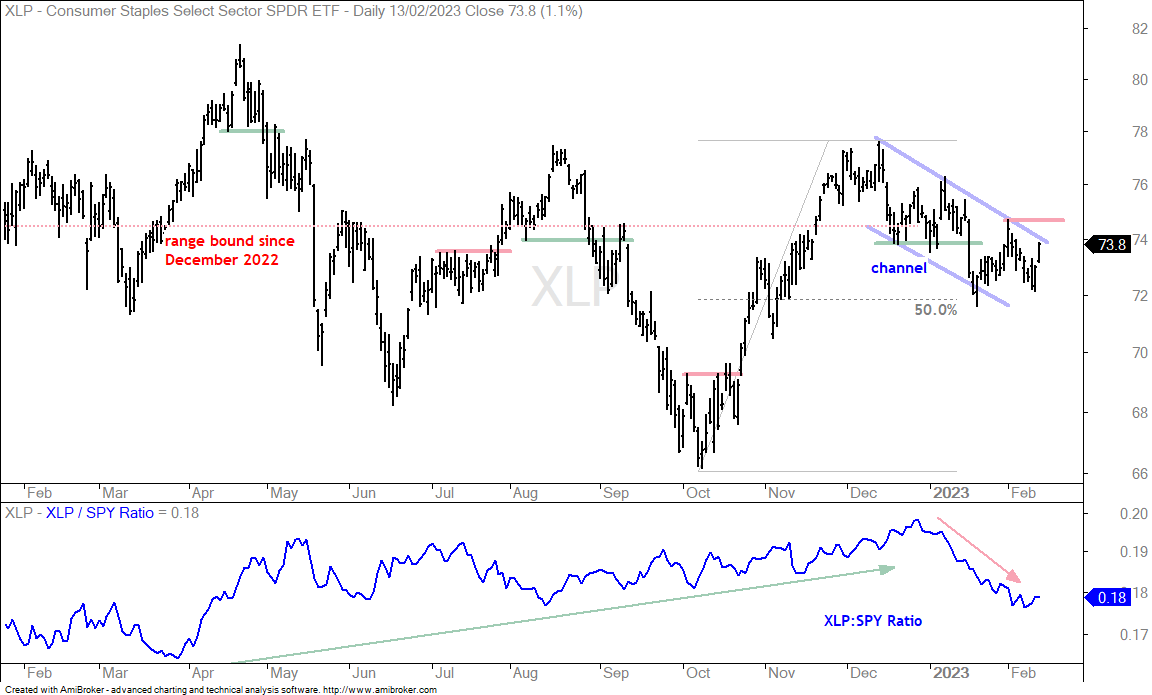
The next chart shows the Consumer Staples SPDR (XLP) with a falling channel correction and resistance at 74.70.

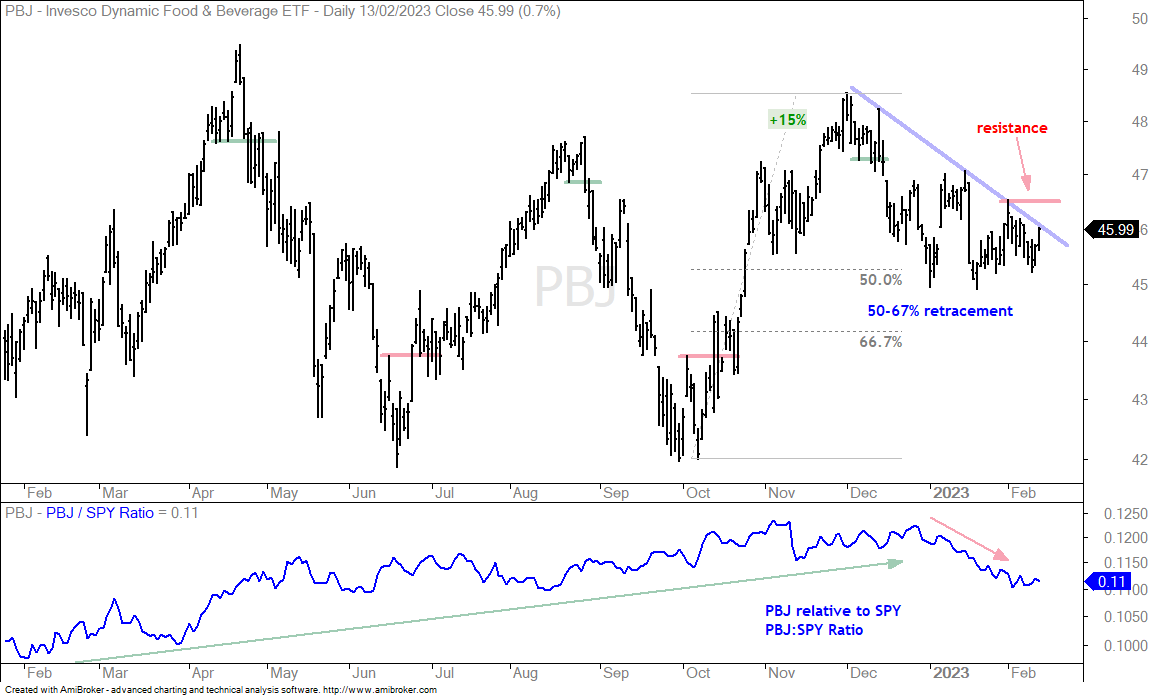
The next chart shows the Food & Beverage ETF (PBJ) retracing 50 to 67 percent and firming in the 45 area. A breakout at 46.5 would be bullish.

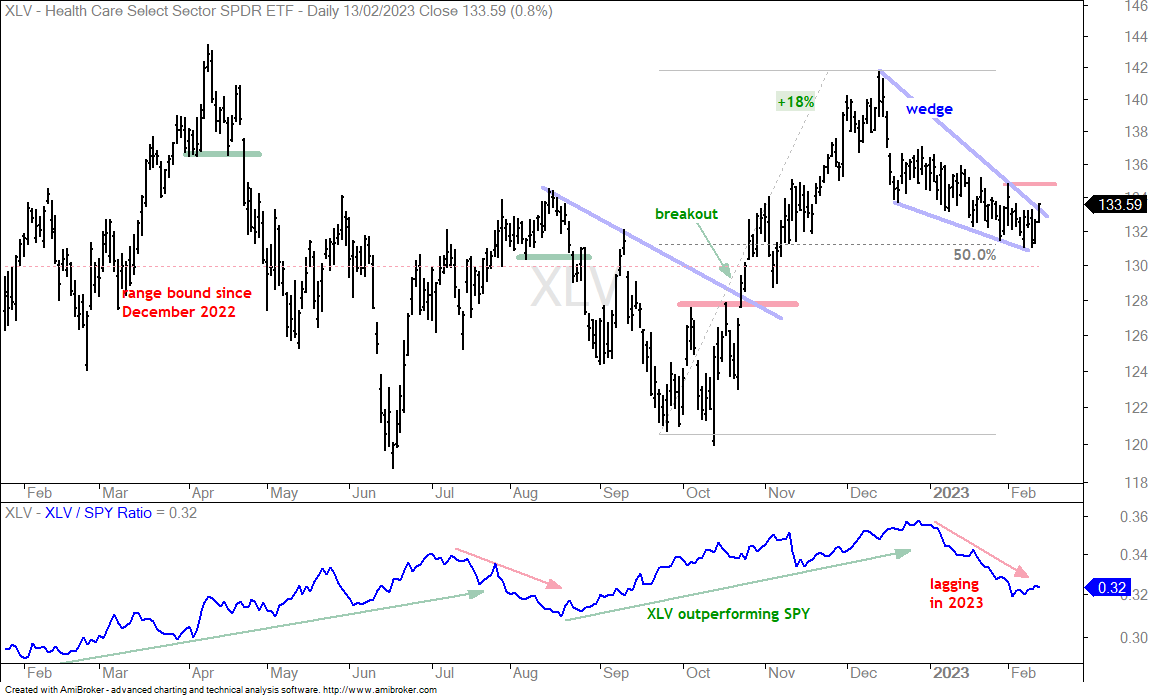
The next chart shows the Healthcare SPDR (XLV) with a falling wedge that retraced around half of the 18% advance. A breakout at 135 would be bullish.

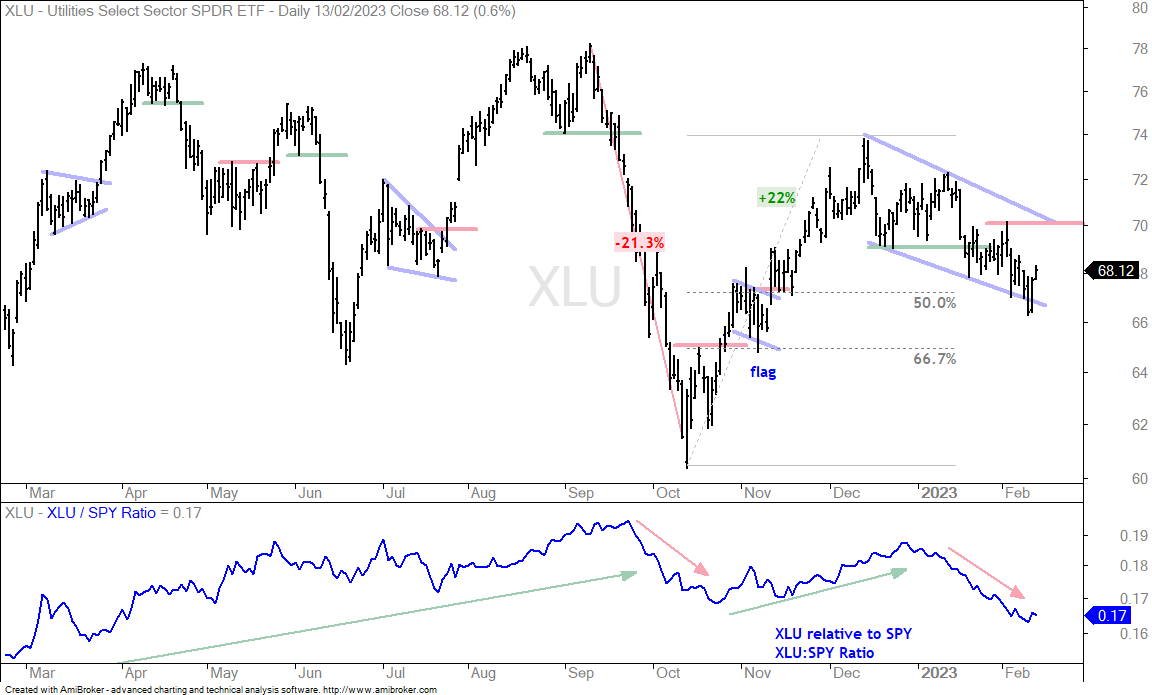
The next chart shows the Utilities SPDR (XLU) with a correction that retraced 50-67 percent of the 22 percent advance. A breakout at 70 would be bullish.

Base Metals Hit Retracement Zone as Copper Firms

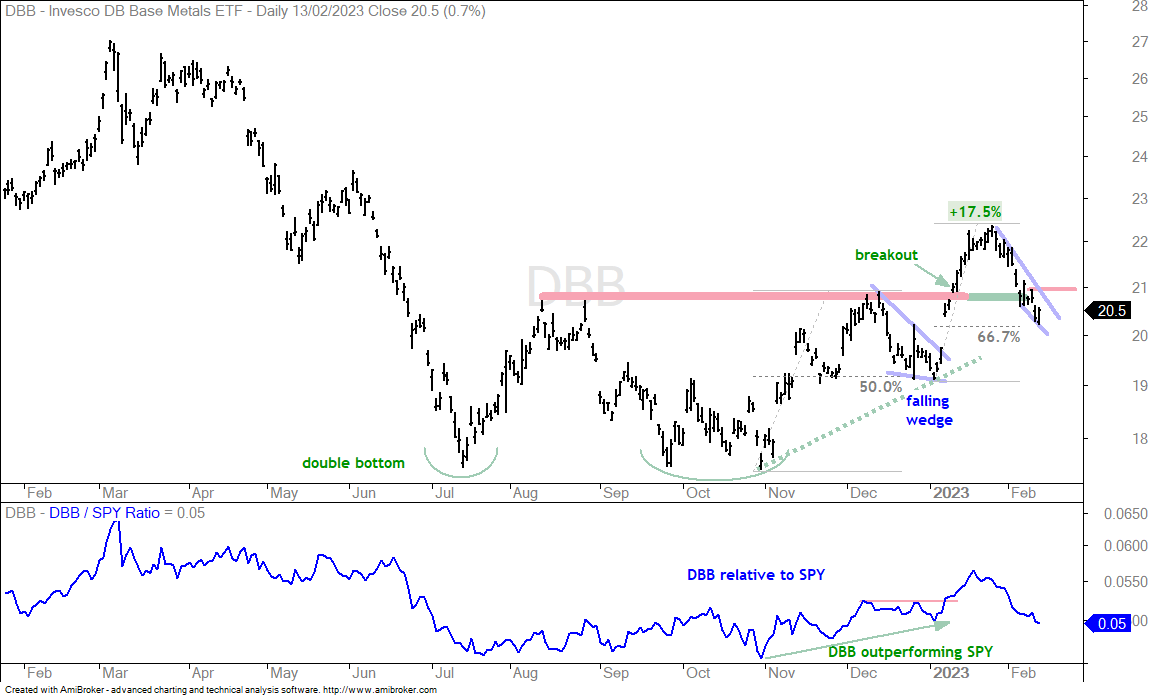
The DB Base Metals ETF (DBB) broke resistance in the 21 area with a 17.5% surge in January. This is a trend-reversing breakout, but the ETF was very overbought when trading above 22. DBB retraced around 67% of this surge with a falling wedge into February and this looks like a correction after the breakout surge. A breakout at 21 would be bullish.

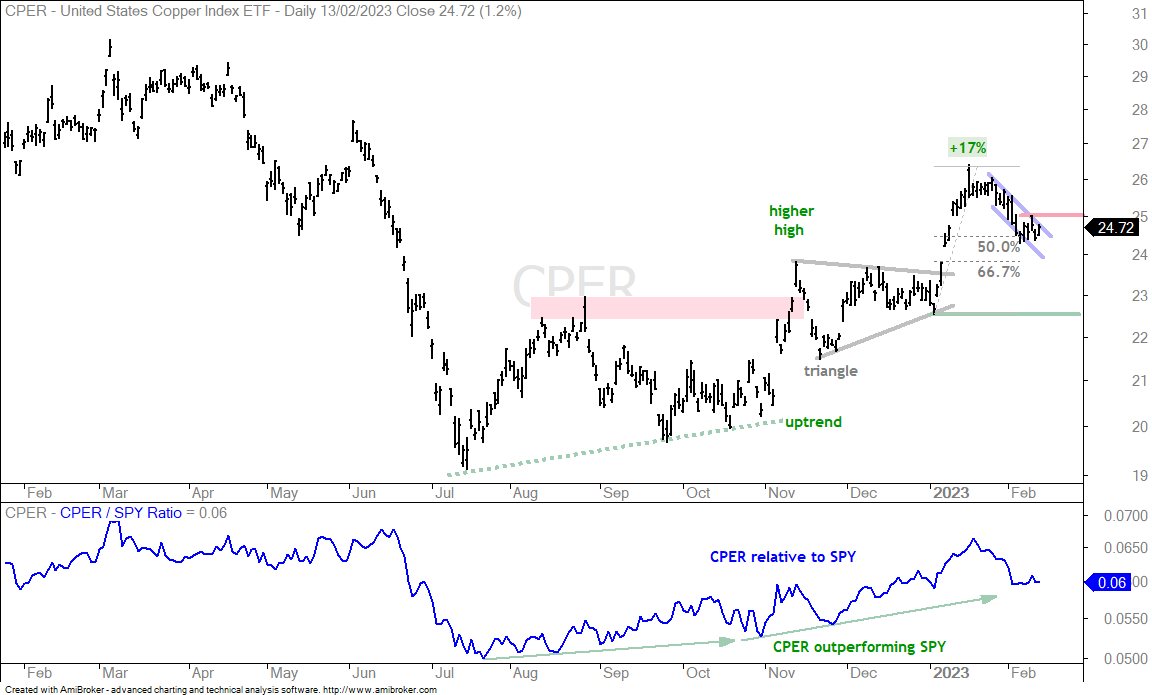
The next chart shows the Copper ETF (CPER) with a 17% surge and a pullback that retraced 50-67 percent. A falling flag of sorts formed and a break above 25 would be bullish.

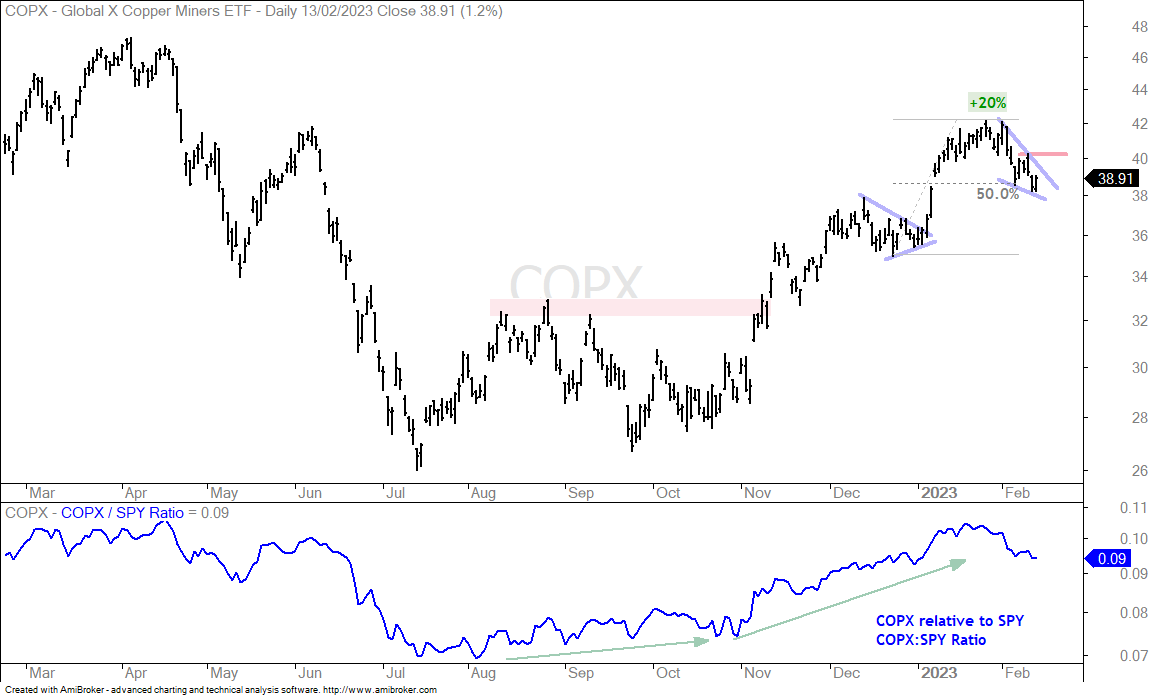
The next chart shows the Copper Miners ETF (COPX) with a 20% surge and a falling wedge pullback that retraced 50-67%. A breakout at 40.40 would be bullish.

Thanks for tuning in and have a great day!