The broad market environment remains bearish for stocks and not exactly bullish for stock alternatives. Most commodity, bond, currency and country ETFs are in downtrends. There are some isolated uptrends within these groups, but the vast majority of ETFs in the master list are in downtrends. 236 (86%) of the 274 ETFs in the MasterList are in downtrends (38 in uptrends). In general, it is tough to generate profits from bullish setups, relative strength and breakouts in such a broad bear market. The bear market will end some day and a new bull market will emerge, but that day is not today so we must live with the bear for now.
About the ETF Trends, Patterns and Setups Report
This report contains discretionary chart analysis based on my interpretation of the price charts. This is different from the fully systematic approach in the Trend Composite strategy series. In this ETF Trends, Patterns and Setups report, I am looking for leading uptrends and tradable setups within these uptrends. While I use indicators to help define the trend and identify oversold conditions within uptrends, the assessments are mostly based on price action and the price chart (higher highs, higher lows, patterns in play). Sometimes the chart assessment can be at odds with the indicators.
This Week's Commentary Schedule
Tuesday – 8 November: Market-ETF Report and Signal-Rank Table Update
Wednesday – 9 November Market-ETF Video and Market Regime Update
Thursday – 10 November: Market-ETF Report and Signal-Rank Table Update
Saturday – 12 November: ETF Signal and Rank Table
SPY with Short-term Support Break
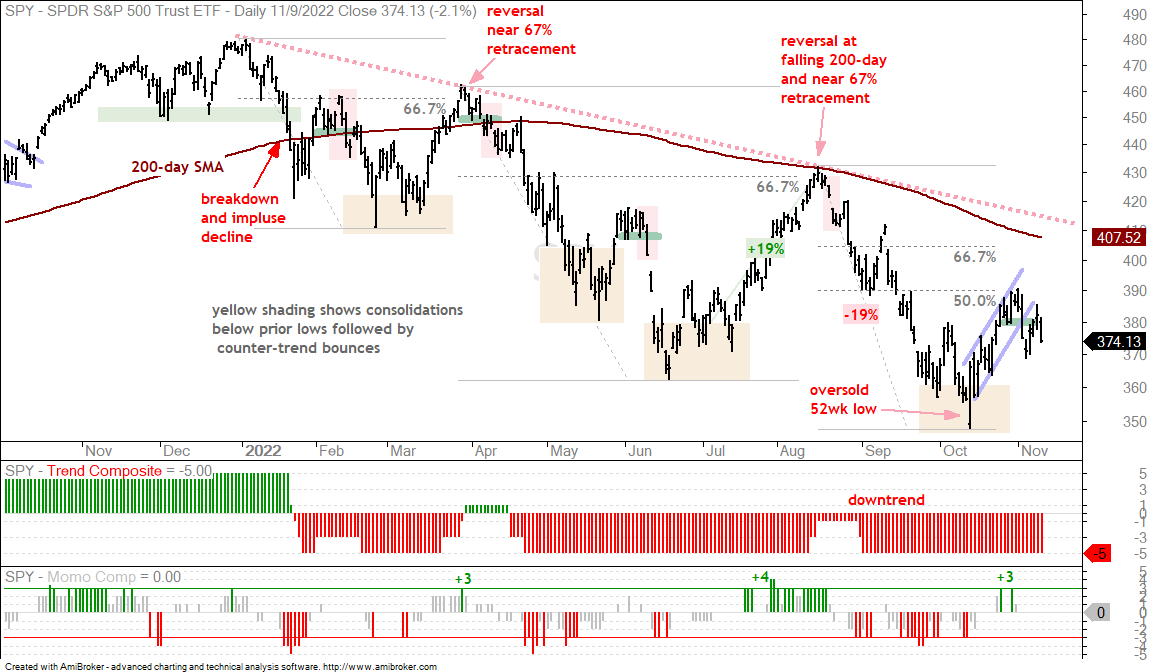
The S&P 500 SPDR (SPY) chart says it all for the stock market: a downtrend throughout 2022, an oversold bounce from mid October to early November and a short-term support break last week. The bounce into early November retraced 50% of the prior advance with a steep rising flag and the Momentum Composite became short-term overbought (+3). SPY broke support last week, bounced back above 380 and turned down again on Wednesday. The short-term upswing has reversed and this signals a continuation of the prior decline (mid August to mid October).
The Momentum Composite aggregates signals in five momentum-type indicators to identify short-term overbought and oversold conditions. This indicator is part of the TIP Indicator Edge Plugin for StockCharts ACP[1]
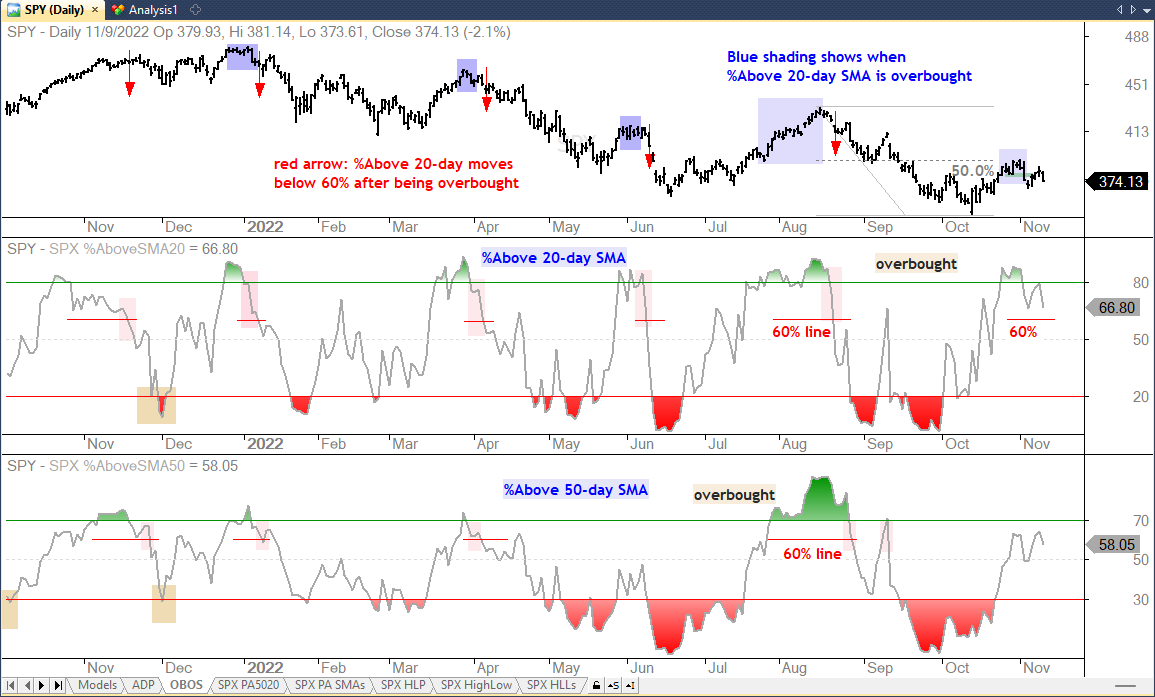
The S&P 500 %Above 20-day SMA has yet to confirm this signal with a break below 60%, but sometimes the support break on the price chart occurs first. The indicator fell to 66.8% on Wednesday and another decent decline in SPY would likely trigger this indicator.
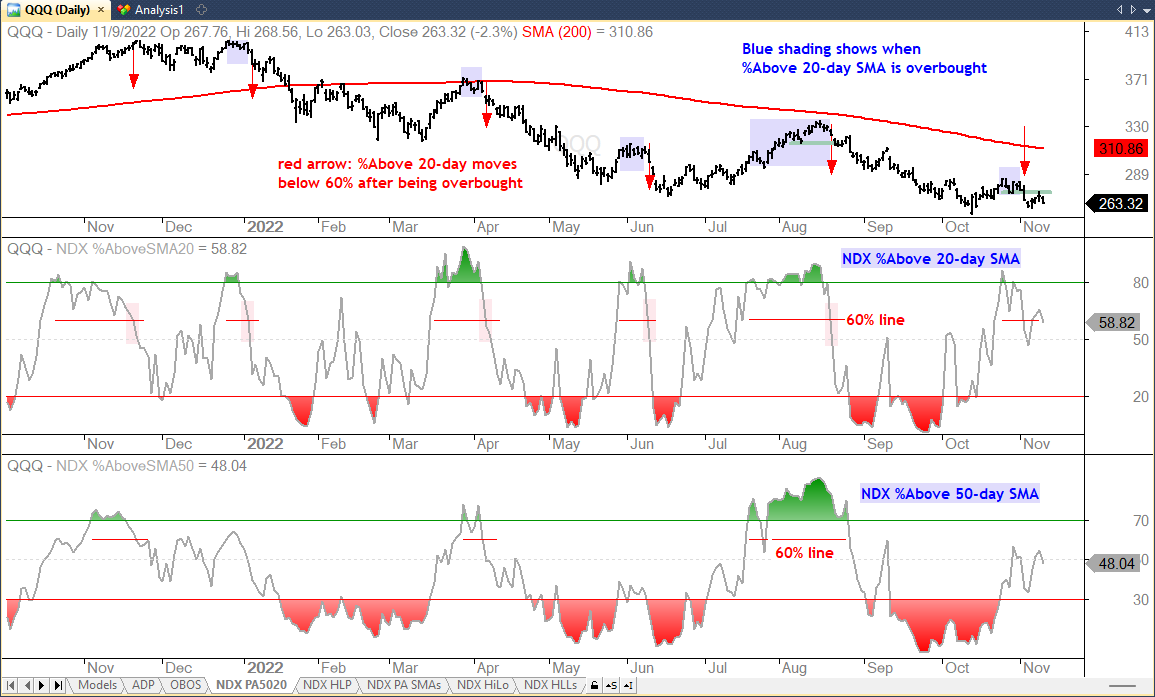
The Nasdaq 100 %Above 20-day SMA triggered last week as QQQ broke short-term support. QQQ is weaker than SPY as large-cap techs lead the way lower. Relative weakness in QQQ and Nasdaq 100 stocks is a BIG issue for the S&P 500 because some Nasdaq 100 stocks account for some 35% of the S&P 500.
The Trend Composite aggregates signals in five trend indicators: Bollinger Bands (125,1), Keltner Channels (125,2), 5-day Rate-of-Change of 125-day SMA, StochClose (125,5) and CCI-Close (125). The Trend Composite and ten other indicators are part of the TIP Indicator Edge Plugin for StockCharts ACP[1]
IWM Reversing at Falling 200-day
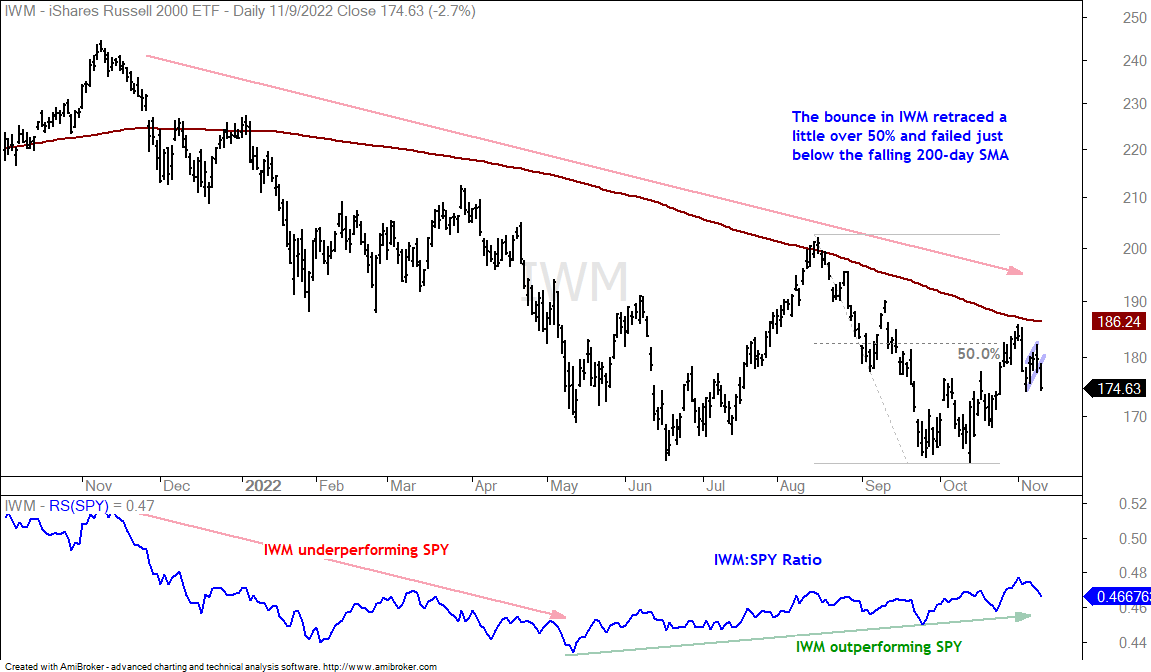
Small-caps have been outperforming since May because IWM remains above its mid May low and the price-relative (IWM:SPY ratio) has been rising. This does not, however, imply that IWM is in an uptrend. IWM is holding up better, but it is still in a downtrend. The ETF surged with the rest of the market into early November and turned down at the falling 200-day SMA last week. There was a small bounce into Tuesday and a flag break on Thursday with a 2.7% decline.
You can learn more about my chart strategy in this article[3] covering the different timeframes, chart settings, StochClose, RSI and StochRSI.
Big Stocks Leading Nasdaq 100 Lower
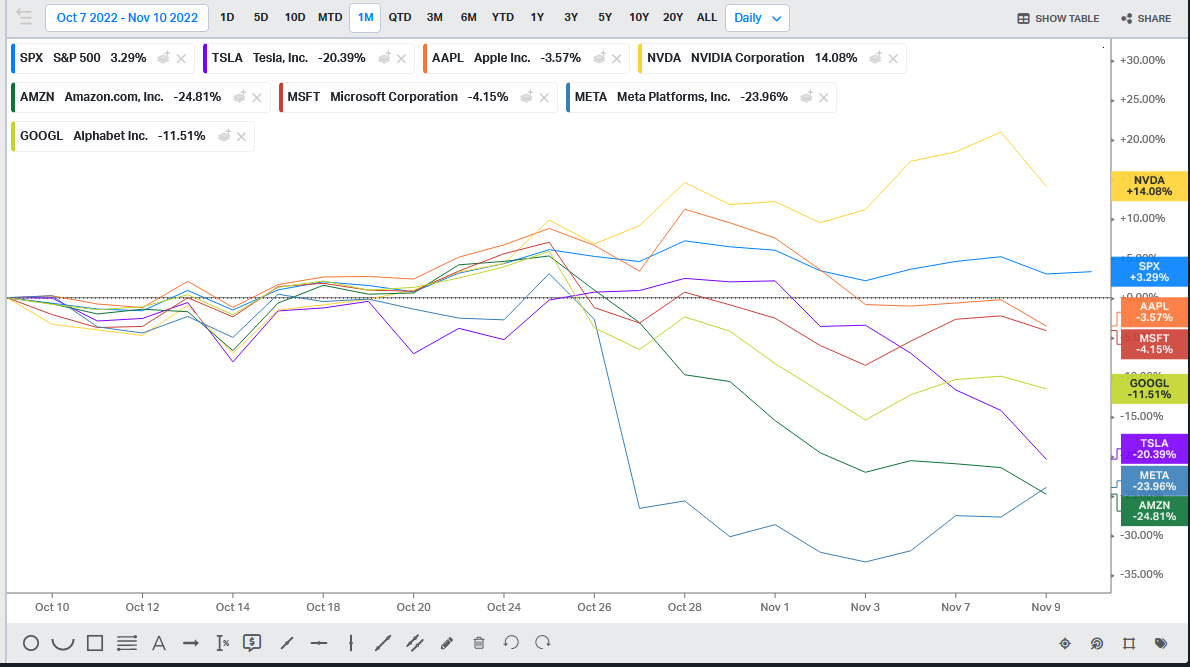
Within the Nasdaq 100, there were 52-week lows for Google (GOOGL), Meta (META), Microsoft (MSFT), Amazon (AMZN), Tesla (TSLA), QualCom (QCOM), DataDog (DDOG), Docusign (DOCU), Okta (OKTA), Atlassian (TEAM), Workday (WDAY), Zoom (ZM) and Zscaler (ZS). The chart from Kyofin shows one month performance for the S&P 500 and seven big stocks from the Nasdaq 100. The S&P 500 is up 3.29% and NVDA is the only gainer (+14%). The other six are down and lagging the broader market (and weighing on SPY). Tesla, Amazon and Meta are down more than 20%.
You can learn more about exit strategies in this post[4], which includes a video and charting options for everyone.
Broad Weakness within the Tech Sector
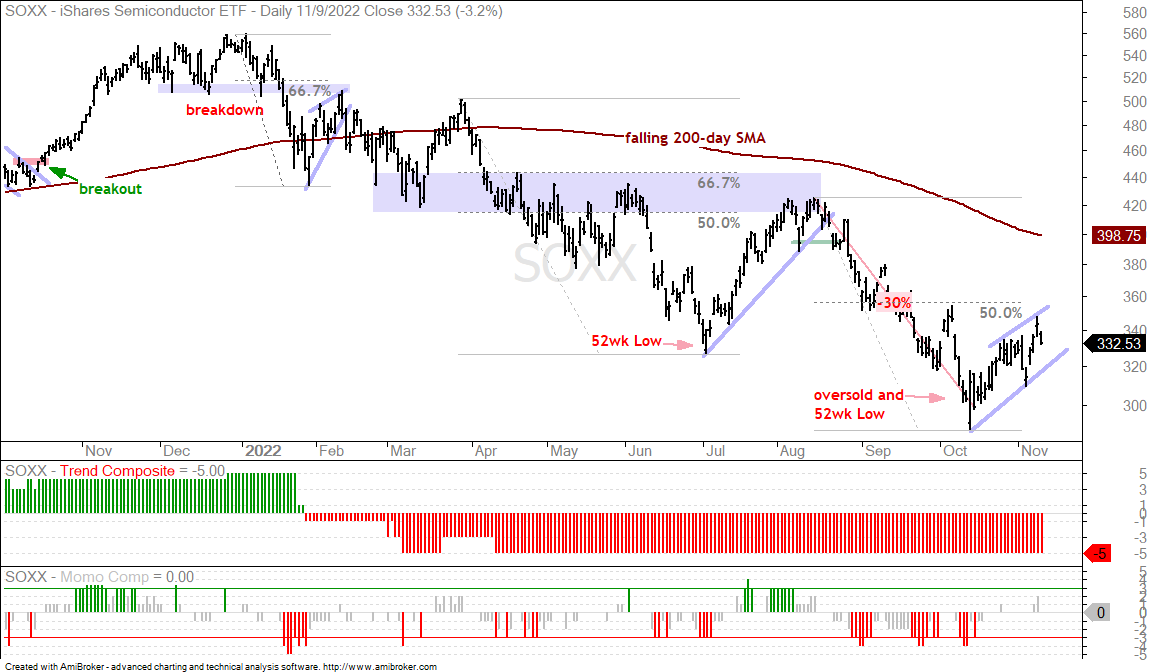
We saw 52-week lows in November for the Consumer Discretionary SPDR (XLY), Cloud Computing ETF (SKYY), FinTech ETF (FINX), Internet ETF (FDN), Software ETF (IGV). The Cybersecurity ETF (CIBR) also fell sharply in November, but remains just above its October low, which was a 52-week low. The Semiconductor ETF (SOXX) did not record a 52-week low in November and has been rising since mid October, but it is still a bounce within a bigger downtrend. We do not need to see charts with 52-week lows because there is no trade, except the oversold after the falling knife. The chart below shows SOXX with an oversold bounce after a 30% decline and 52-week low. The bounce retraced a little less than 50% and formed a rising wedge. Both the retracement amount and pattern are typical for counter-trend bounces.
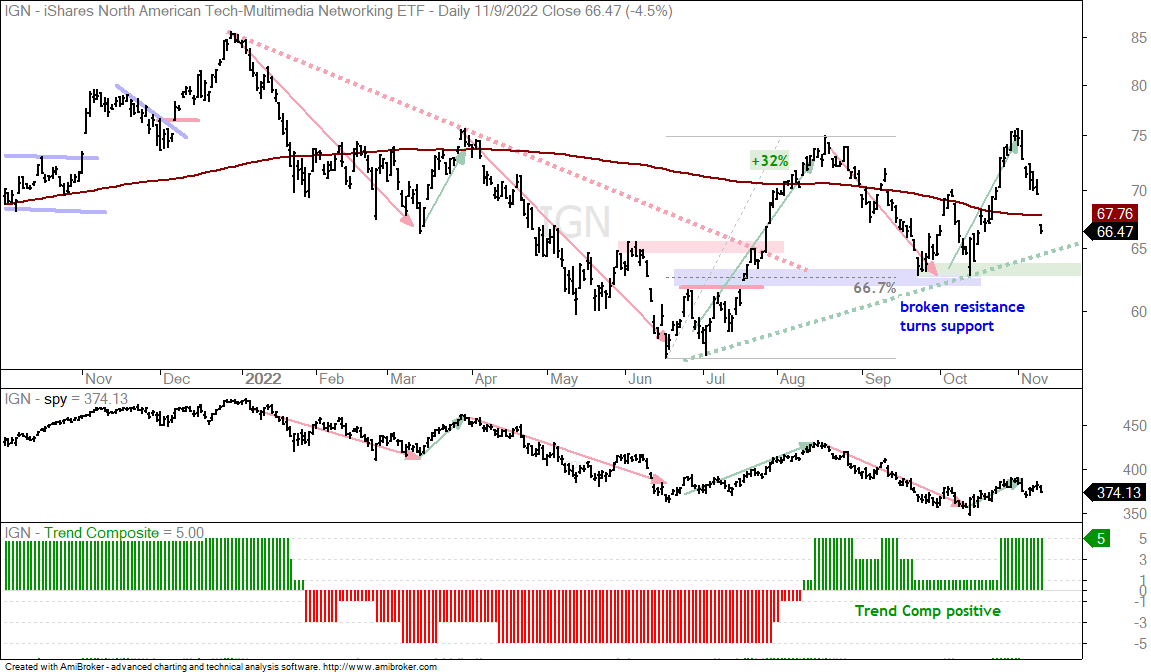
The Networking ETF (IGN) is one of the “island” uptrends within the Technology sector. An island uptrend is a lone uptrend within a group of downtrends. QQQ, XLK and the tech-related ETFs are all in downtrends. IGN represents the exception within the group, but it too is vulnerable to broad market swings. The chart shows IGN trending higher since summer with the Trend Composite turning positive in early August. The Sept-October lows mark support and a break here would reverse the uptrend.
Here is the problem with IGN and other stock-based ETFs. They are still sensitive to broad market movements. The first indicator window shows the swings in SPY since January (red/green arrow lines). Notice how these swings match with the swings in IGN. IGN is still outperforming since summer and has an uptrend working, but do not expect it or other stock-based ETFs to buck the broader market.
Home Construction ETF Forms Bearish Triangle (ITB)
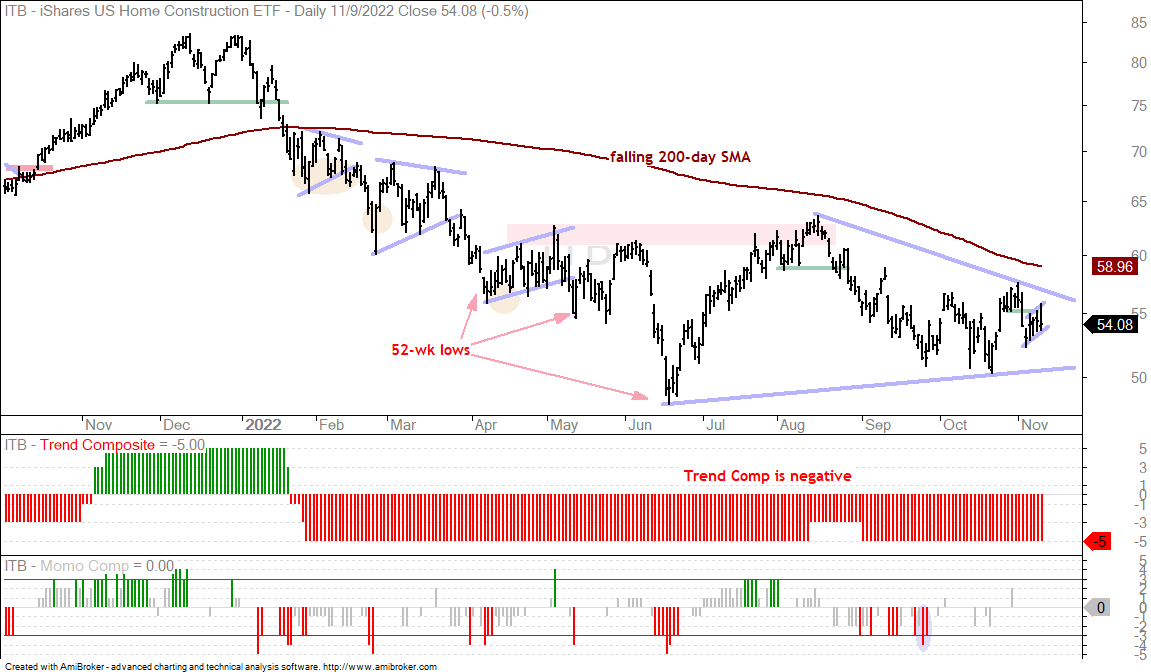
Housing and retail are very important parts of the economic puzzle and ETFs representing these two groups are in downtrends. The first chart shows ITB hitting a new low in June, bouncing with the market into August and falling into October. Overall, it looks like a large Symmetrical Triangle could be taking shape. As noted before, a triangle is neutral with the direction bias coming from the prior move, which was down. This makes the ITB triangle a bearish continuation pattern and a break below 50 would open the door to new lows. Within the triangle, ITB reversed the late October upswing with a support break last week and then formed a rising flag of sorts. A break here would be the first sign that ITB will break triangle support.
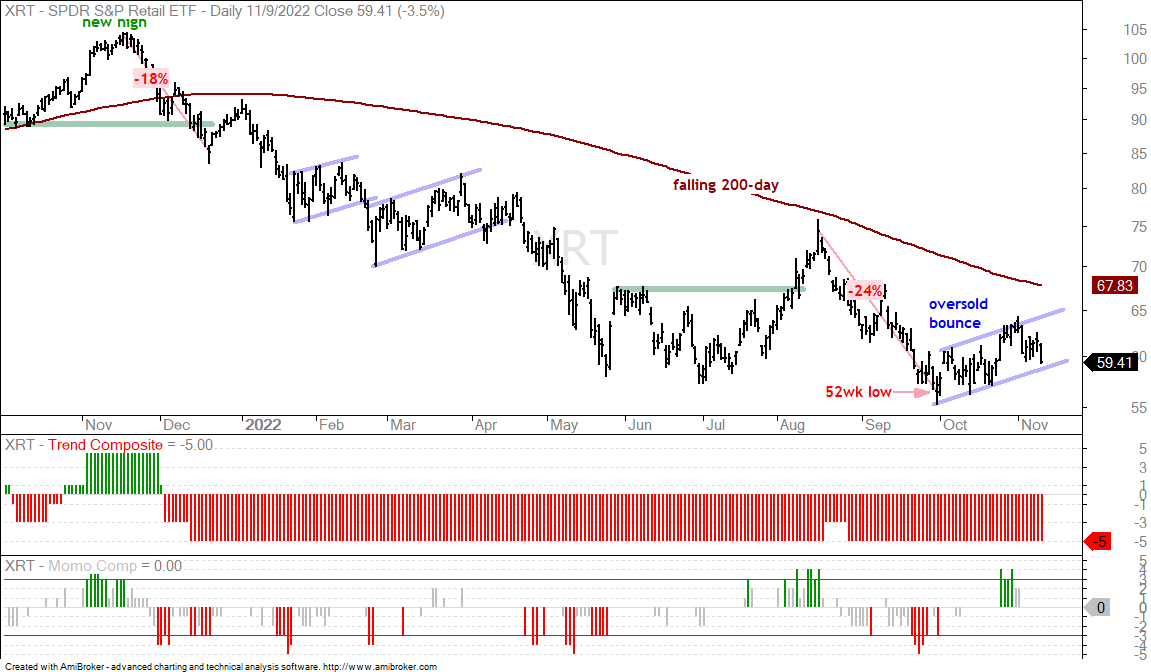
The next chart shows the Retail SPDR (XRT) with a 52-week low in late September and an oversold bounce the last several weeks. This bounce formed a rising channel or flag and a break would signal a continuation lower.
The Bearish Alternative for the US Oil Fund (USO)
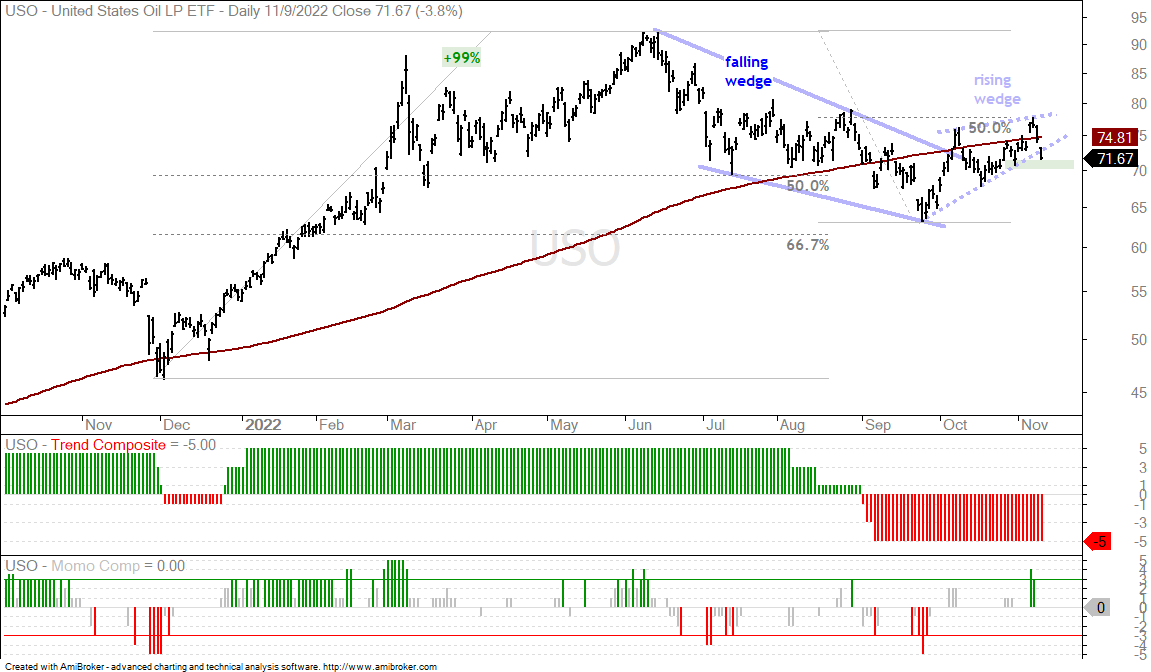
I am going to start using the US Oil Fund (USO) instead of Light Crude Futures (CL1!) for chart analysis. The percentage swings are not the same, but the charts are similar and USO is the tradable ETF. USO formed a large falling wedge and broke out with a surge in October. Prices have been rising since late September and I must now decide what would prove the bullish thesis wrong. The dashed blue lines show a rising wedge that retraced around half of the June-September decline. USO broke the wedge line with a sharp decline the last two days and is now testing the 31-Oct low. This is my line in the sand. A close below this low (green shading) would be bearish for USO.
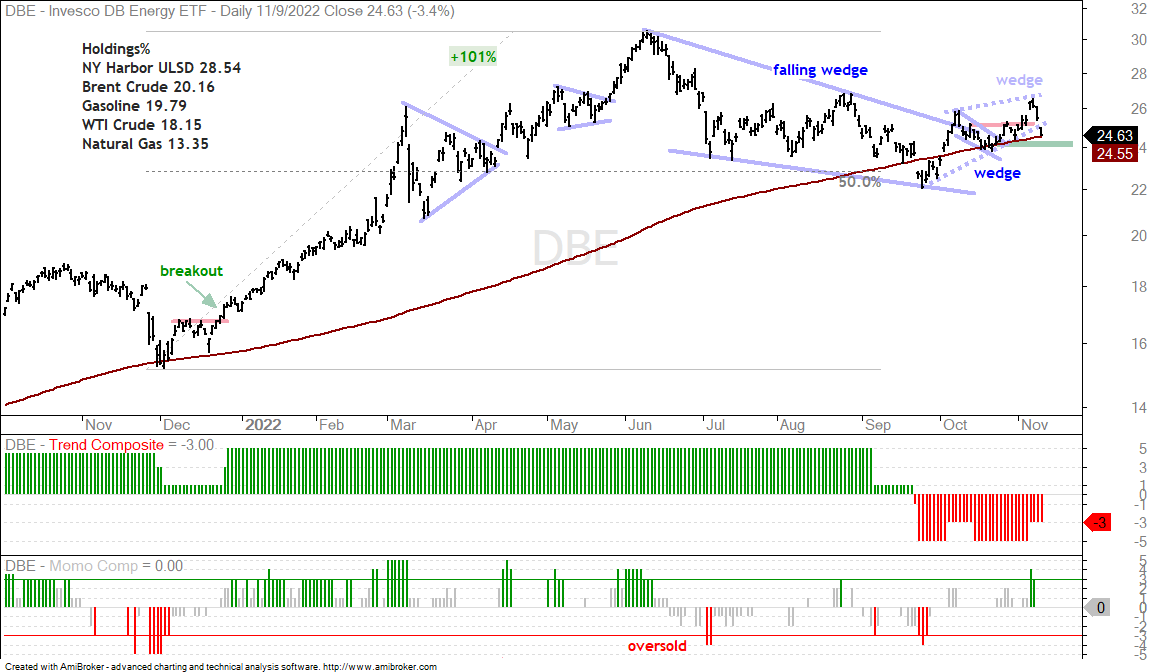
The next chart shows the DB Energy ETF (DBE) with similar characteristics and support at 24.
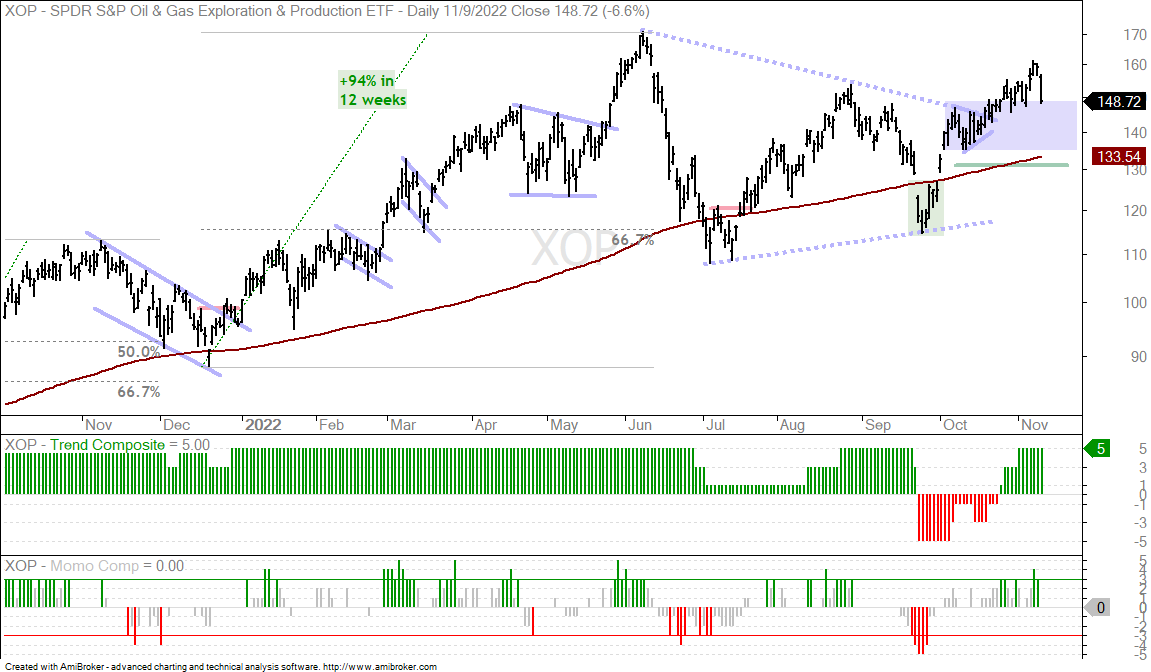
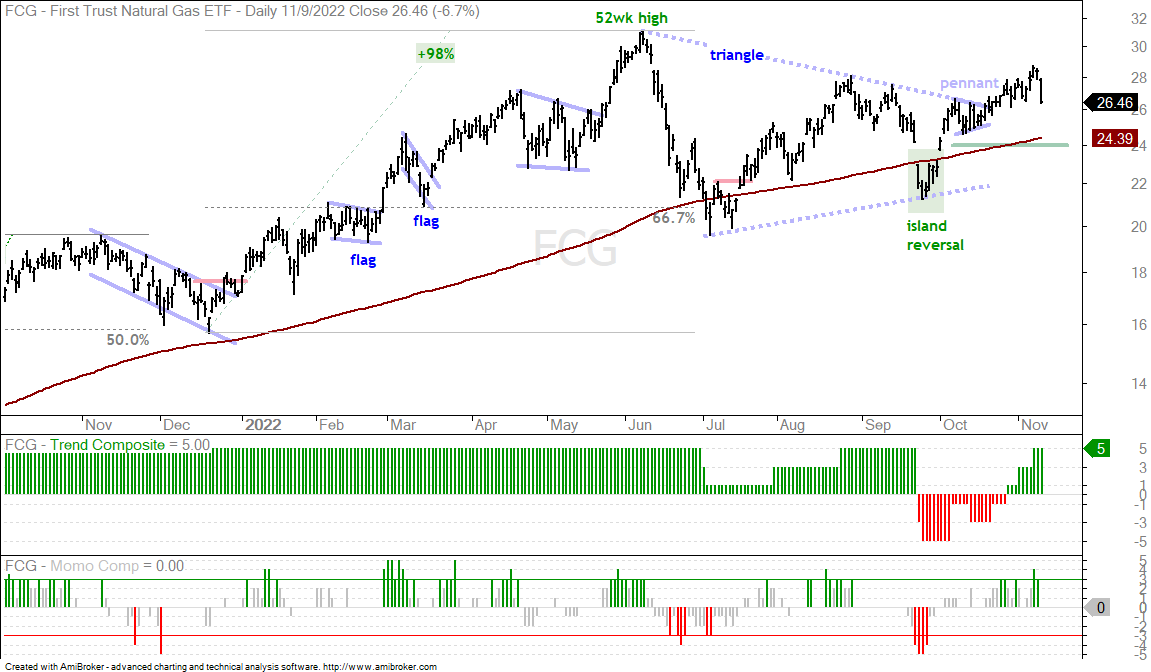
Energy ETFs Leading, But Quite Extended (XLE, FCG, XOP)
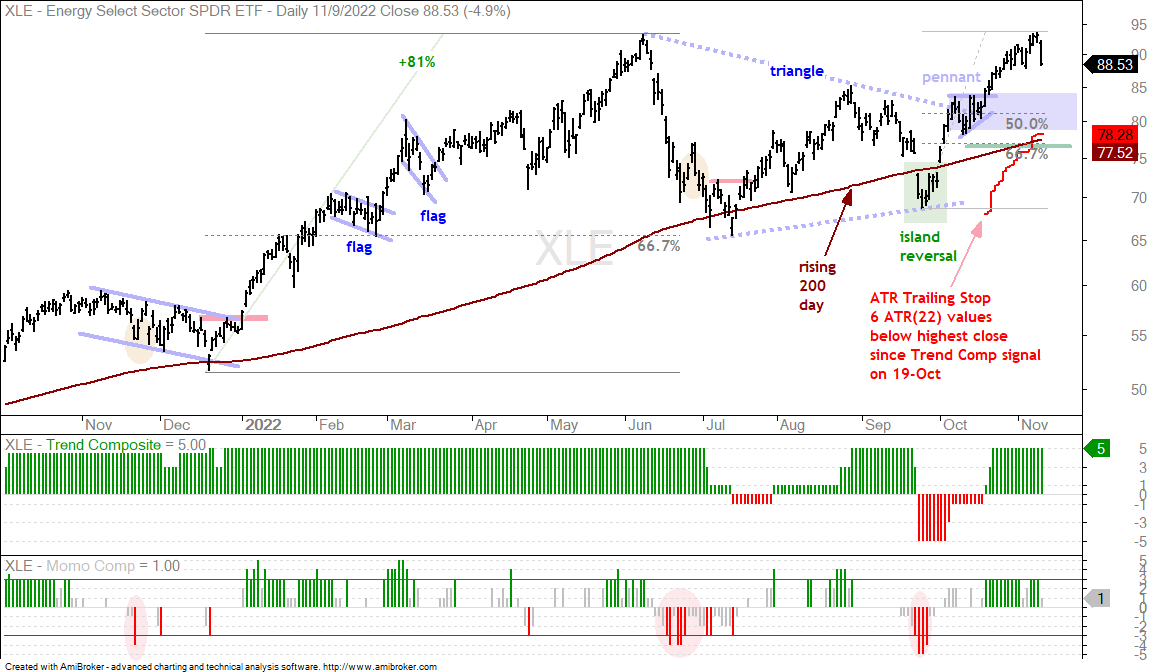
Breakdowns in USO and DBE would likely weigh on the energy sector, which is quite extended after a big move the last several weeks. The chart shows XLE hitting a new high after a 36% advance off the late September low. XLE broke out of a big triangle during this advance and became quite extended above 90. The breakout zone and the pennant mark the first support zone to watch should we see a pullback (blue shading). A 50-67 percent retracement of the Sep-Nov advance would extend to the 77-81 area and the rising 200-day is in this zone. As you can see, forecasting a future support zone is an educated guess. I was using the pennant low as the line in the sand, but I have decided to go a little lower and set it at 76. A decline past this level would be deemed more than just a normal pullback and call for a re-evaluation of the long-term uptrend.
The Oil & Gas Exploration & Production ETF (XOP) and Natural Gas ETF (FCG) have similar charts, but both of these underperformed XLE because they did not come close to their June highs. I am setting my line in the sand at 130 for XOP and at 24 for FCG. Closes below these levels would negate the triangle breakouts and call for a re-evaluation.
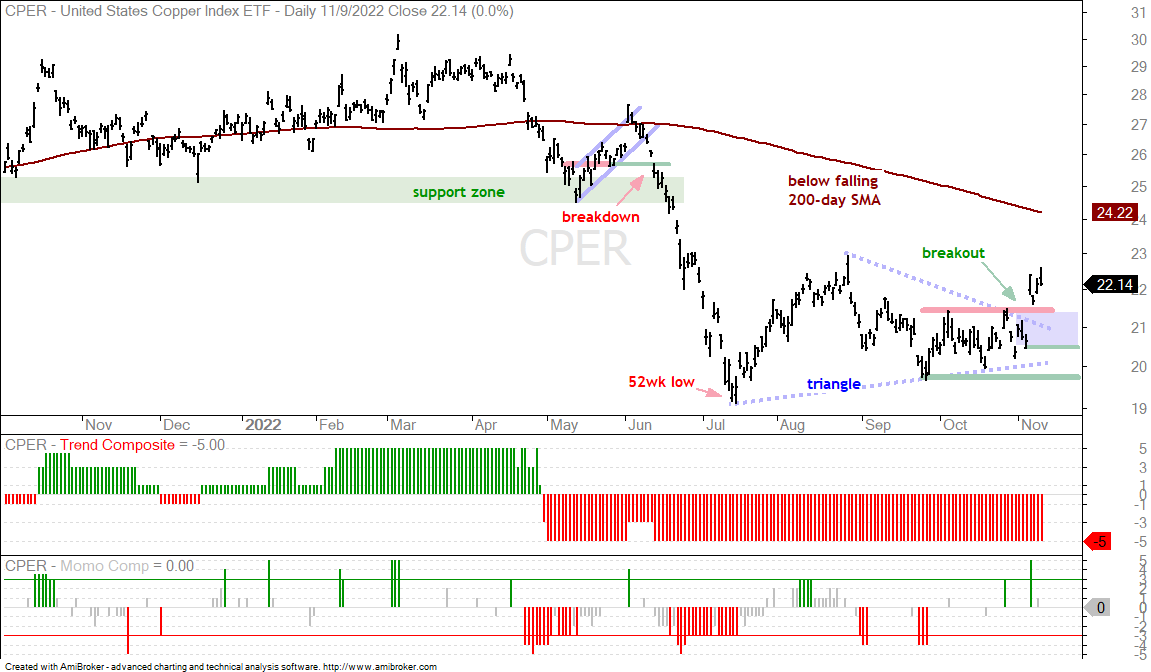
Breakouts in Copper and Copper Miners (CPER, COPX)
Industrial and precious metals surged over the last four days with the Copper ETF (CPER) breaking above its October highs, the Silver ETF (SLV) challenging its falling 200-day SMA, the Gold SPDR (GLD) challenging its October high and the Platinum ETF (PLTM) exceeding its August high. PLTM is the clear leader of the group. The first chart shows CPER with a narrowing range into October and a breakout-surge last week. This breakout is bullish as long as it holds. A close below 20.5 would show cold feet and a close below the September low would be outright bearish.
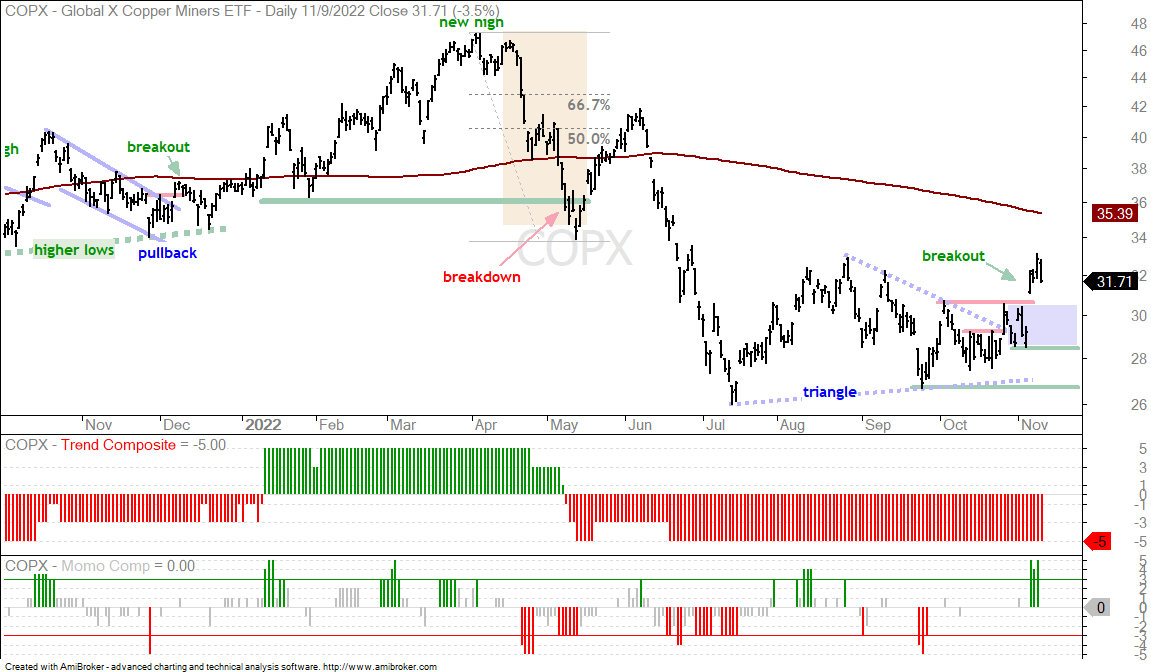
Breakouts have a better chance of succeeding during bull markets and long-term uptrends. This is why a lot of breakouts have failed this year. We are currently in a bear market and copper is still in a long-term downtrend (below falling 200-day and negative Trend Composite). Traders can trade the breakout or wait for the tradable pullback after the breakout. A tradable pullback could involve a short-term bullish pattern (falling flag/wedge), a short-term oversold condition or a throwback to the breakout zone (20.5-21.5). Waiting for the pullback improves the reward:risk ratio and reduces the loss if wrong. The next chart shows the Copper Miners ETF (COPX) with its breakout support zone in the 28.5-30.5 area (blue shading).
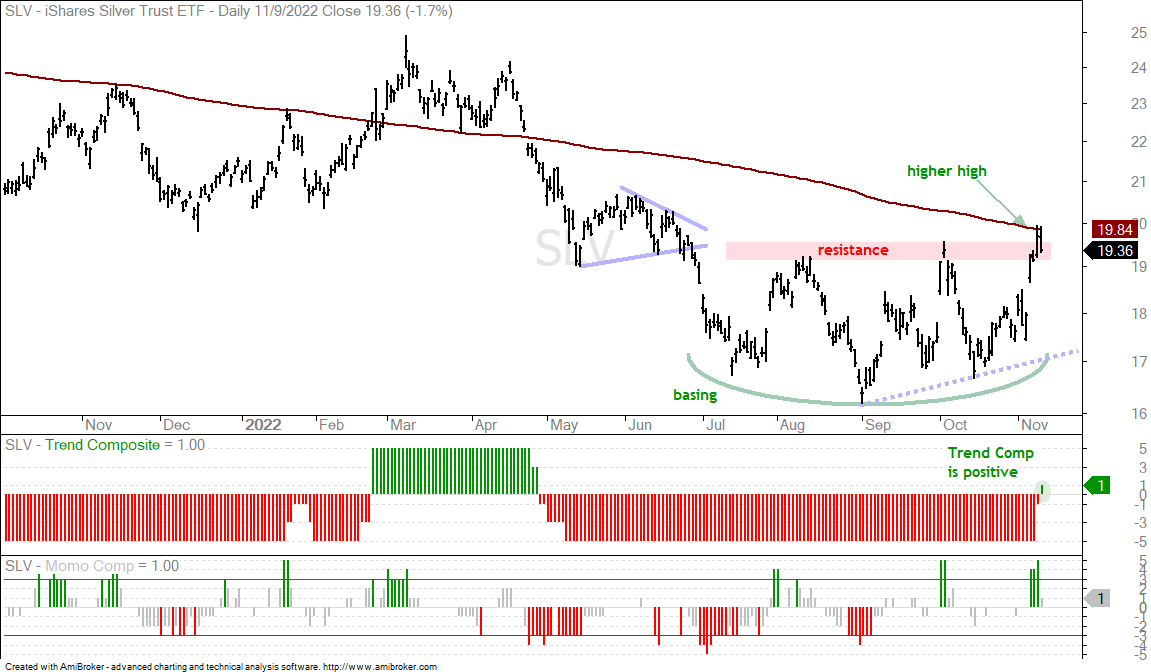
Silver Leads Gold with Breakout (SLV, GLD)
The next chart shows the Silver ETF (SLV) breaking above the August-October highs and challenging the falling 200-day SMA. The breakout was enough to turn the Trend Composite positive for the first time since April. SLV has a base forming since July and the breakout shows a higher high. The base and breakout are bullish, but SLV surged some 10% in four days and became short-term overbought. SLV is also very volatile so expect a wild ride if trading.
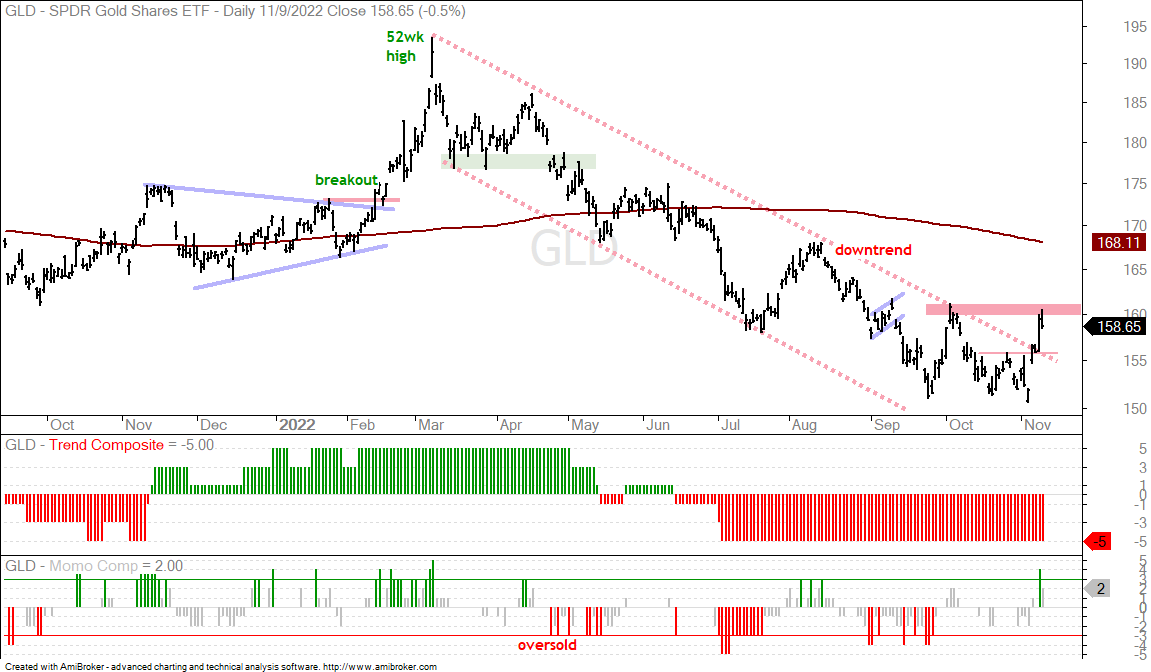
The next chart shows the Gold SPDR (GLD) with its second big surge since late September and a break out of the falling channel. GLD remains short of a trend reversing breakout because it has yet to break the early October high and forge a higher high (red shading). More work is needed here.
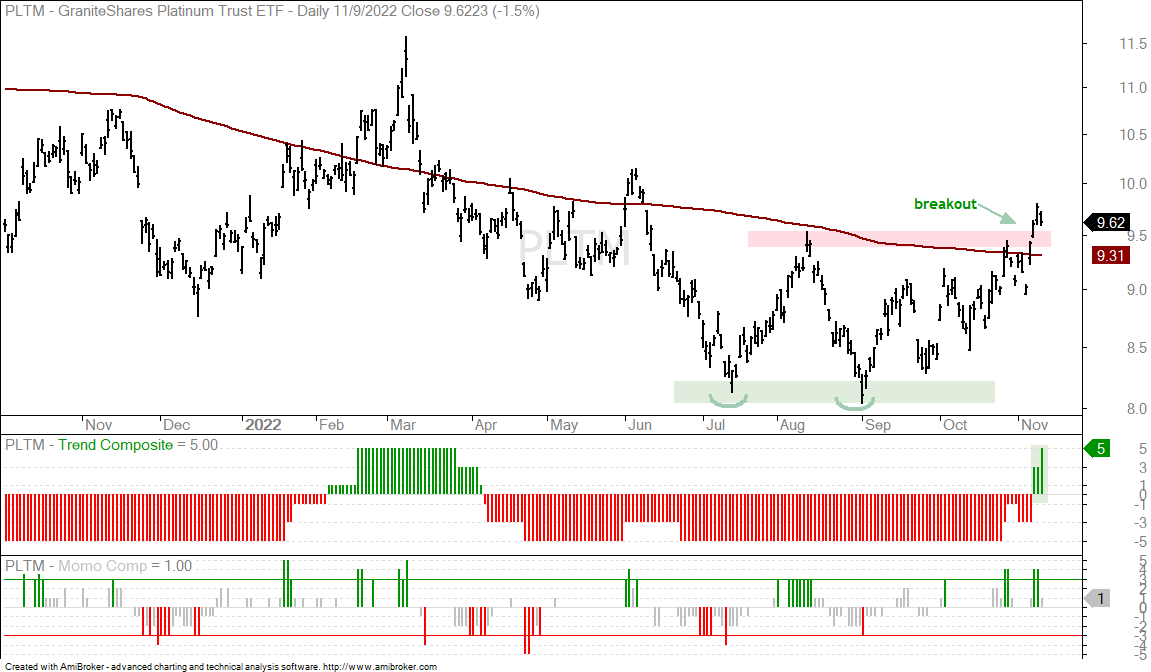
Platinum Leads Metals with Double Bottom Breakout (PLTM)
The next chart shows the Platinum ETF (PLTM) breaking above its August high and 200-day SMA. The Trend Composite also turned positive three days ago. Overall, the lows in July-Aug formed a double bottom and PLTM confirmed this bullish reversal pattern with the breakout. There are two choices for traders: buy the breakout with a wide stop or wait for a tradable pullback with a better reward:risk ratio.
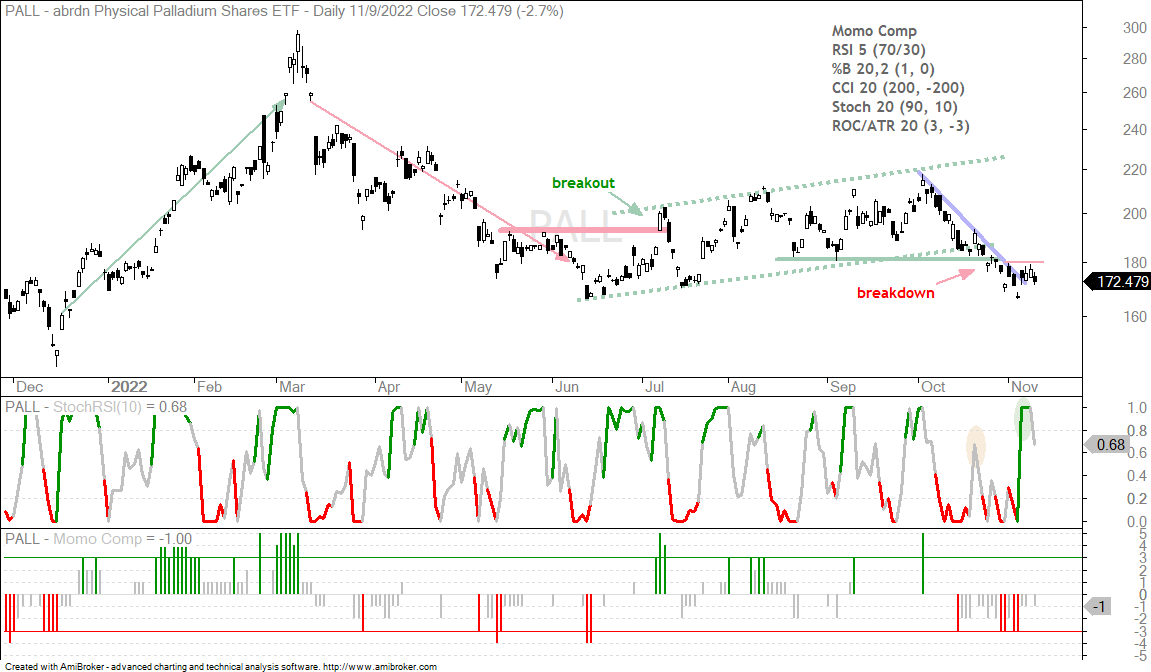
Palladium ETF Firms within Short-term Downtrend (PALL)
The Palladium ETF (PALL) ETF reversed its uptrend with a breakdown in late October. PALL broke the channel line and exceeded the August lows. The short-term trend is down since mid October, but PALL firmed the last two weeks and a break above 180 would be short-term bullish. The indicator window shows a StochRSI pop four days ago and this shows a short-term momentum thrust, which could foreshadow a price breakout.