A Motley Mix of ETFs
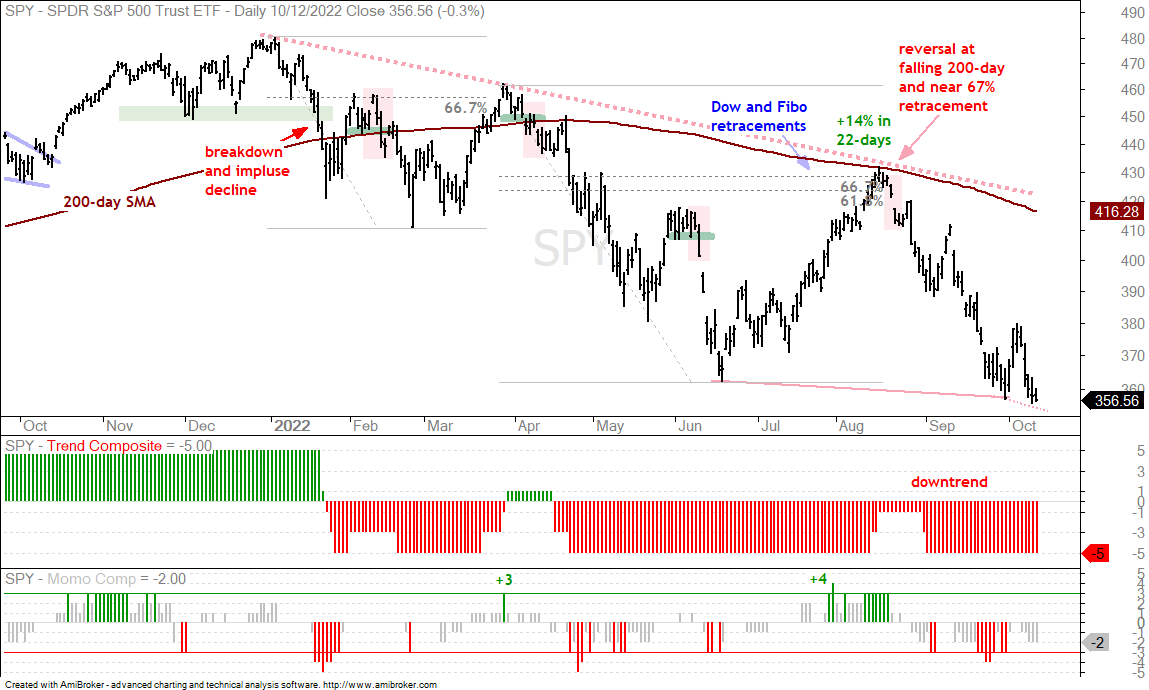
Today’s report is a motley mix of ETFs. Only two are in actual uptrends (biotech and the Dollar). The Trend Composites for the clean energy ETFs turned negative on Wednesday so these are clearly out of the picture now. While many ETFs broke their summer lows in September and broke their late September lows in October, some held above both of these lows and are showing some relative strength (less weakness). Even though these ETFs are still in downtrends, they have some medium-term bullish setups working that could give way to a counter-trend bounce. Some serious discretion is advised! As a reference, the chart below shows SPY with a lower low from June to September (red lines) and again from late September to October (red dotted line).
About the ETF Trends, Patterns and Setups Report
This report contains discretionary chart analysis based on my interpretation of the price charts. This is different from the fully systematic approach in the Trend Composite strategy series. In this ETF Trends, Patterns and Setups report, I am looking for leading uptrends and tradable setups within these uptrends. While I use indicators to help define the trend and identify oversold conditions within uptrends, the assessments are mostly based on price action and the price chart (higher highs, higher lows, patterns in play). Sometimes the chart assessment can be at odds with the indicators.
This Week's Commentary Schedule
- Tuesday – 11 October: Market-ETF Report and Signal-Rank Table Update
- Wednesday – 12 October Market-ETF Video and Market Regime Update
- Thursday – 13 October: Market-ETF Report and Signal-Rank Table Update
- Saturday – 15 October: ETF Signal and Rank Table
Clean-Energy ETFs Bite the Dust
The Biotech SPDR (XBI), Medical Breakthroughs ETF (SBIO) and Networking ETF (IGN) are the only three stock-based ETFs with positive Trend Composites (uptrends). All three have been in uptrends since the early part of August, but they are down 10-15 percent since these signals. There were six stock-based ETFs in uptrends at the start of the week, but the Trend Composite turned negative for the three clean energy ETFs on Wednesday (ACES, TAN, QCLN). Few, if any, stock-based ETFs have escaped the wrath of the bear since mid August.
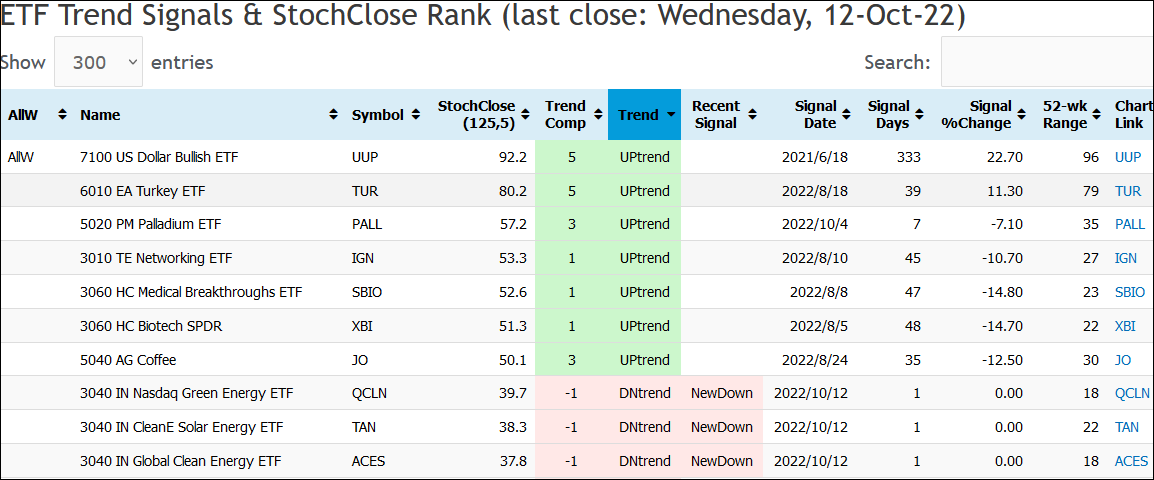
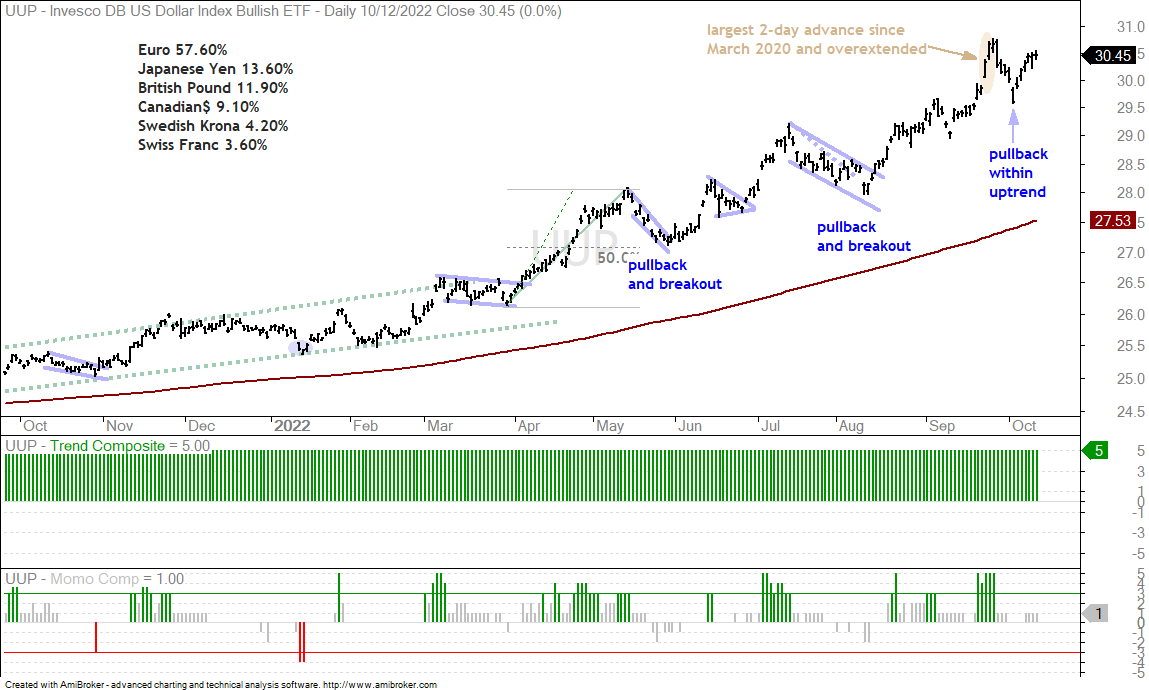
As the table above shows, the other four ETFs in uptrends are the Dollar Bullish ETF (UUP), Turkey ETF (TUR), Palladium ETF (PALL) and Coffee ETF (JO). I am not interested in Turkey because almost all equity markets are in bear markets. JO was on my list, but the ETF broke support with a sharp decline on Wednesday (details further below).
The column on the far left shows that only one of the fifty All Weather ETFs is in an uptrend, the Dollar Bullish ETF (UUP). Depending on the signals, the All-Weather ETF Bull-Bear Strategy [1] trades up to 14 ETFs, which is 7.14% per position. The current portfolio would be less than 10% invested and 90% cash because only one ETF is in an uptrend (UUP). The bearish signals insured that exposure was cut.
The Momentum Composite aggregates signals in five momentum-type indicators to identify short-term overbought and oversold conditions. This indicator is part of the TIP Indicator Edge Plugin for StockCharts ACP [2]
Biotech SPDR with "Normal" Pullback (XBI)
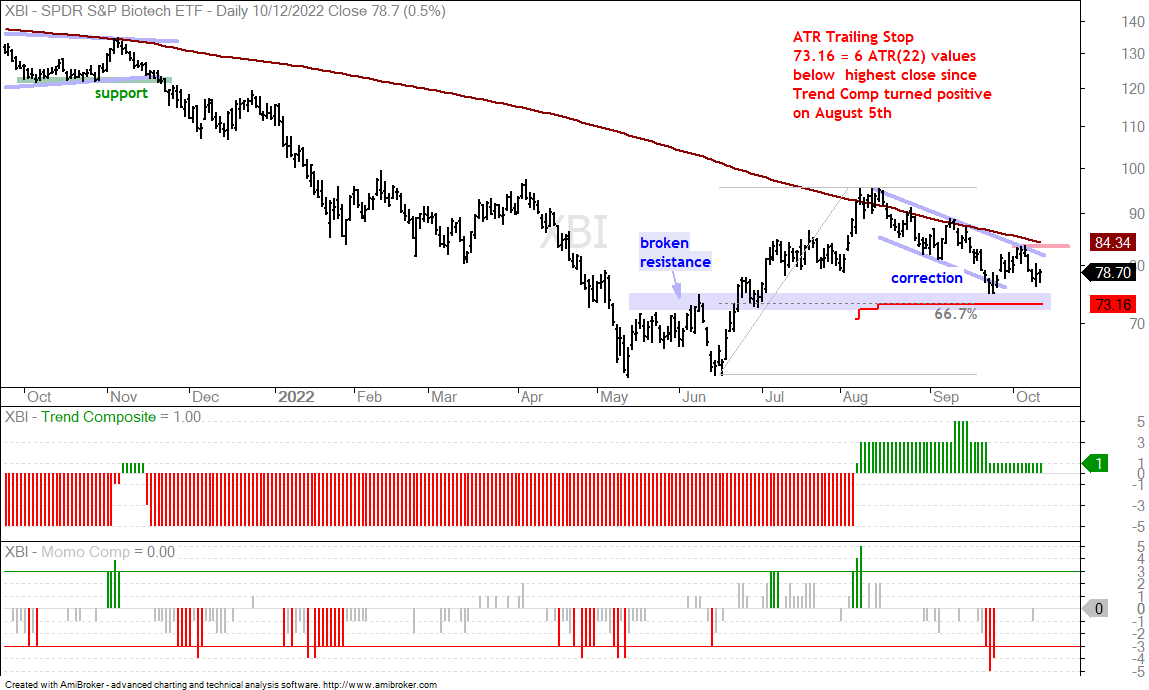
The Biotech SPDR (XBI) is one of the few stock-based ETFs with a positive Trend Composite and a seemingly normal pullback after the June-August advance. This pullback is deemed a normal correction because it retraced a normal amount (50-67%), returned to a normal support zone (broken resistance) and formed a normal pattern (falling channel). Also note that XBI shows medium-term relative strength because it remains well above its summer lows and short-term relative strength because it did not break its late September low. A break above the early October high would reverse the corrective downswing since mid August and signal a continuation of the bigger uptrend. SBIO has a positive Trend Composite and a similar chart. IBB has a negative Trend Composite, but similar chart characteristics.
You can learn more about exit strategies in this post [3],
which includes a video and charting options for everyone.
Home Construction ETF Holding Up, But … (ITB)
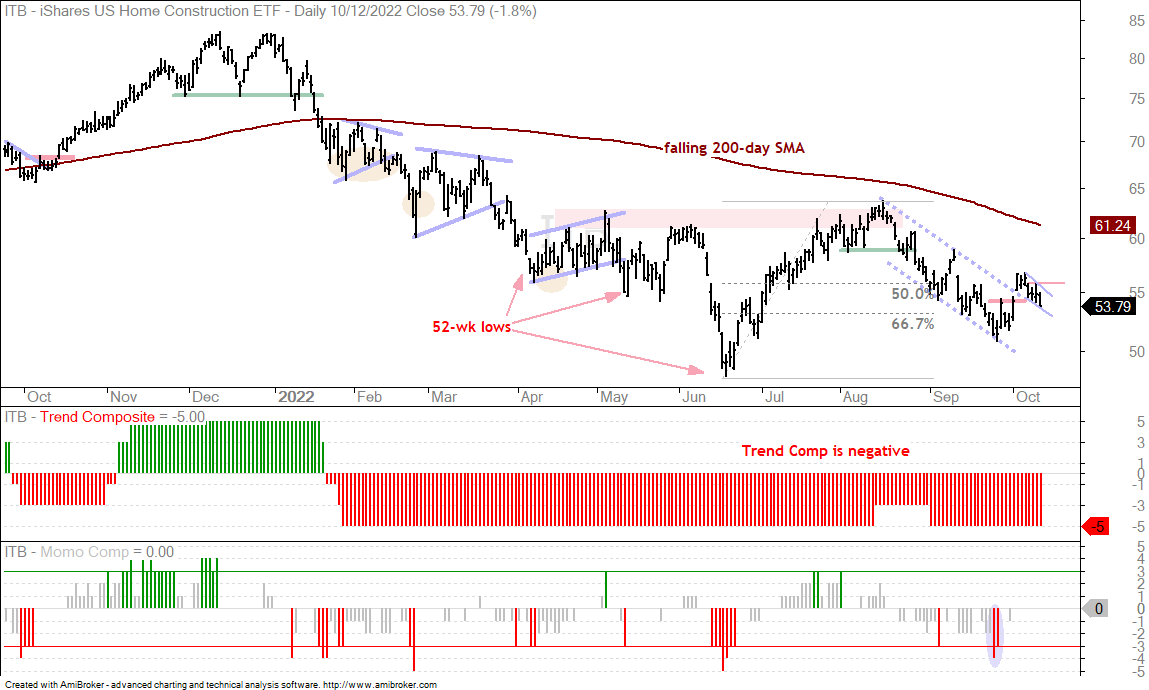
The Home Construction ETF (ITB) has a price chart similar to XBI, but the decline into September was deeper and a little more than a normal correction. The Trend Composite is also negative. ITB, however, shows medium-term relative strength because it held above its summer low and short-term relative strength because it remains above the late September low. Note that SPY broke both. ITB surged last week and then edged lower the last five days. A look at the 30min chart would reveal a surge and falling wedge. A break above 56 would be short-term bullish and could lead to a bigger bounce within the downtrend. Yes, it is still considered a bounce within a bigger downtrend.
The Trend Composite aggregates signals in five trend indicators: Bollinger Bands (125,1), Keltner Channels (125,2), 5-day Rate-of-Change of 125-day SMA, StochClose (125,5) and CCI-Close (125). The Trend Composite and ten other indicators are part of the TIP Indicator Edge Plugin for StockCharts ACP [2]
Regional Bank ETF Holding Up, But … (KRE)
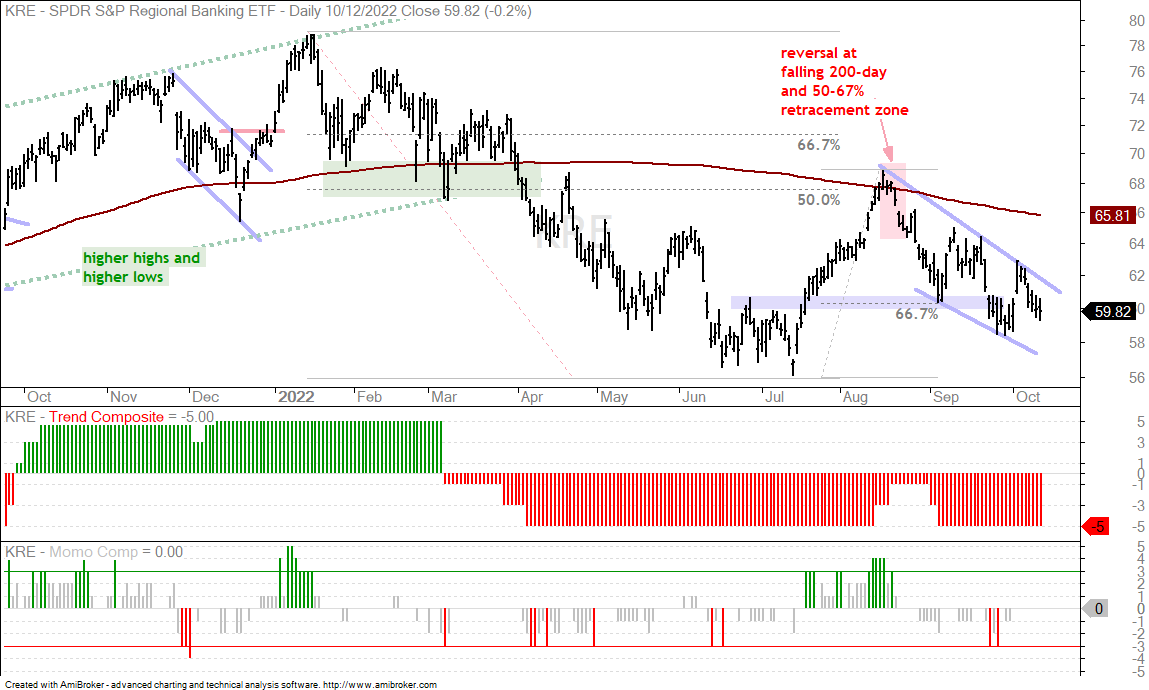
The Regional Bank ETF (KRE) sports a chart similar to ITB. The August-September decline was too deep to be considered a normal correction. Normal corrections retrace 33-67% of the prior advance and prior breakouts tend to hold. KRE overshot both. The Trend Composite remains negative and KRE is still below the falling 200-day SMA. It is showing some medium-term and short-term relative strength, but any bounce would still be considered a bear market bounce at this stage.
You can learn more about my chart strategy in this article [4] covering the different timeframes, chart settings, StochClose, RSI and StochRSI.
Aerospace & Defense ETF Fails to Follow Through (PPA)
The Aerospace & Defense ETFs seem like obvious beneficiaries from a increase in defense spending, which also seems inevitable because stock piles are being used up. We have to be careful with the “obvious” sometimes. The Stockholm International Peace Research Institute estimates that Russia spent $66 billion on defense in 2021. The US spent some $753 billion in 2021 and other NATO members spent another $363 billion. The 2022 estimate is $779 billion and the 2023 estimate is $808 billion, hardly stellar growth rates. The spending is pretty much guaranteed and relatively immune to the economic cycle. The revenues will be there, but, the input costs for the defense industry are not immune to inflation.
There are dozens of variables at the work within any industry and the price charts distill these variables into a value. The chart below shows the Aerospace & Defense ETF (PPA) ranging from 80 to 65 over the past year (15 points). Calculating from the midpoint (72.5), this 15 point range is just 20%, which is relatively subdued. The corresponding SPY range is 31% (480 to 350). PPA is a lot less volatile than the broader market.
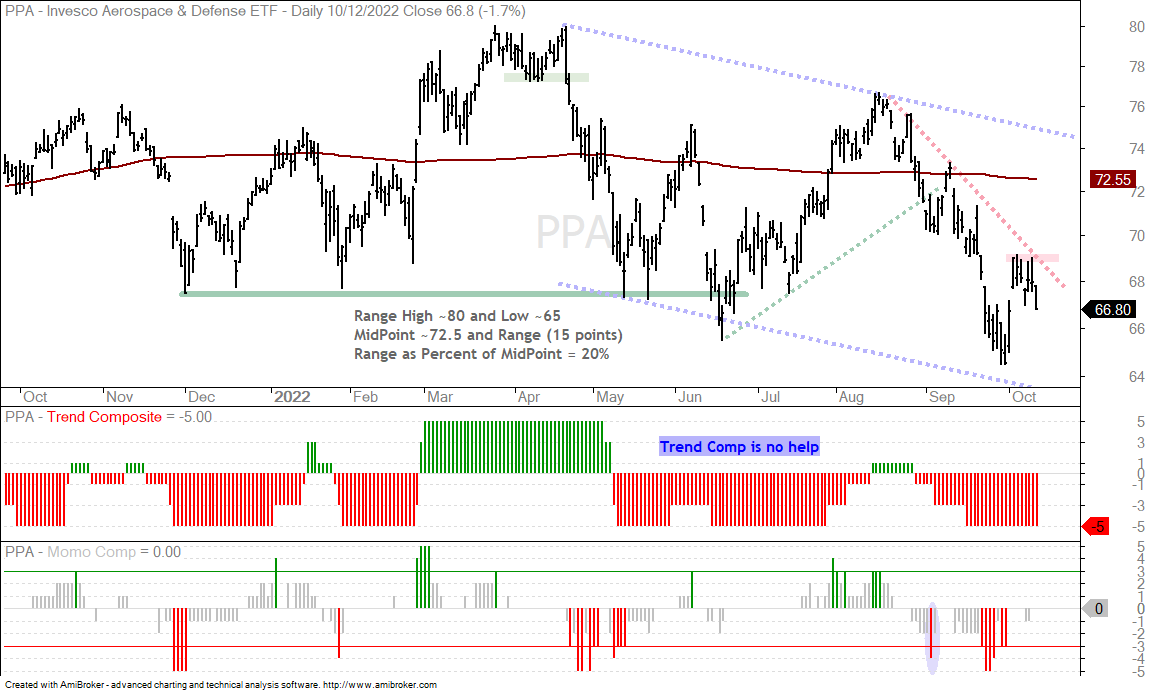
There is more downtrend than uptrend on this chart as PPA broke its winter lows in June, formed a lower high from May to August and broke its summer lows in September. The blue dashed lines mark a falling channel since May. The swing within this channel is down since August, but PPA caught my eye because it is holding up a little better over the last two weeks. The ETF surged in early October, stalled and remains well above the September low. A follow through move is now needed and a break above the early October highs would reverse this downswing.
Coffee ETF Breaks Down (JO)
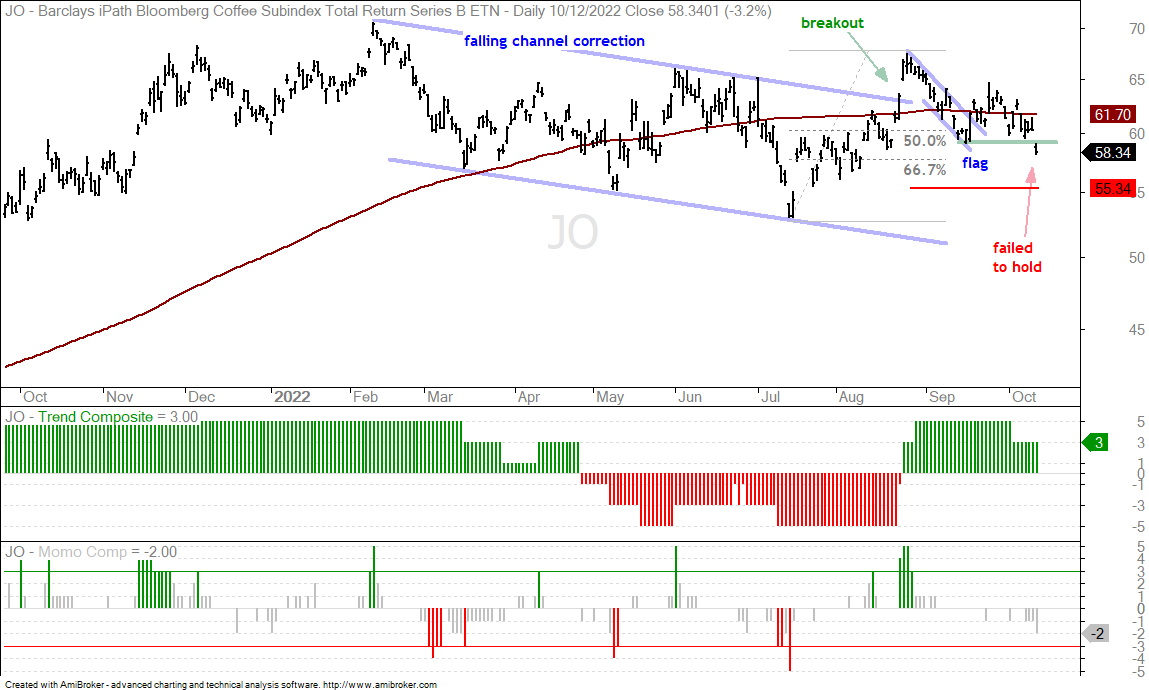
The Coffee ETF (JO) failed to hold its flag breakout and plunged below the mid September low with a 3.2% decline. Overall, it looks like the bigger falling channel breakout also failed and the ETF failed near the 200-day SMA, which turned down the last two weeks. Even though the Trend Composite remains positive and JO is above the ATR Trailing Stop, the ETF did not follow through and I view this failure as bearish.
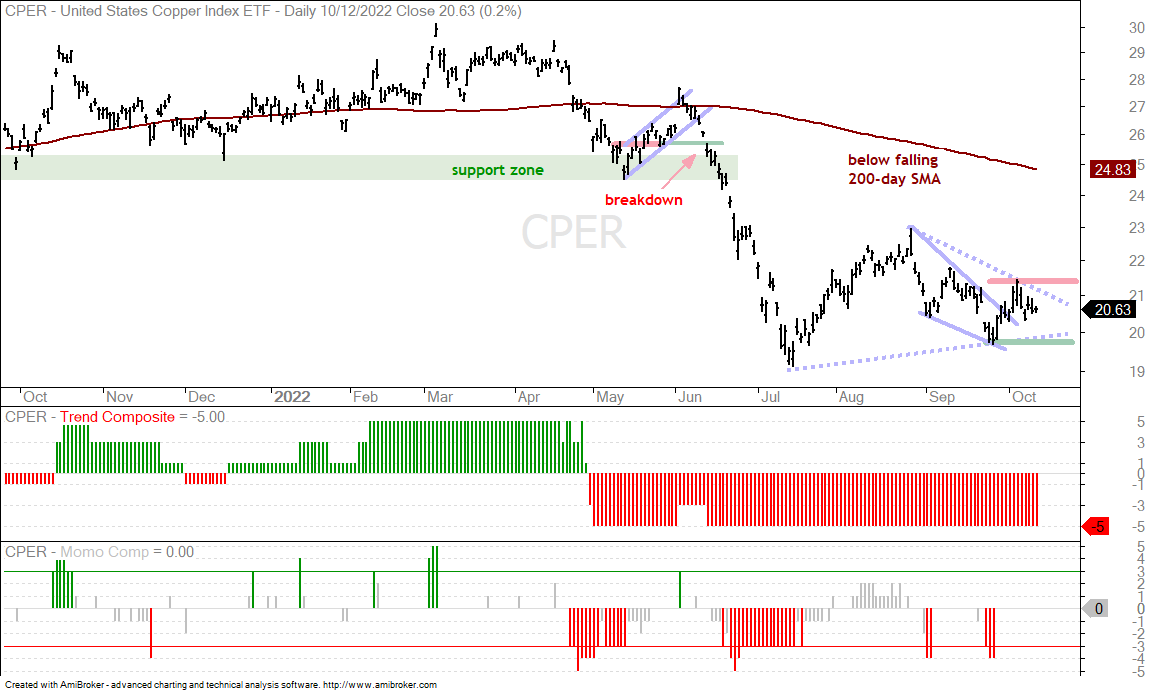
Copper Futures Breaks Wedge Line (COPPER1!, CPER)
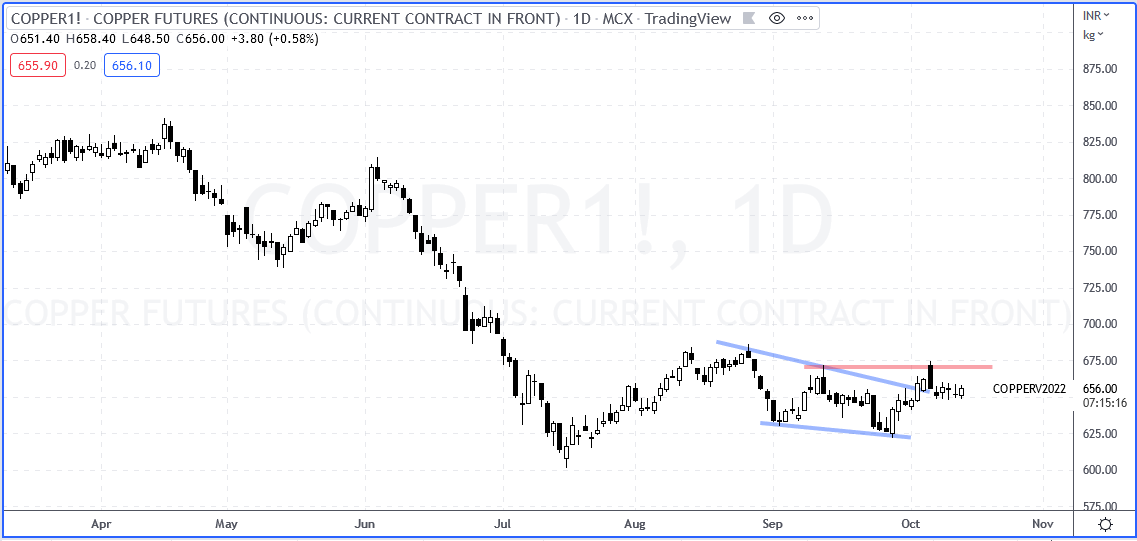
Copper Futures (COPPER1!) held up relatively well from July to September and over the last three weeks. The first chart shows Copper Futures with a falling wedge from mid August to late September (blue lines) and a break above the upper line in early October. Copper stalled after this breakout with closing prices remaining in stuck in the 656 area. A follow through breakout at 675 would be medium-term bullish.
The next chart shows the Copper ETF (CPER) in a long-term downtrend: below falling 200-day and negative Trend Composite. The dashed lines mark a possible triangle, which is a bearish continuation pattern that marks a consolidation within a bigger downtrend. As such, a break below the September low would signal a continuation lower. Triangles sometimes mark reversals though. The swing within the pattern was down (falling wedge) and CPER broke the wedge line in early October. A follow through breakout at 21.5 would be medium-term bullish. I say medium-term bullish because this pattern covers weeks and the long-term trend is still down.
Gold Miners Breadth Gets a Boost (GLD, GDX)
The Gold SPDR (GLD) and the Gold Miners ETF (GDX) are in downtrends, but buying interest in GDX stocks is perking up. First, note that GLD and GDX are joined at the hip. They will move in the same direction. Second, note that GDX is more volatile than GLD, which means bigger gains and bigger losses. The first chart shows GLD with a 6% surge in late September and early October, a reaction high (peak) around 161 in early October and a 50-67% retracement with the decline over the last six days. If GLD is going to reverse and attempt to break the red resistance zone, then this is the place.
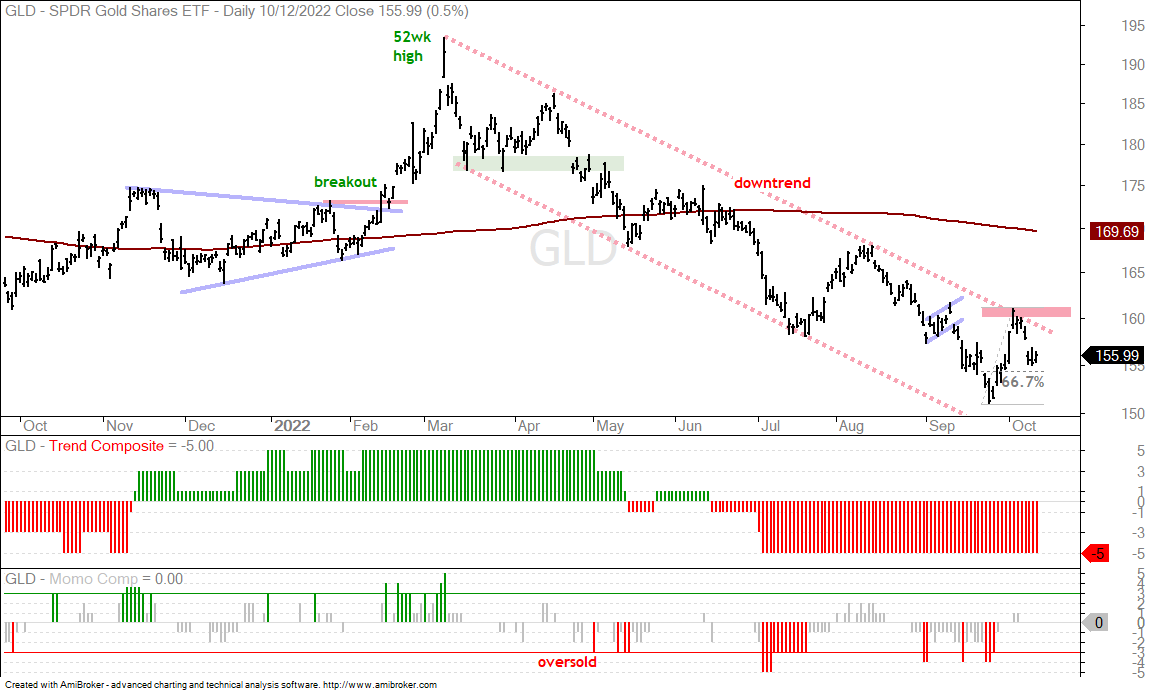
A lot will depend on the Dollar. The 6% surge in GLD occurred when the Dollar Bullish ETF (UUP) fell 3.5% in five days. This was a pullback within a bigger uptrend and the trend is still up for the Dollar. UUP is still extended and could correct back to the 29 area or even consolidate. Predicting a correction within a strong uptrend is quite the challenge though.
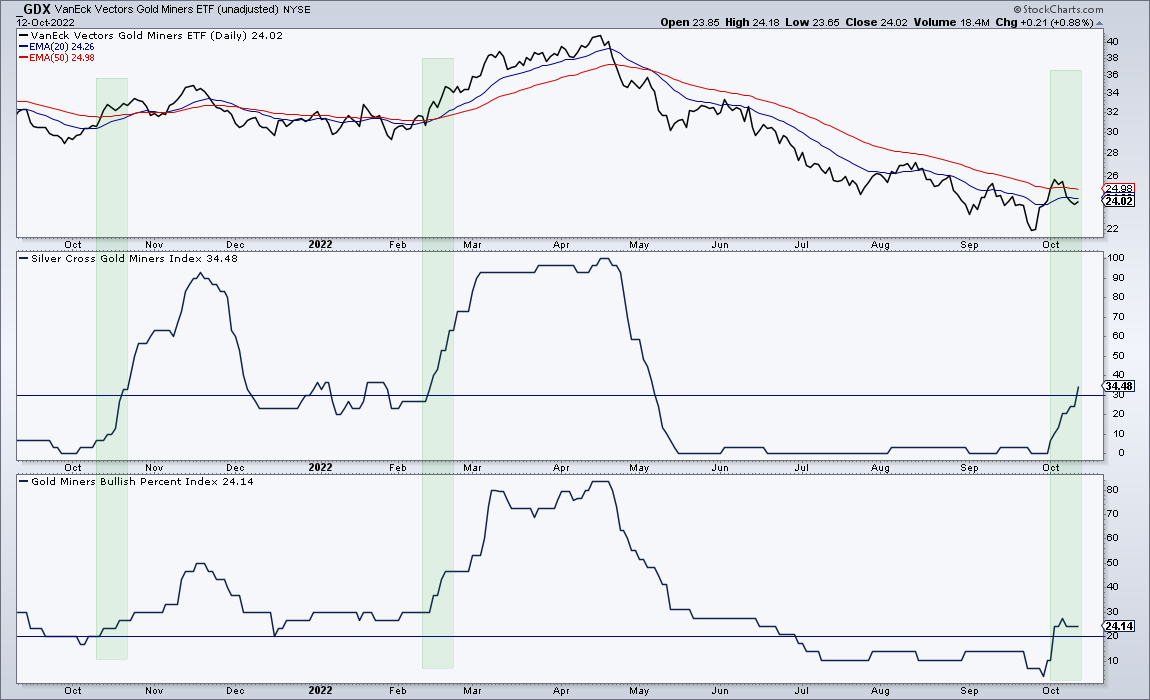
The next chart shows the Gold Miners ETF (GDX) with two breadth indicators. Silver Cross Percent measures the percentage of GDX stocks with the 20-day EMA above the 50-day SMA. Bullish Percent shows the percentage of GDX stocks with P&F buy signals (double top breakouts). The green shading shows when there is a strong up move in the Silver Cross indicator (middle window). This occurred over the last three weeks and Bullish Percent is above 20% for the first time since June. Perhaps something is going on under the surface here.
Previous Reports and Video
Wednesday: Market and ETF Video (here [5])
- Composite Breadth Model Remains Bearish
- Fed Balance Sheet Extends Contraction Trend
- CCC and BBB Spreads Continue to Show Stress
- Junk Bond ETF hits New Low
- TLT hits New Low as 10yr Yield Nears 4%
- Dollar Bullish ETF Turns Up after Short Pullback
- Oil Hits Resistance from Broken Support
- Gold Forms Another Lower High (Downtrend)
- DB Base Metals ETF in Long-term and Short-term Downtrend
- DB Agriculture ETF Holds August Low and Slight Uptrend
- Only 10 (3.6%) of 274 ETFs in Uptrends
- Correlations Remain High the Last 4 and 40 Days
- SPY Near New Low as QQQ Hits New Low (plus IWM)
- High Beta and Low Volatility ETFs Hit New Lows (SPHB, SPLV)
- Tech, Finance, Comms, Utes, Staples and REITs Lead Sectors with New Lows
- New Lows for Semis, Software and Cyber-Security (short-term oversold)
- Home Construction ETF Shows Short-term Relative Strength (ITB)
- Biotech SPDR Holds after Normal Pullback (XBI, IBB)
- Aerospace & Defense ETFs Surge and Consolidate (PPA, ITA)
- Clean Energy ETFs Affected by Bear Market (TAN, QCLN, ACES)
- Crude Oil Hits Resistance at Broken Support (CL1!, DBE, DBC)
- Energy ETFs Hit Short-term Resistance Zones (XLE, FCG, XOP)
- Wheat Lifts DB Agriculture ETF (WEAT, DBA)
- Corn Remains Strong as Soybeans Weaken (CORN, SOYB)
- Coffee ETF Struggles to Hold Breakout (JO)
Wednesday: Market Regime Update with Breadth Model and Yield Spreads (here [6])
Tuesday: Market and ETF Report (here [7])
- Topics Covered in Tuesday’s Market and ETF Report
- Stocks Pop-Drop as Yields-Dollar Drop-Pop
- Composite Breadth Model Remains Bearish
- Very Few ETFs in Uptrends
- Correlations Remain High (all down)
- SPY Near New Low as QQQ Hits New Low (plus IWM)
- Crude Oil Hits Resistance at Broken Support (CL1!, DBE, DBC)
- Energy ETFs Hit Short-term Resistance Zones (XLE, FCG, XOP)
- Clean Energy ETFs Affected by Bear Market (TAN, QCLN, ACES)
- Biotech SPDR Holds after Normal Pullback (XBI, IBB)
- Wheat Lifts DB Agriculture ETF (WEAT, DBA)
- Corn Remains Strong as Soybeans Weaken (CORN, SOYB)
- Coffee ETF Falls Back below 200-day (JO)
You can learn more about my chart strategy in this article [4] covering the different timeframes, chart settings, StochClose, RSI and StochRSI.