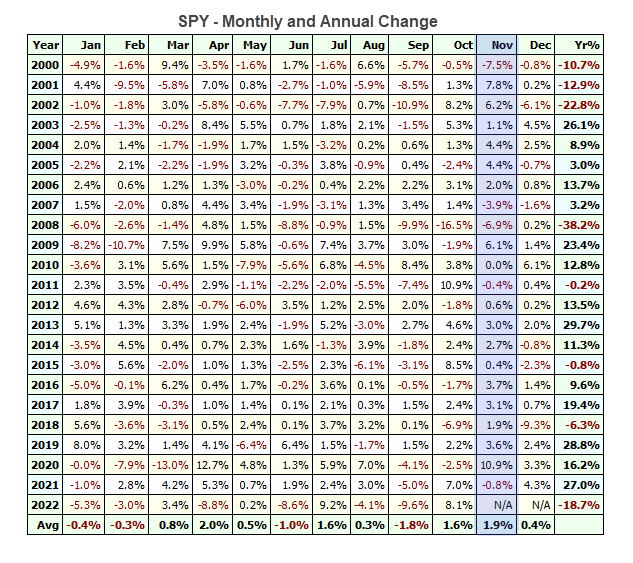
The Market Regime remains bearish, but there is a non-technical argument for a counter-trend bounce or perhaps a trading range in stocks. I say non-technical because this argument is not based on the price charts. We are in a seasonally bullish period of the year. Historically, November is the second strongest month (April is the strongest). Since 2000, stocks closed higher 17 times and lower just 5 times and the average gain was 1.9%. The table below shows the monthly changes for SPY since 2000 with November highlighted blue.
The data for this table is from 1/1/2000 to 10/31/2022. The column on the far right shows the annual change in SPY. Notice that SPY was down double digits in 2000, 2001, 2002, 2008 and now 2022. The prior double digit declines were part of a bear market and we are in a bear market right now. Making profits in a bear market is tough, if not near impossible.
There is also a second argument for a counter-trend bounce, but picking direction based on the election results is pretty much a coin flip. Republicans are strong favorites to win the House and favorites to win the Senate. This would result in split government and no new legislation, which Wall Street likes. Wall Street is not expecting the Democrats to perform well so unexpected results could rattle the market.
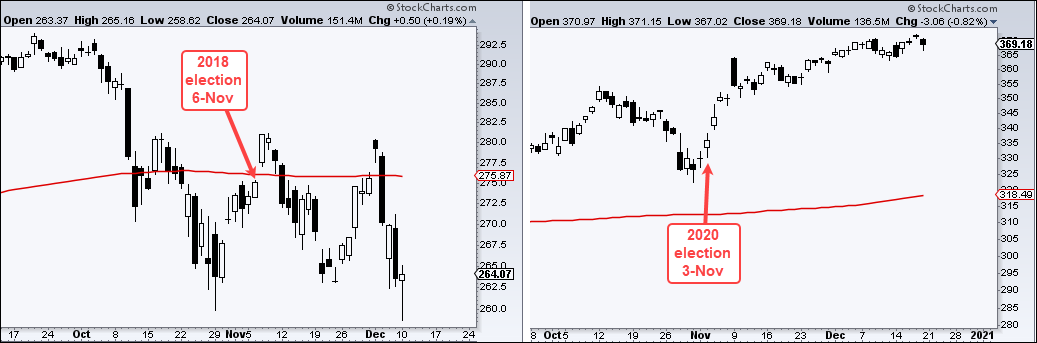
Previously, stocks advanced the day after the last two elections. 2018 election day was November 6th and stocks were up 2.14% on November 7th. 2020 election day was November 3rd and stocks were up 2.23% on November 4th. Notice that SPY was mostly below its 200-day SMA in October 2018 (bearish bias) and above its 200-day in October 2020 (bullish bias). SPY is currently below its 200-day so I remain with a bearish bias.
About the ETF Trends, Patterns and Setups Report
This report contains discretionary chart analysis based on my interpretation of the price charts. This is different from the fully systematic approach in the Trend Composite strategy series. In this ETF Trends, Patterns and Setups report, I am looking for leading uptrends and tradable setups within these uptrends. While I use indicators to help define the trend and identify oversold conditions within uptrends, the assessments are mostly based on price action and the price chart (higher highs, higher lows, patterns in play). Sometimes the chart assessment can be at odds with the indicators.
This Week's Commentary Schedule
Tuesday – 8 November: Market-ETF Report and Signal-Rank Table Update
Wednesday – 9 November Market-ETF Video and Market Regime Update
Thursday – 10 November: Market-ETF Report and Signal-Rank Table Update
Saturday – 12 November: ETF Signal and Rank Table
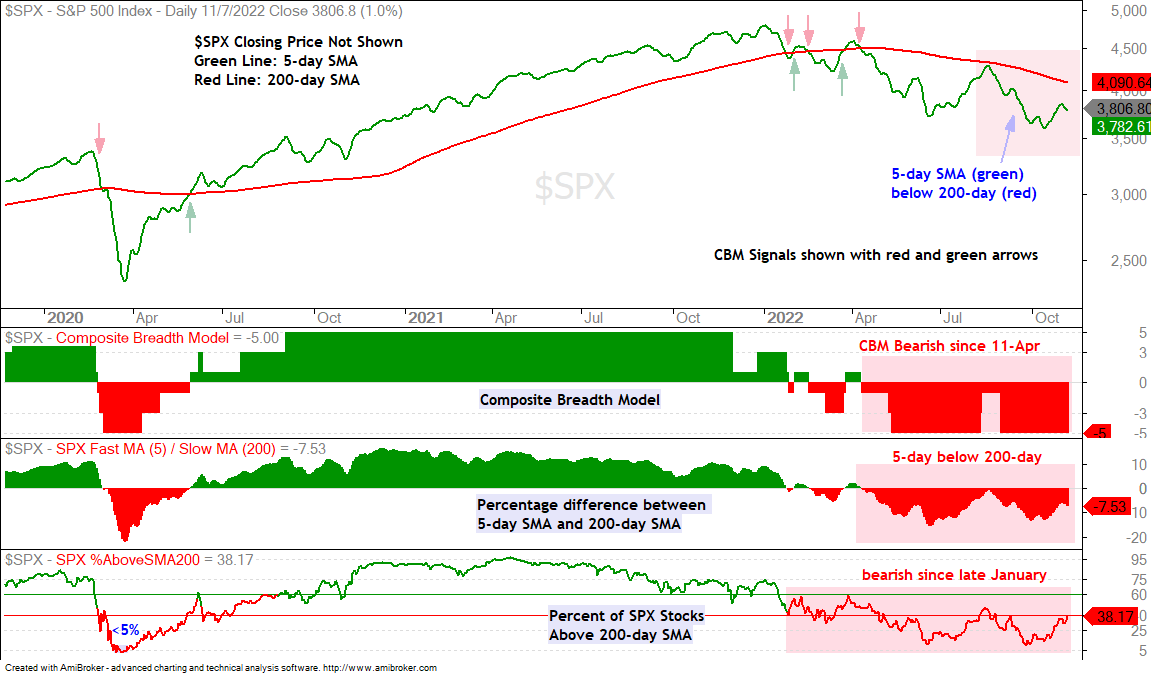
Composite Breadth Model Remains Bearish
The Composite Breadth Model (CBM) remains at -5, which means all five inputs are bearish. The 5-day SMA for the S&P 500 (green line) is 7.5% below the falling 200-day SMA (red line) and around 62% of S&P 500 stocks are below their 200-day SMAs (38% above). SPX %Above 200-day SMA fluctuates and improves when the S&P 500 bounces (bottom window). In bear markets, however, it tends to top out in the 40-50 percent area. A move above 60% is needed to show broad enough strength within the index to consider turning bullish again.
You can learn more about my chart strategy in this article[1] covering the different timeframes, chart settings, StochClose, RSI and StochRSI.
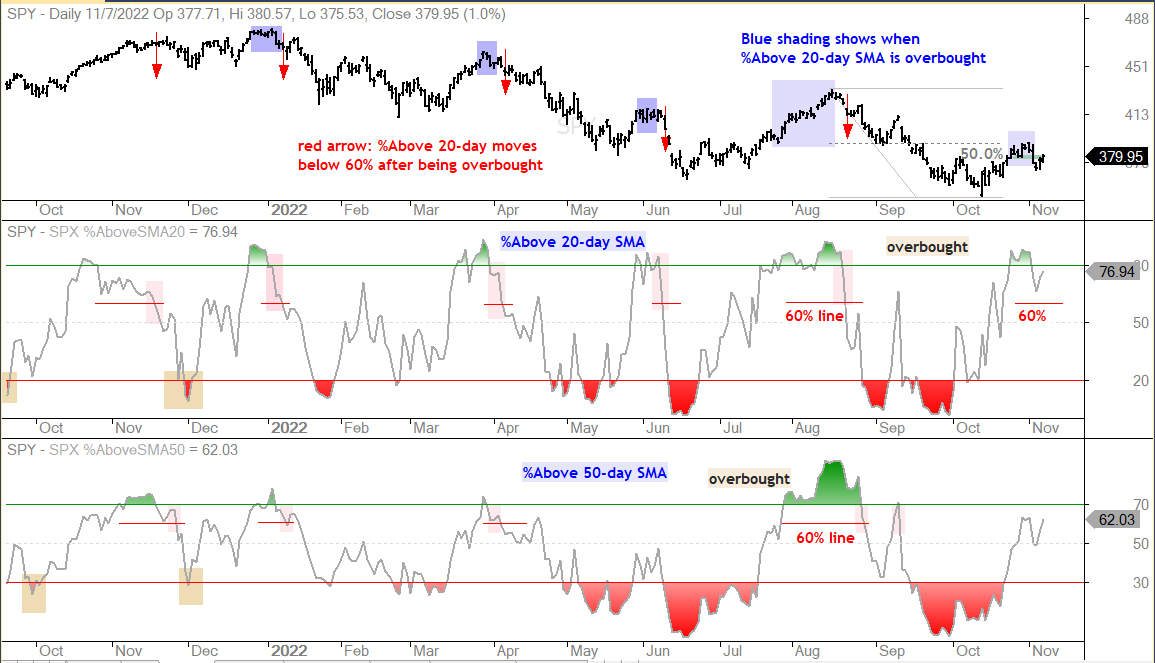
SPX %Above 20-day SMA Holds Up
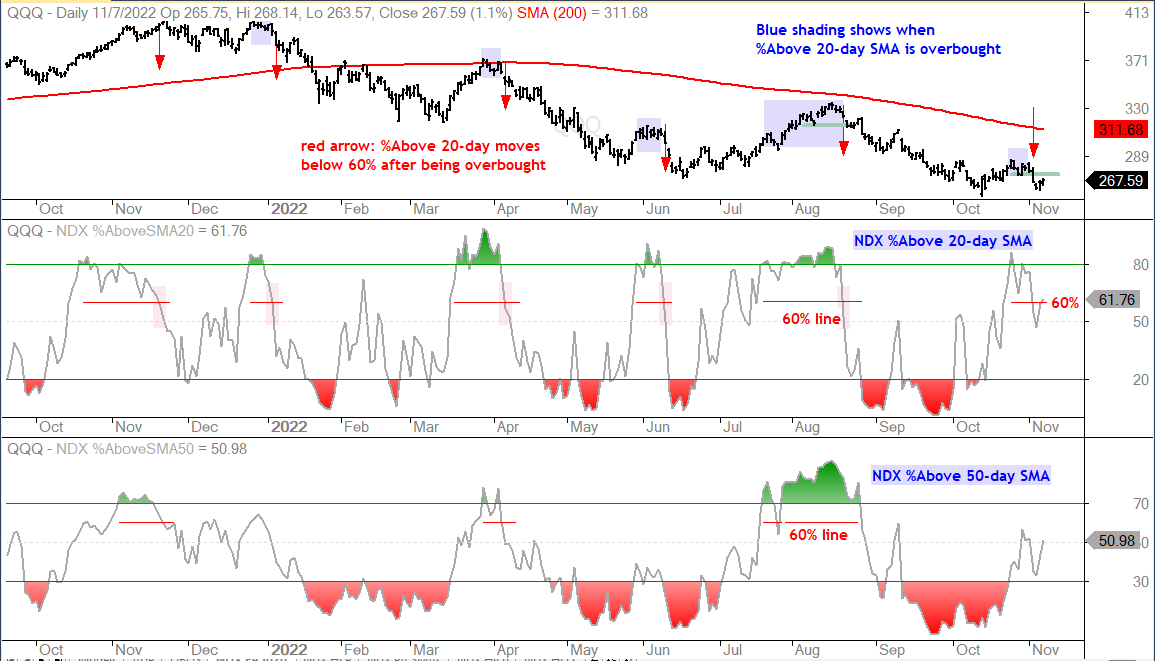
The S&P 500 %Above 20-day SMA indicator became overbought in late October with a move above 80% and fell back below 80% with the sharp decline in early November. This move did not break 60% to turn the indicator bearish again, but SPY did break short-term support after a bounce that retraced 50% of the August-October decline. This move reversed the short-term uptrend on the price chart. The next confirmation would come with a move below 60% in SPX %Above 20-day SMA.
The next chart shows NDX %Above 20-day SMA moving below 60% last week to confirm the short-term reversal in QQQ (Nasdaq 100). The move below 60% also shows more weakness within the Nasdaq 100 and this is a negative for the S&P 500 because stocks in the Nasdaq 100 account for around 35% of the S&P 500.
QQQ Leads Lower as IWM OutPerforms
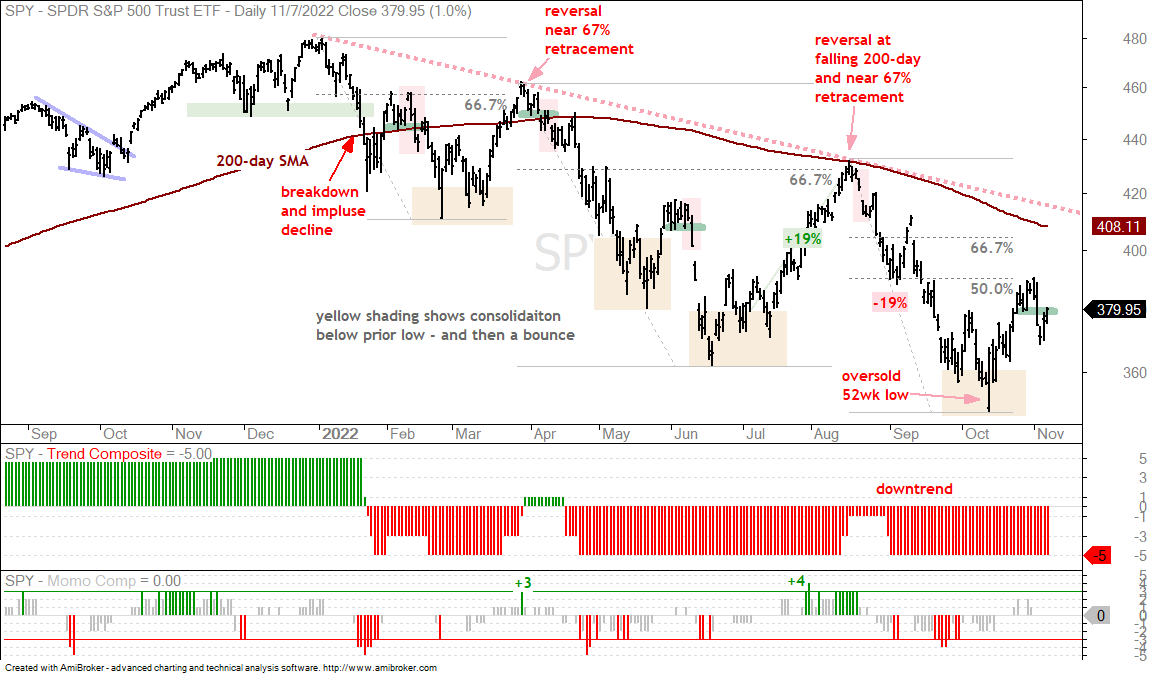
The S&P 500 SPDR (SPY) remains in a long-term downtrend with a 52-week low in October and a series of lower lows and lower highs this year (red dashed line). SPY became oversold in late September and early October, and then bounced with a move to the 390 area into late October. This short-term uptrend reversed with last week’s support break (green line). I expect a new 52-week low at some point, but the path is less clear because volatility remains high and we could see some wild moves with the midterm elections on Tuesday.
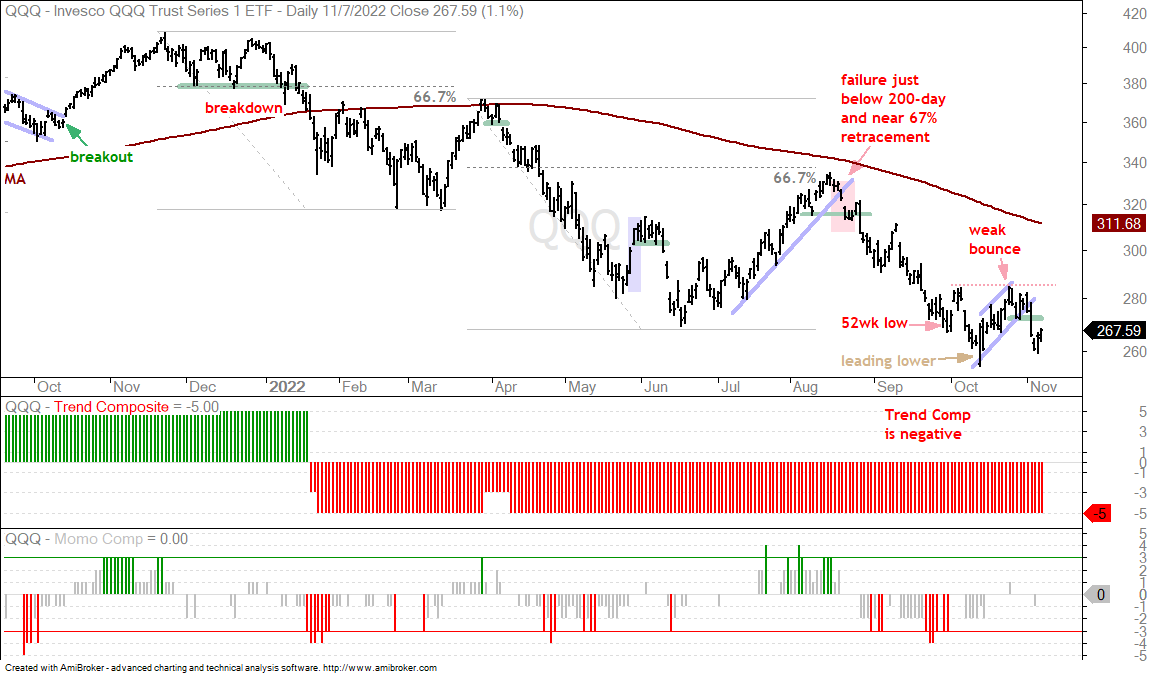
QQQ continues to lag SPY and even recorded a 52-week closing low on Thursday. The 52-week intraday low occurred with the open below 260 on October 13th. The long-term trend is clearly down as QQQ trades well below the falling 200-day SMA and the Trend Composite is negative. The bounce into late October was weak and last week’s decline was sharper than the decline seen in SPY.
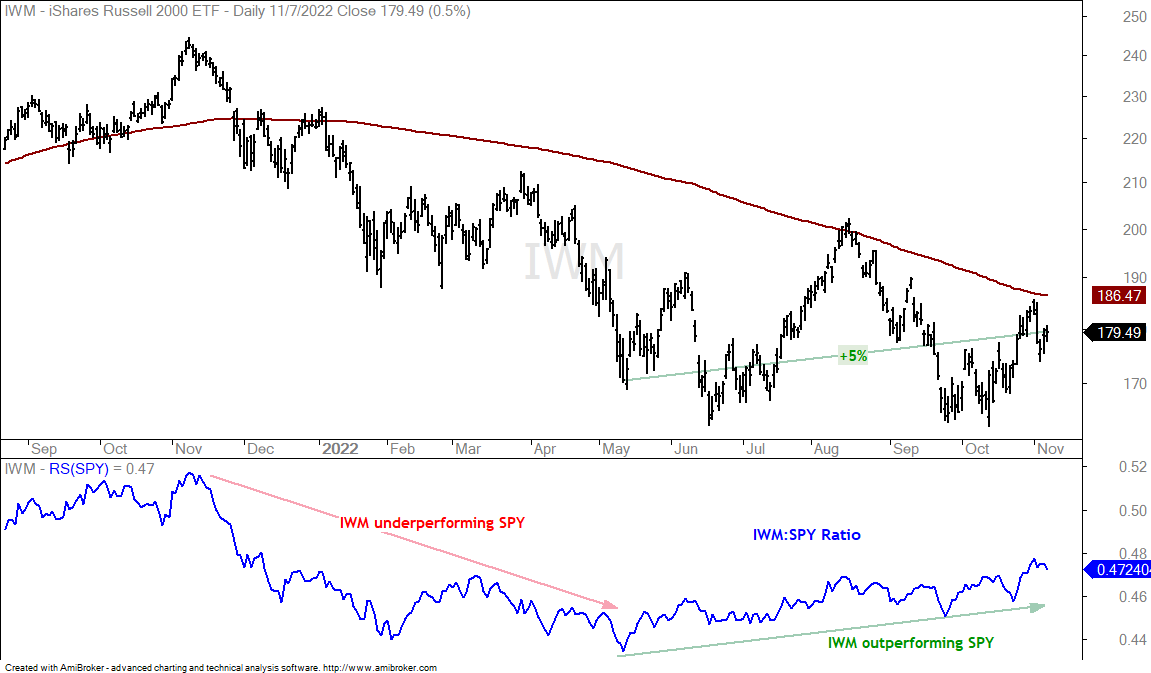
The Russell 2000 ETF (IWM) is holding up better than SPY and QQQ. In fact, IWM has been outperforming SPY since mid May. IWM is up around 5% since the mid May low, while SPY is down around 2% and QQQ is down 6%. The 11% performance differential with QQQ is quite stark. Small-caps are showing relative strength and even some absolute strength since mid May. Even so, IWM remains in a long-term downtrend and just below the falling 200-day SMA.
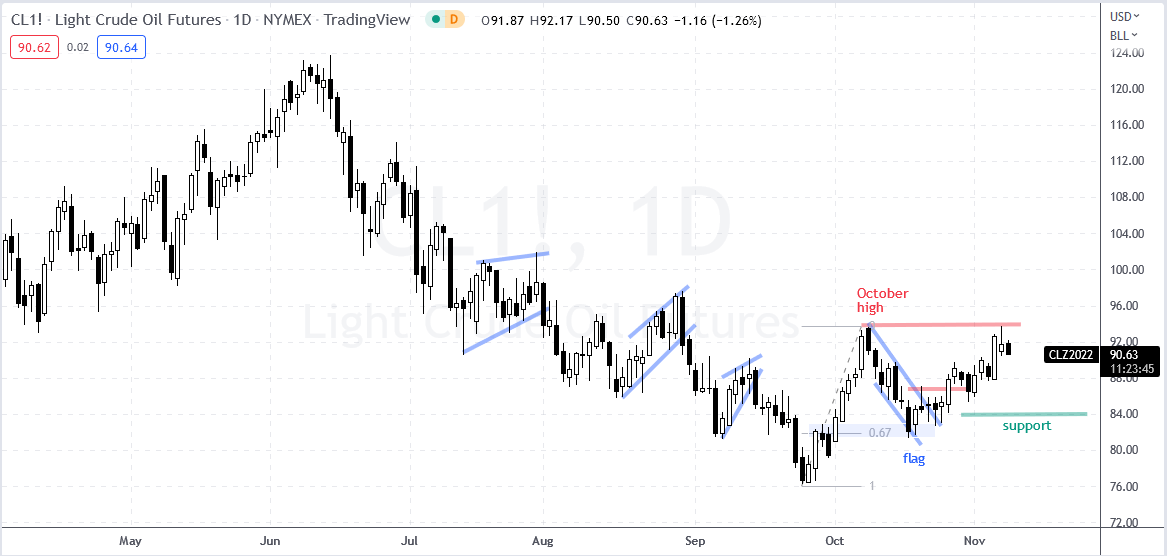
Oil Challenges October High (CL1!, DBE)
Technically, oil is in a downtrend with a series of lower lows and lower highs since summer. The September low around 76 is below the August low and the October high (94) is below the August high (98). The bulls started making noise with a 20+ percent surge from 76 to 94, a falling flag into mid October that retraced 67% and a flag breakout in late October. Oil is now challenging the October high (red line around 94). A break above this high would forge a higher high and signal the start of an uptrend. Shorter term, oil extended on the flag breakout and remains strong. I am setting support at 84 and would turn bearish on a break below this level.
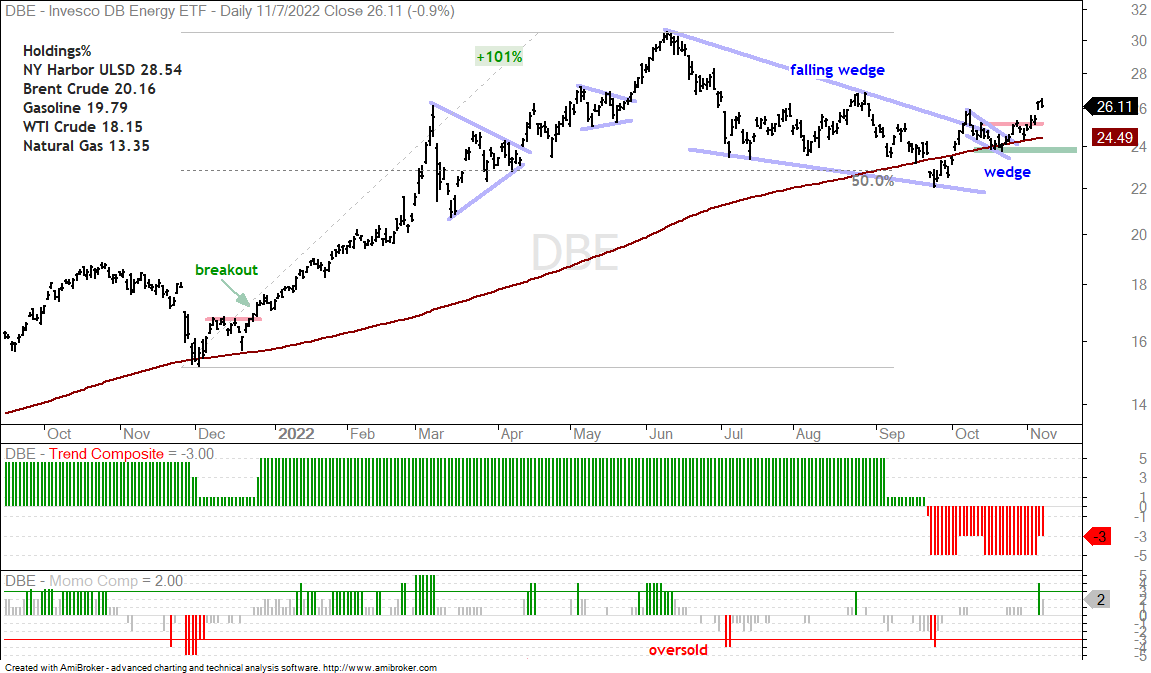
The next chart shows the DB Energy ETF (DBE) breaking out of a big falling wedge and a small falling wedge. The big falling wedge represents a correction after the 101% advance and the breakout signals a continuation of that move. The small wedge represents a short pullback after the surge from late September to early October. Even though the Trend Composite remains negative, DBE is above the rising 200-day and these wedge breakouts are bullish. The October low marks first support.
You can learn more about exit strategies in this post[2], which includes a video and charting options for everyone.
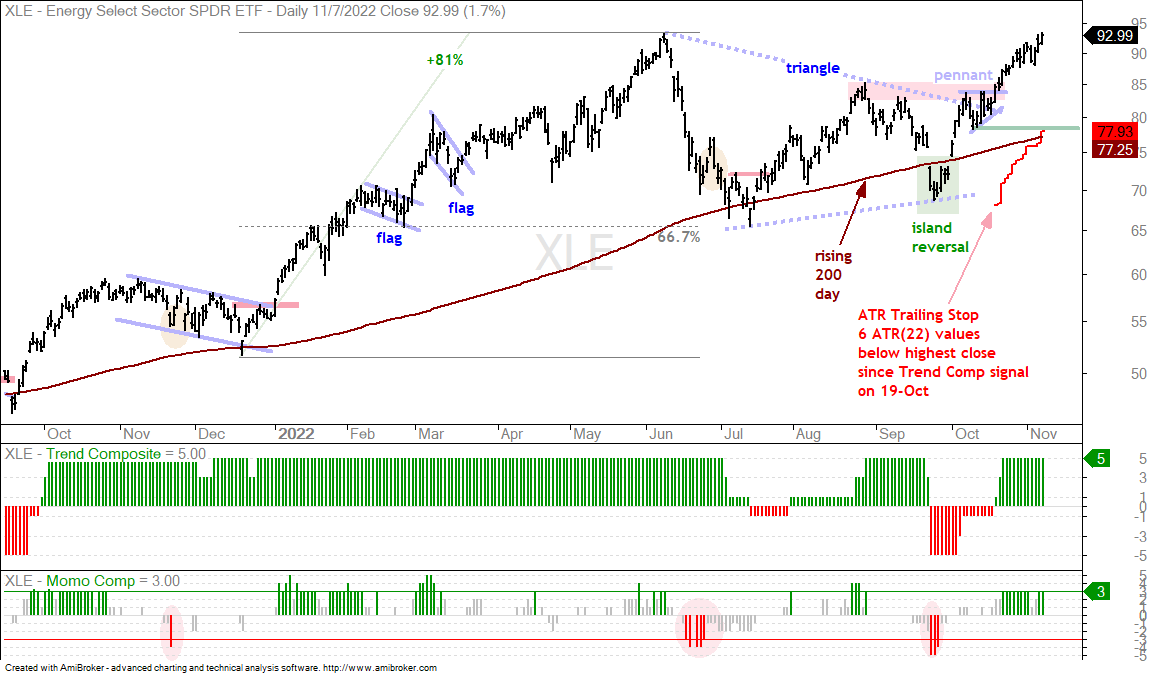
Energy ETFs Extend on Triangle Breakouts
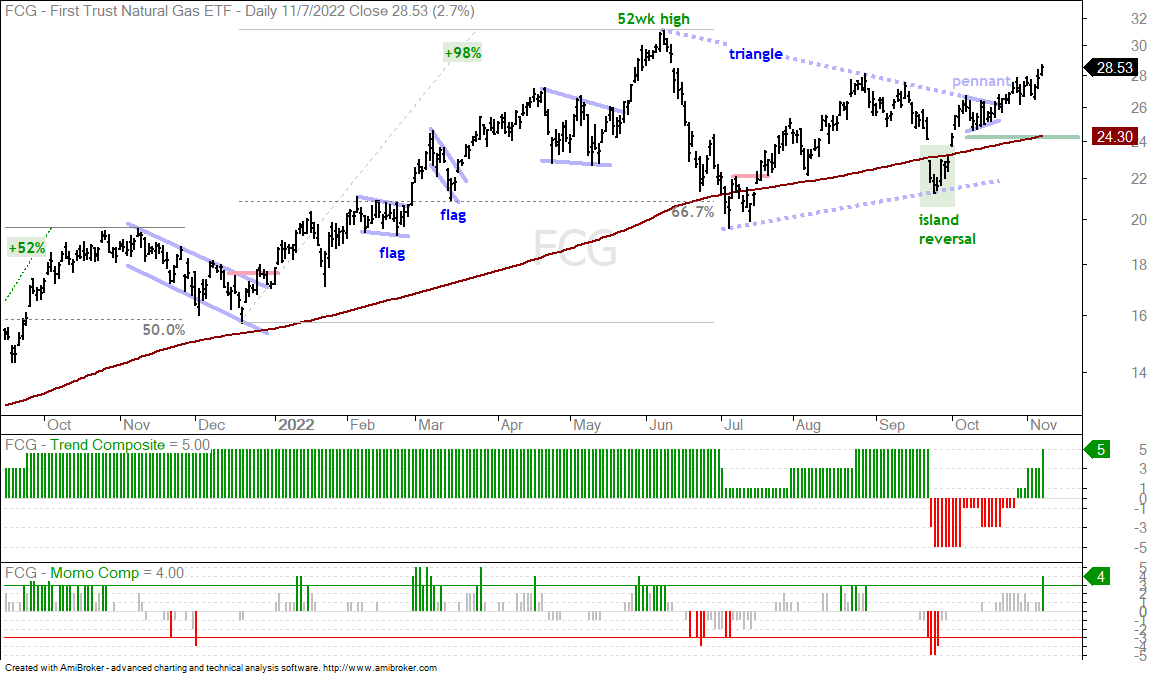
The Energy SPDR (XLE), Oil & Gas Exploration & Production ETF (XOP) and Natural Gas ETF (FCG) are leading the market and have similar chart characteristics. First, XLE is the only sector that hit a 52-week closing high in November. The chart shows a big surge (81%), a big triangle and a triangle breakout in mid October. XLE and the others also formed small pennants in mid October and there were short-term breakouts. The pennant lows mark first support to watch going forward. A close below this low would put prices back within the bigger triangle and call for a re-evaluation.
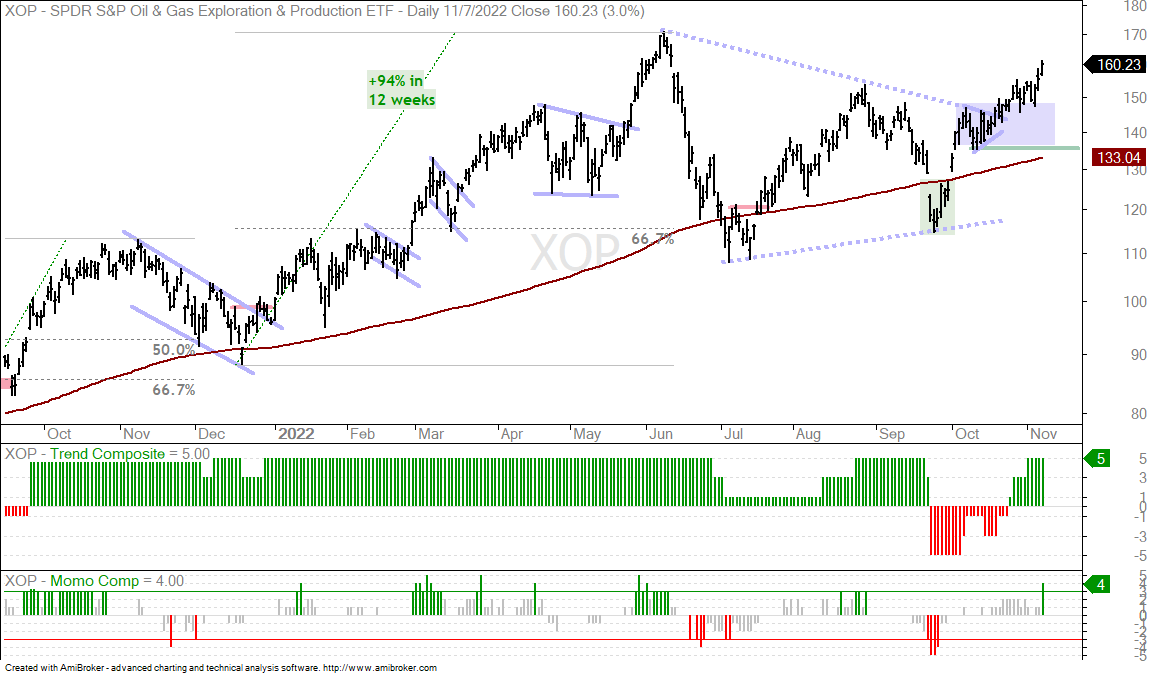
The next chart shows XOP exceeding its August high with a surge the last three days. The pennant low marks first support at 135.
The next chart shows FCG with support marked at 24, which is also the rising 200-day SMA.
You can learn more about exit strategies in this post[2], which includes a video and charting options for everyone.
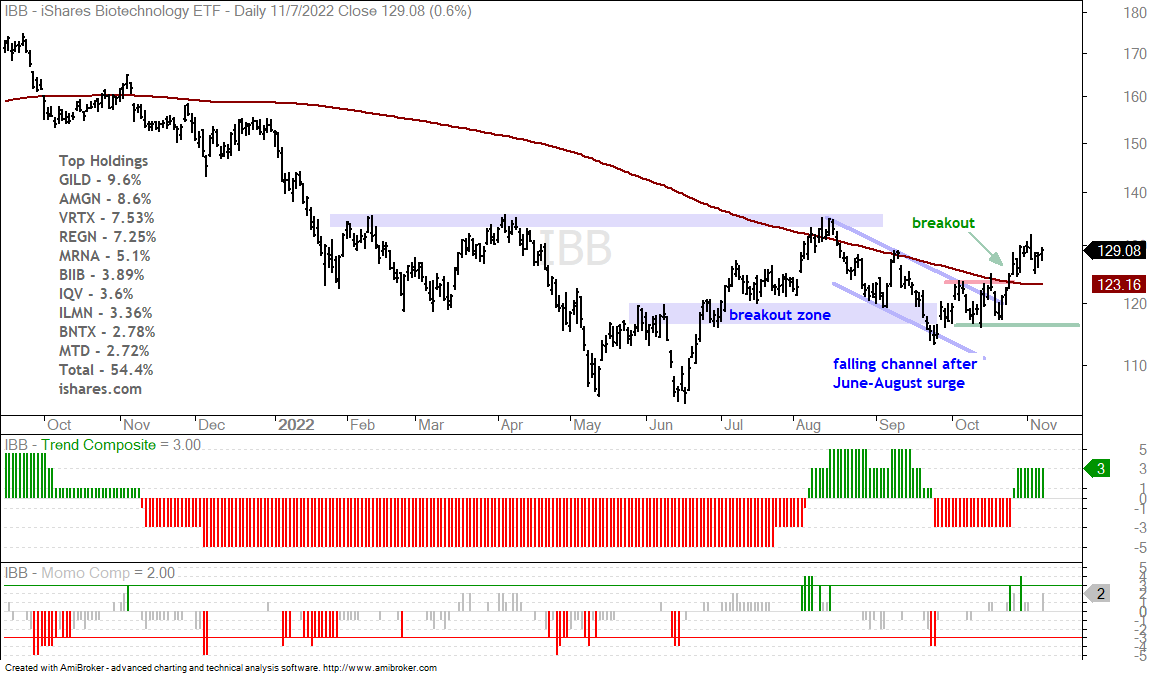
IBB Holds Breakout as XBI Stalls
The Biotech ETF (IBB) continues to lead the Biotech SPDR (XBI). IBB broke out of a falling channel with a surge in late October and exceeded the 200-day SMA. The Trend Composite also turned positive in late October. Support is based on the October lows and a close below this level would argue for a re-evaluation. Note that IBB is holding up much better than SPY because it forged a higher low from June to September and SPY remains well below its 200-day SMA.
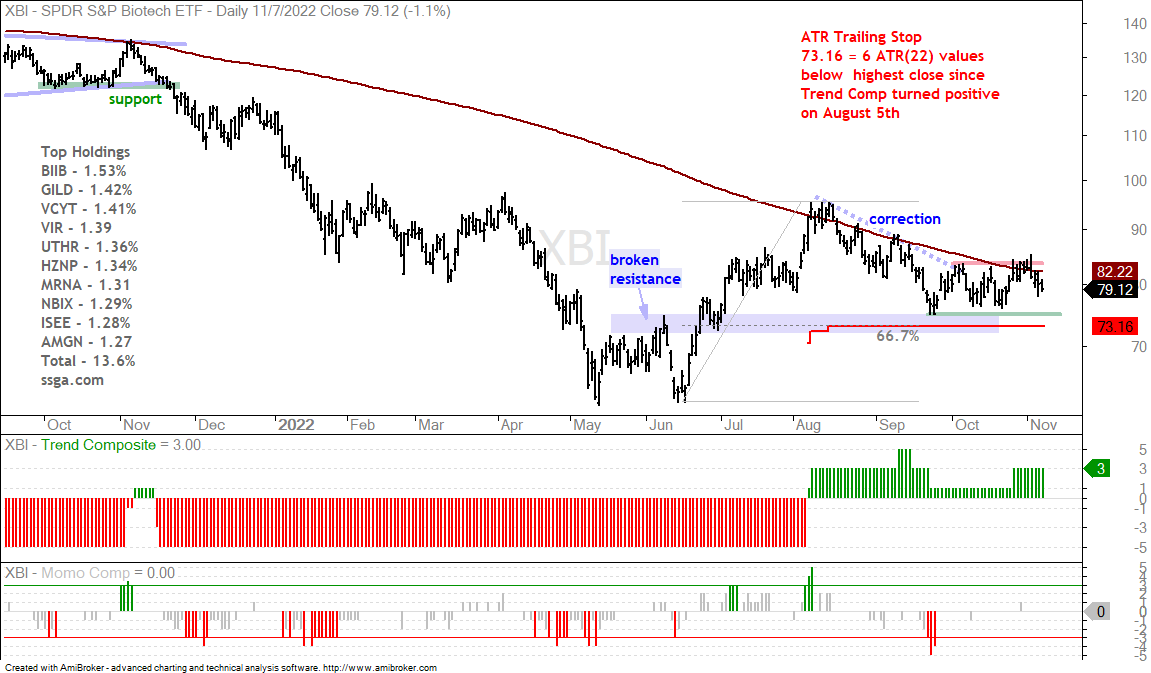
The next chart shows the Biotech SPDR (XBI) falling into late September and finding support near the breakout zone (blue shading). This decline also retraced 50 to 67 percent of the June-August advance. XBI found support into October, but could not break out and simply stalled the last six weeks. The inability to break out along with IBB is a concern here. A break below the green support line would be bearish and likely trigger the ATR Trailing Stop.
The Trend Composite aggregates signals in five trend indicators: Bollinger Bands (125,1), Keltner Channels (125,2), 5-day Rate-of-Change of 125-day SMA, StochClose (125,5) and CCI-Close (125). The Trend Composite and ten other indicators are part of the TIP Indicator Edge Plugin for StockCharts ACP[3]
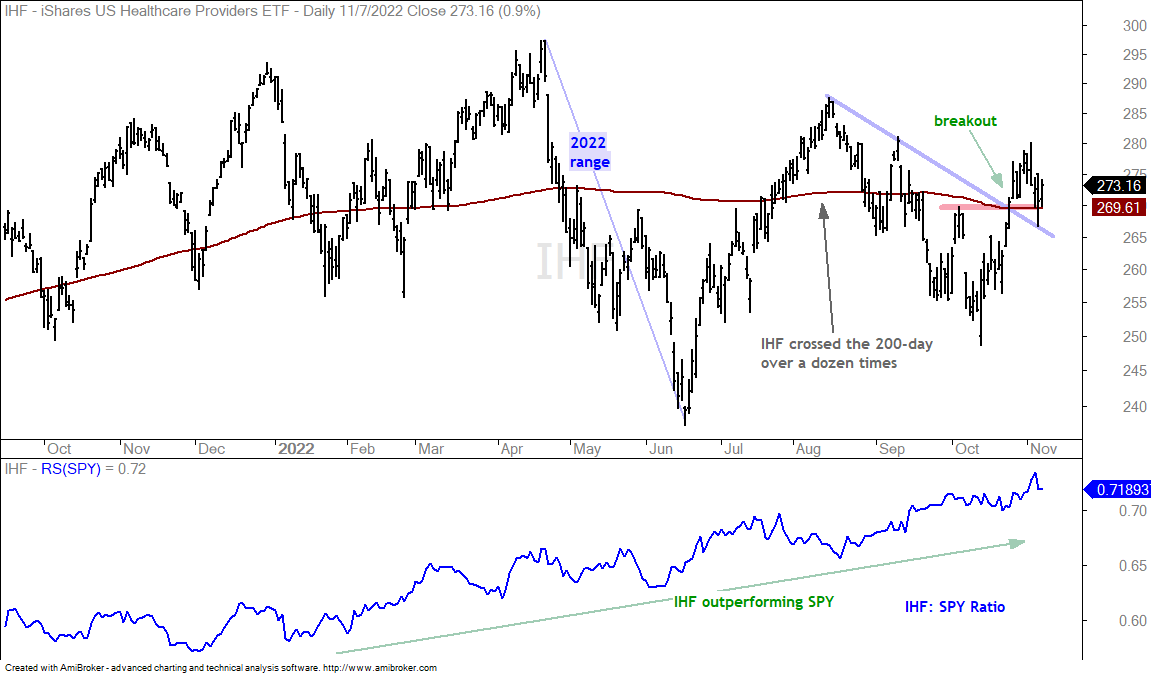
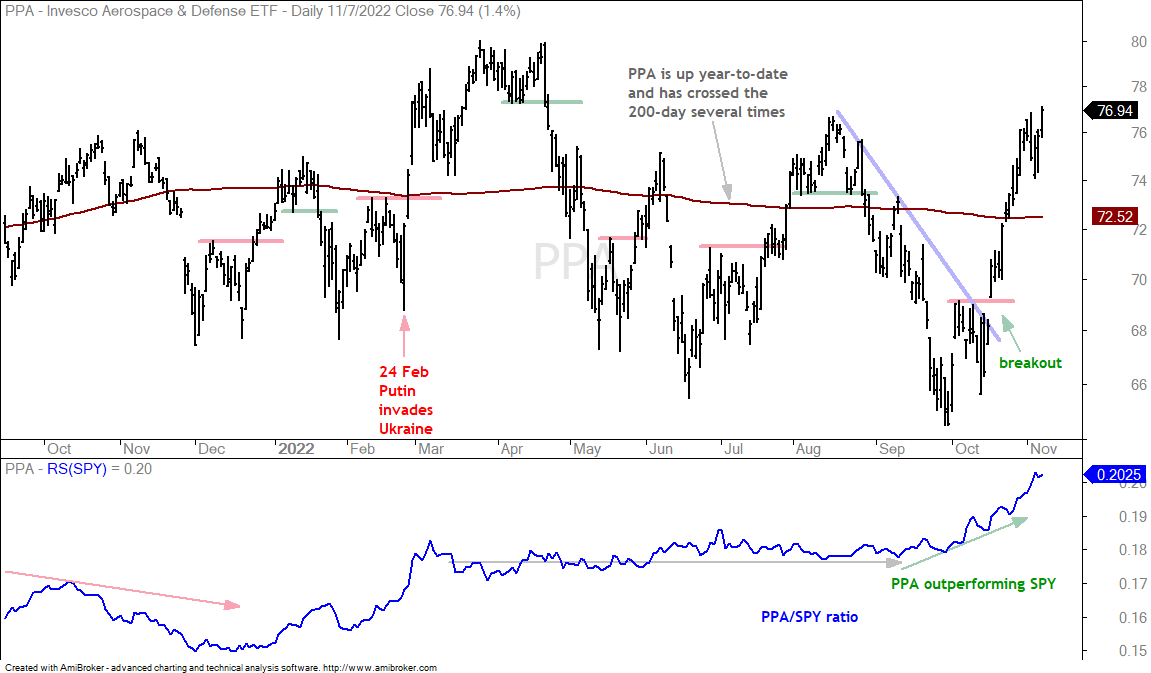
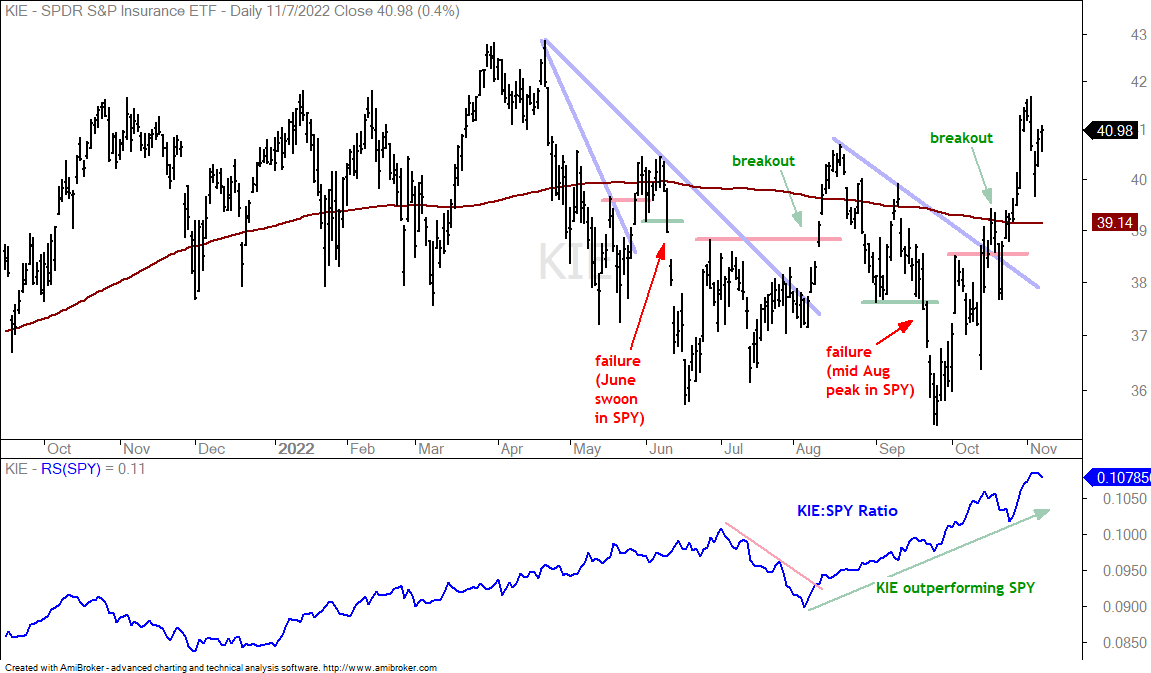
ETFs with a Half Full Cup (XLV, IHF, PPA, KIE)
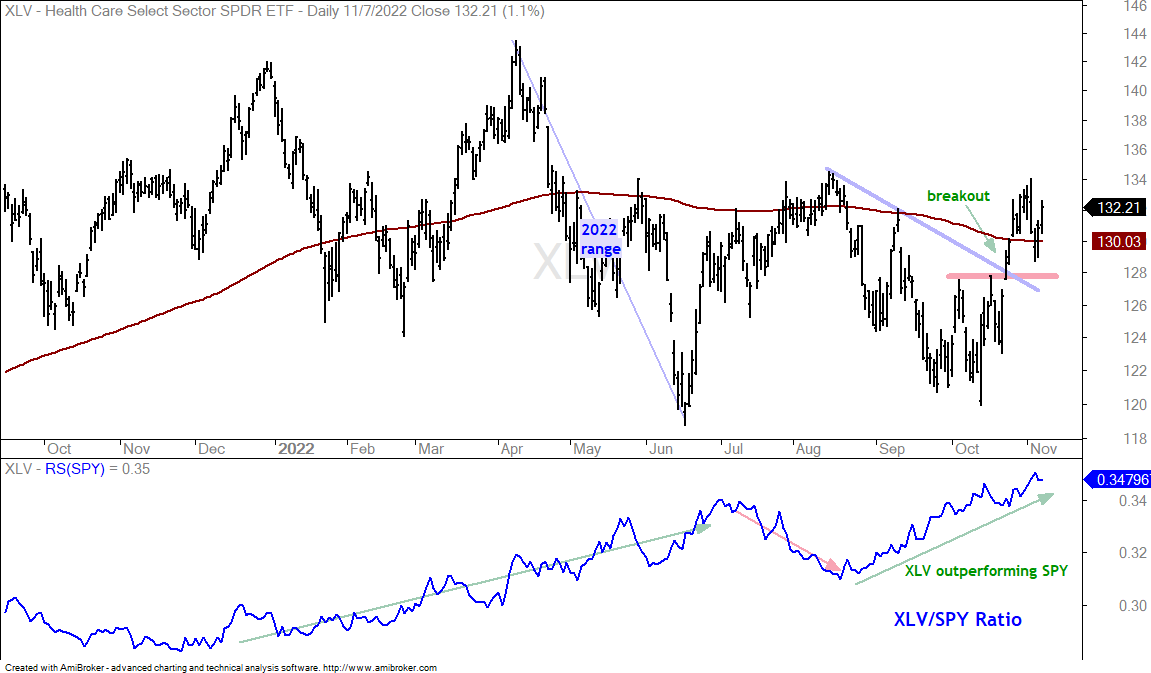
There are number of “the cup is half full” ETFs that are holding up much better than the broader market here in 2022 and are above their 200-day SMAs right now. Their price-relatives also hit new highs (e.g. XLV:SPY ratio). In addition, these ETFs led the market from late September to early November with breakouts that reversed their downswings. The first chart shows XLV trading between 144 and 118 this year and currently around 132. Analytically, the only thing we can do is identify the swings within the range and look for swing reversals. The ETF broke resistance with a surge in late October to reverse the August-October downswing and this breakout is holding. The lower window shows the price-relative (XLV:SPY ratio) hitting a new high in early November.
The next chart shows the Healthcare Providers ETF (IHF) with similar characteristics.
The next chart shows the Aerospace & Defense ETF (PPA) breaking out with a gap-surge on October 17th and following through with further gains into November. PPA even exceeded the August high on Monday and is leading the market.
The next chart shows the Insurance ETF (KIE) breaking out in mid October and exceeding its August high. Even though KIE and the others are outperforming SPY, they are still part of the stock market and sensitive to broad market swings. KIE broke out in late May, but this breakout failed as the broader market plunged in June. The same thing happened with the August breakout as the broader market fell from mid August to September.
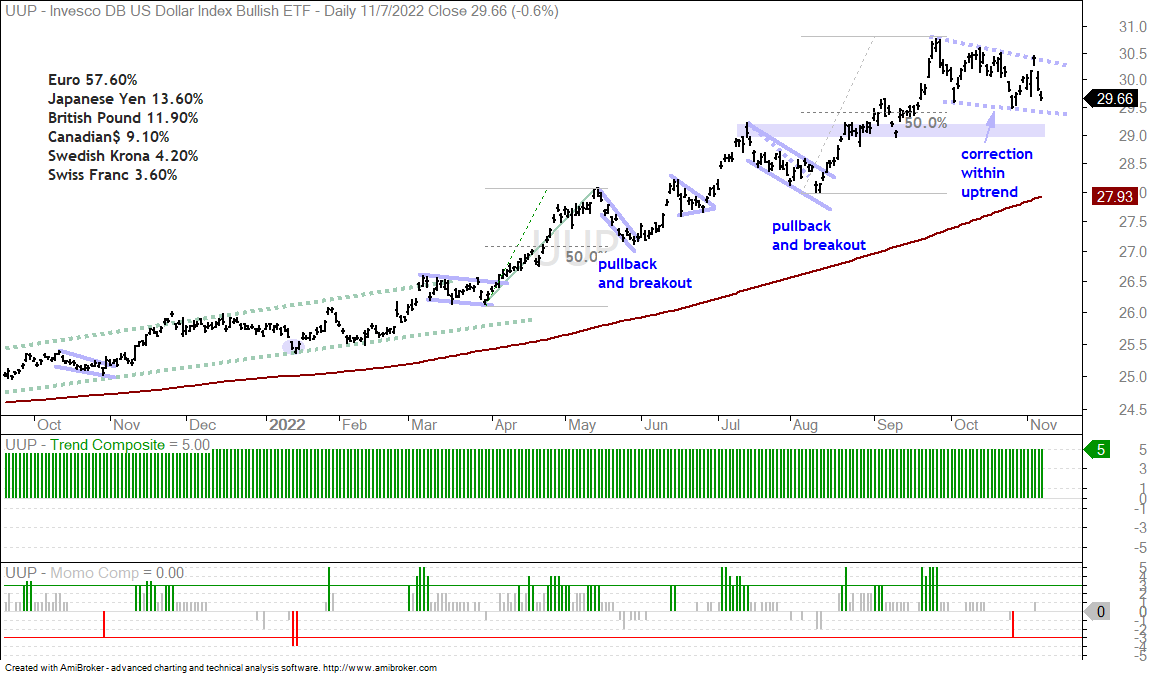
Dollar Extends its Correction with Sharp Decline
Metals made big moves on Friday as the Dollar fell 1.9%, which was the biggest decline since March 16th, 2020 (the middle of the covid crash). We can expect some volatility in the Dollar, bonds, stocks and commodities this week as the markets price in the mid-term elections in the US. Overall, the Dollar remains in an uptrend and I view this decline since late September as a pullback within a bigger uptrend. This pullback has turned rather choppy with some sizable pops and drops, but it still looks like a falling channel and normal retracement (50%) after a big advance.
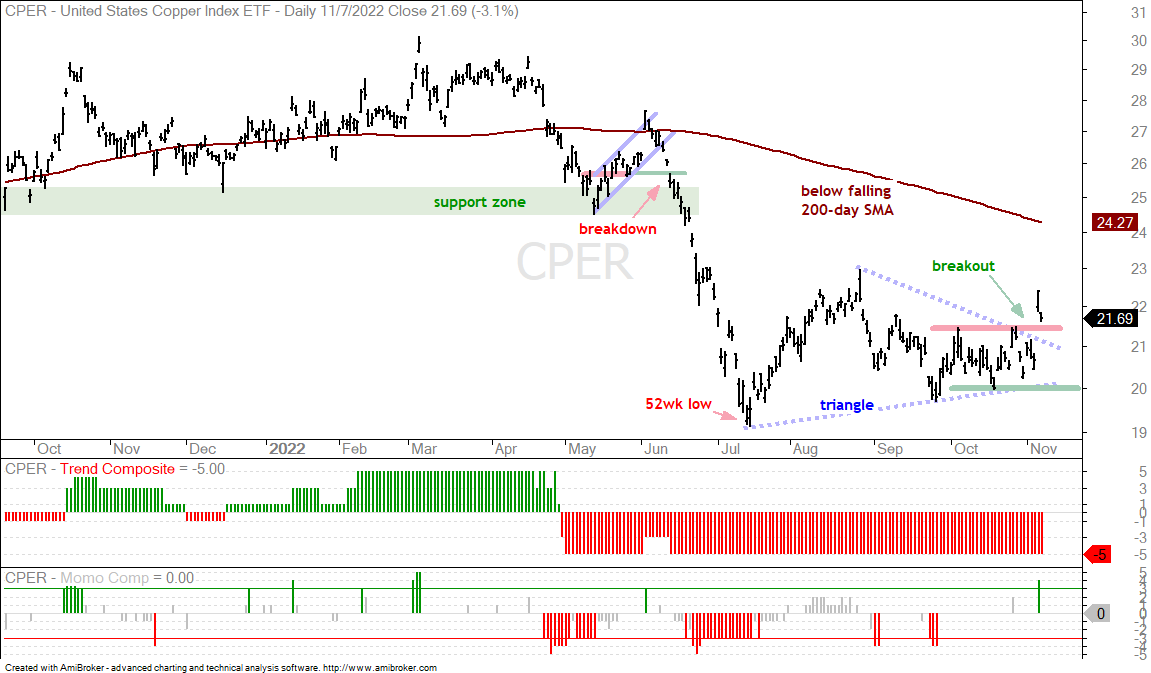
Copper and Copper Miners ETFs Break Out (CPER, COPX)
The next chart shows the Copper ETF (CPER) surging 8.4% on the day UUP fell 1.9%. There appears to be a negative correlation now, but I am not going to tie my view on copper to the Dollar because correlations are subject to change. Personally, I think it is better to divorce ourselves from intermarket narratives and take our cues from the underlying price chart. CPER fell to a new low in July and then consolidated with a triangle. Typically, a triangle after a new low is a continuation pattern that represents a rest within the bigger downtrend. Sometimes, however, the break is the other way and triangles result in reversals. This is the case right now as CPER surged above the October highs. The breakout zone in the 21.5 area turns first support to watch on a throwback. A throwback is a return to the breakout zone and this offers a second chance to partake in the breakout. The October low at 20 marks key support and a break here would be bearish.
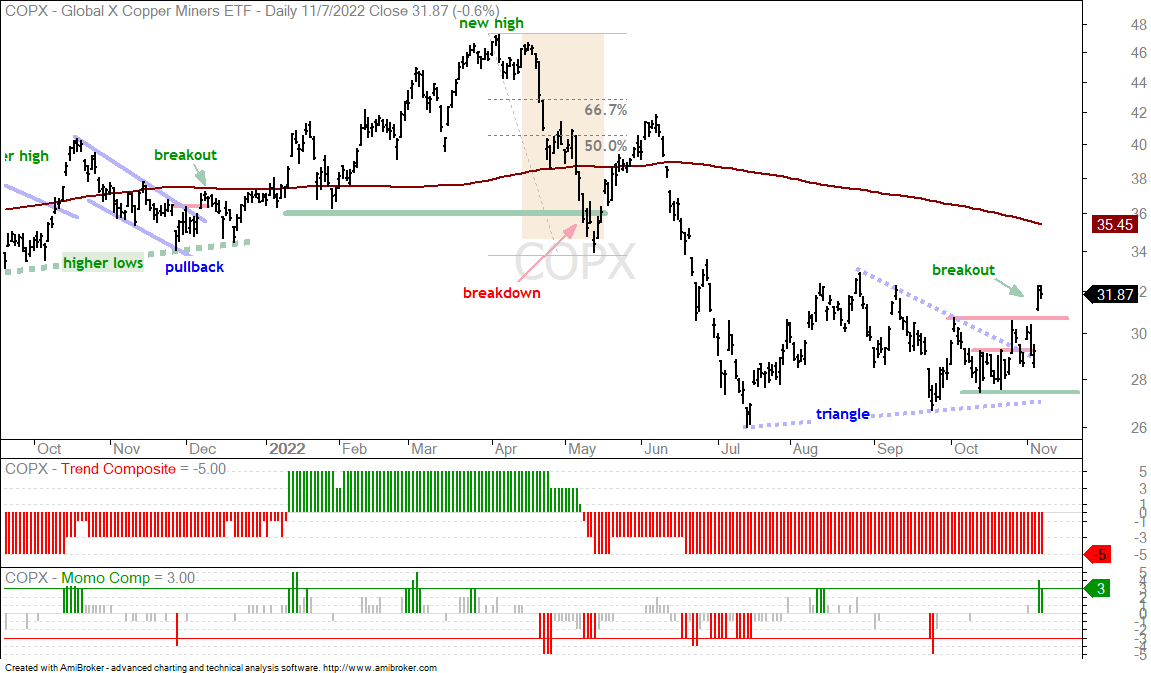
The next chart shows the Copper Miners ETF (COPX) with similar characteristics.
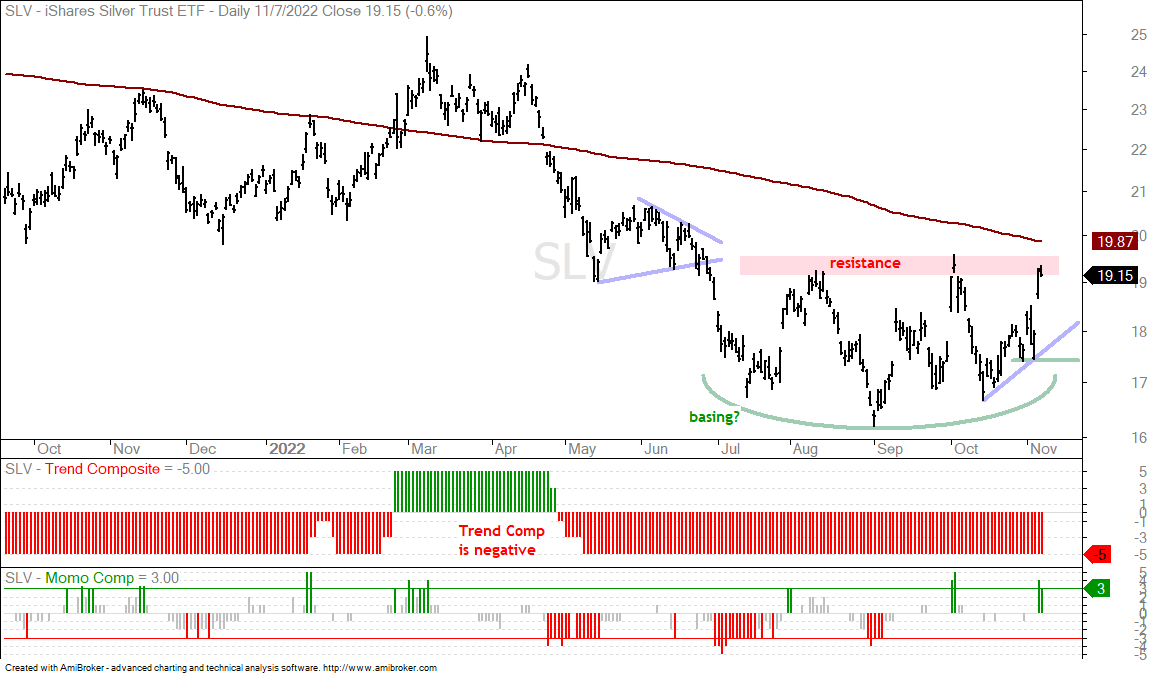
The next chart shows the Silver ETF (SLV) firming from July to October and surging to its resistance zone last week.