Pop-Drop for Stocks, and Drop-Pop for the Yields/Dollar
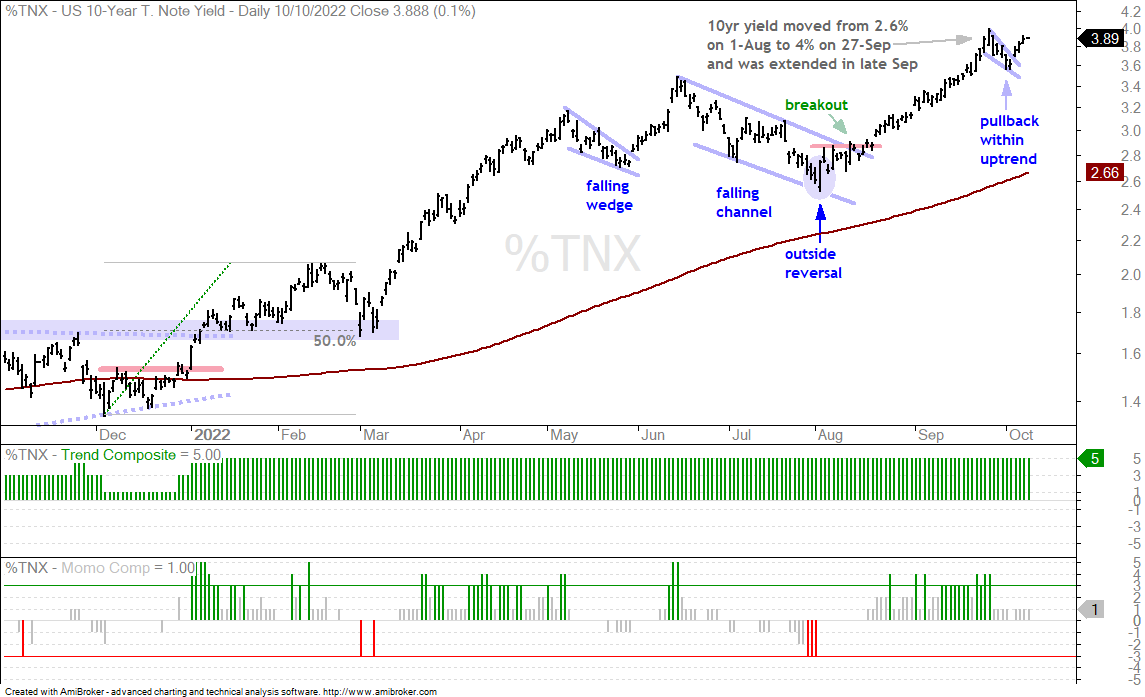
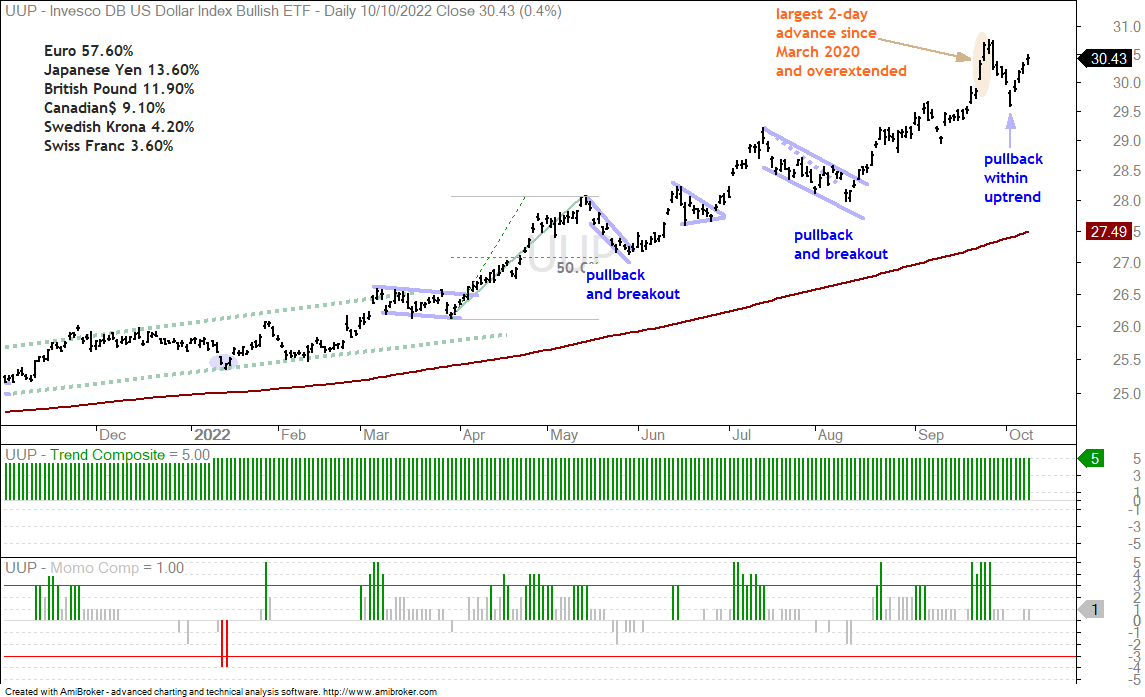
The Dollar finally took a breather from its rapid ascent with a four day pullback and we also saw the 10-yr Treasury Yield fall from around 4% to 3.6%. The Dollar represents the risk-off trade so the pullback facilitated a bounce in stocks. Also note that Treasury yields and stocks have been negatively correlated so the pullback in yields was also welcome news for stocks. Despite pullbacks in the Dollar and 10-yr Treasury Yield, the long-term trends are up and these are just pullbacks within bigger uptrends. Both got overextended on the upside and a pullback is normal at this stage.
Last week we had the perfect setup for an oversold bounce because the 10-yr Treasury Yield was extended, stocks were oversold and the Dollar Bullish ETF (UUP) was overbought. The 10-yr Treasury Yield and the Dollar fell back, while the S&P 500 SPDR surged for two days. And that was it. The Dollar turned back up the last four days and resumed its long-term uptrend. So did the 10-yr Treasury Yield. Overall, stocks and bonds are in long-term downtrends, and the Dollar is in a long-term uptrend.
About the ETF Trends, Patterns and Setups Report
This report contains discretionary chart analysis based on my interpretation of the price charts. This is different from the fully systematic approach in the Trend Composite strategy series. In this ETF Trends, Patterns and Setups report, I am looking for leading uptrends and tradable setups within these uptrends. While I use indicators to help define the trend and identify oversold conditions within uptrends, the assessments are mostly based on price action and the price chart (higher highs, higher lows, patterns in play). Sometimes the chart assessment can be at odds with the indicators.
This Week's Commentary Schedule
Tuesday – 11 October: Market-ETF Report and Signal-Rank Table Update
Wednesday – 12 October Market-ETF Video and Market Regime Update
Thursday – 13 October: Market-ETF Report and Signal-Rank Table Update
Saturday – 15 October: ETF Signal and Rank Table
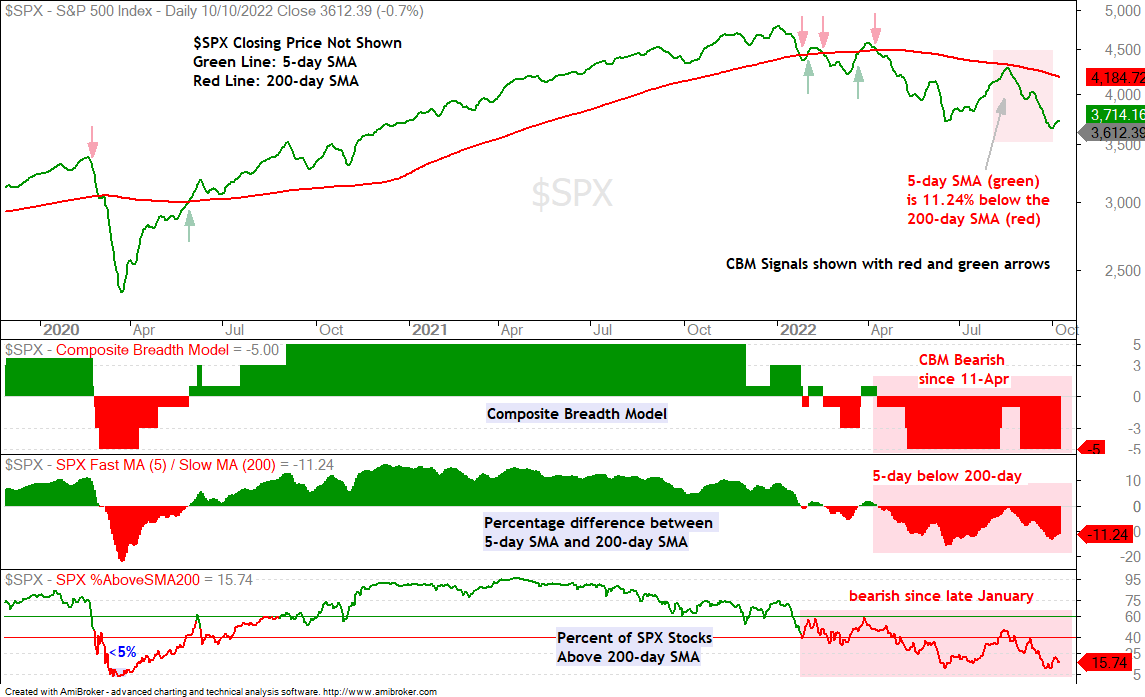
Composite Breadth Model Remains Bearish
Needless to say, the Composite Breadth Model remains bearish as the S&P 500 trades near its lowest levels of the year and near a fresh 52-week low. All five inputs are bearish, the S&P 500 5-day SMA is over 11% below the falling 200-day SMA and only 15.74% of S&P 500 stocks are above their 200-day SMAs. These are bear market numbers. While no two bear markets are exactly the same, the percentage of stocks above their 200-day SMAs went below 5% in 2002 and 2008.
You can learn more about my chart strategy in this article[1] covering the different timeframes, chart settings, StochClose, RSI and StochRSI.
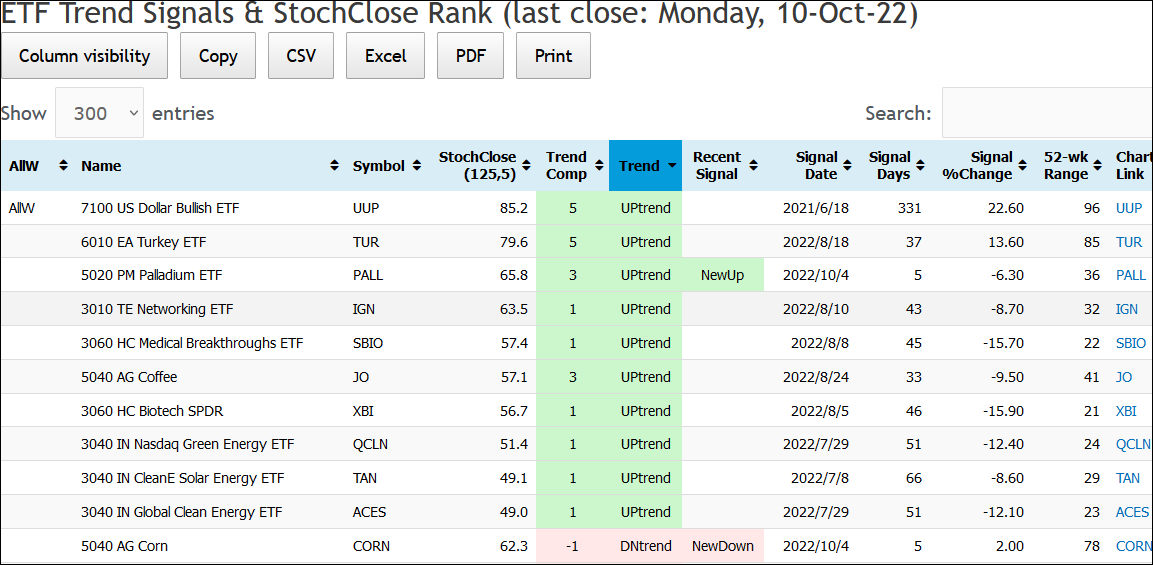
Very Few ETFs in Uptrends
Only 10 of the 274 ETFs in the MasterList are in uptrends, per the Trend Composite indicator. The Dollar Bullish ETF (UUP) remains the leader with the highest StochClose score (85.2). A score of 100 means the ETF is near a six month high, while a score of 0 means the ETF is near a 52-week low. UUP is the closest of the ETFs to a six month high. The Palladium ETF (PALL) is the newest member[2] on the thin list of uptrends with a signal on October 4th.
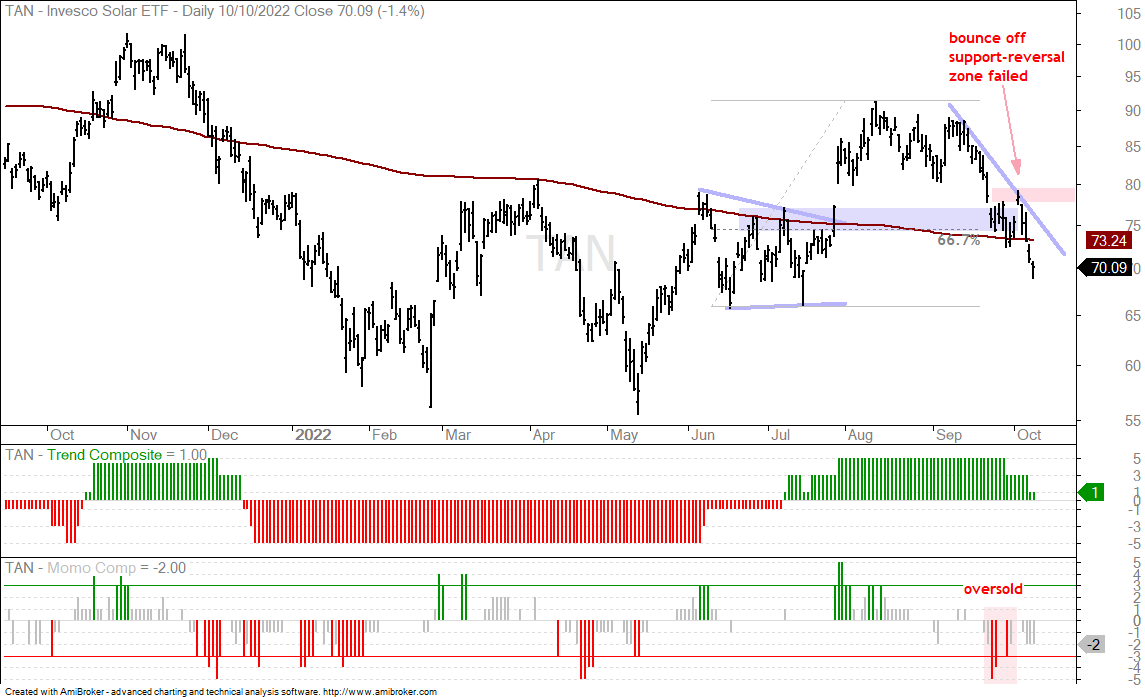
A few stock-based ETFs are still hanging on to their uptrend signals. These include representatives from biotech (SBIO, XBI) and clean energy (QCLN, ACES, TAN). Despite uptrend signals and relative strength, stock based ETFs are still part of the stock market and not immune to broad market weakness. Note that these five ETFs are down between 8.6% (TAN) and 15.90% (XBI) since their uptrend signals.
Correlations Remain High
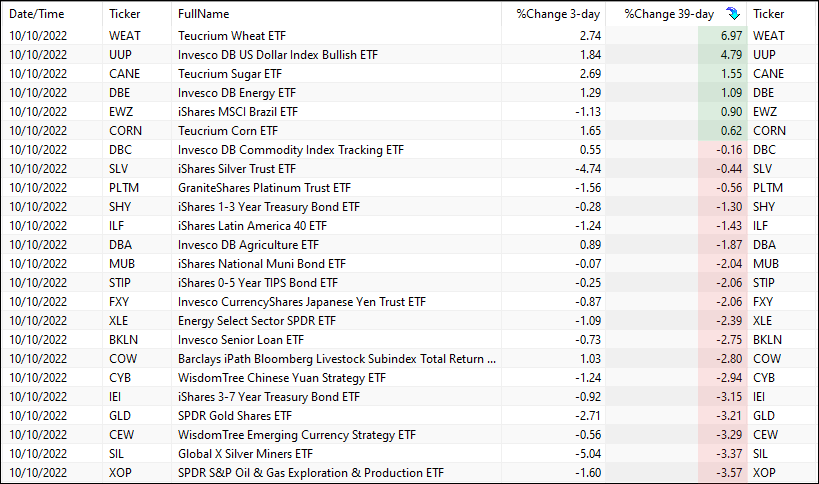
The S&P 500 SPDR (SPY) is down 4.53% the last three days and down 12.4% the last 39 days (mid August peak). Only 11 of the 274 ETFs in the MasterList were up over the last three days. In order of the three day Rate-of-Change, these include YOLO, WEAT, CANE, UUP, TUR, CORN, DBE, COW, DBA, DBE and EWW. Only 6 were up over the last 39 days (WEAT, UUP, CANE, DBE, EWZ, CORN). The table below shows the 39-day Rate-of-Change with the green shading highlighting the winners and the red shading highlighting the losers. Even the energy-related ETFs are down since mid August (XLE, XOP).
As expected, all US stock-based ETFs were down over the last 3 days and over the last 39 days. The lesson here is: bucking the bear market is extremely difficult for stock-based ETFs. The focus should be on stock alternatives, but bonds are in strong downtrends and out of the question. Gold is also in a downtrend and hit a 52-week low in late September. Select metals (PALL) and grains (WEAT) are the only real alternatives to stocks right now. Here is a weekend article covering PALL[2].
SPY Near New Low as QQQ Hits New Low (plus IWM)
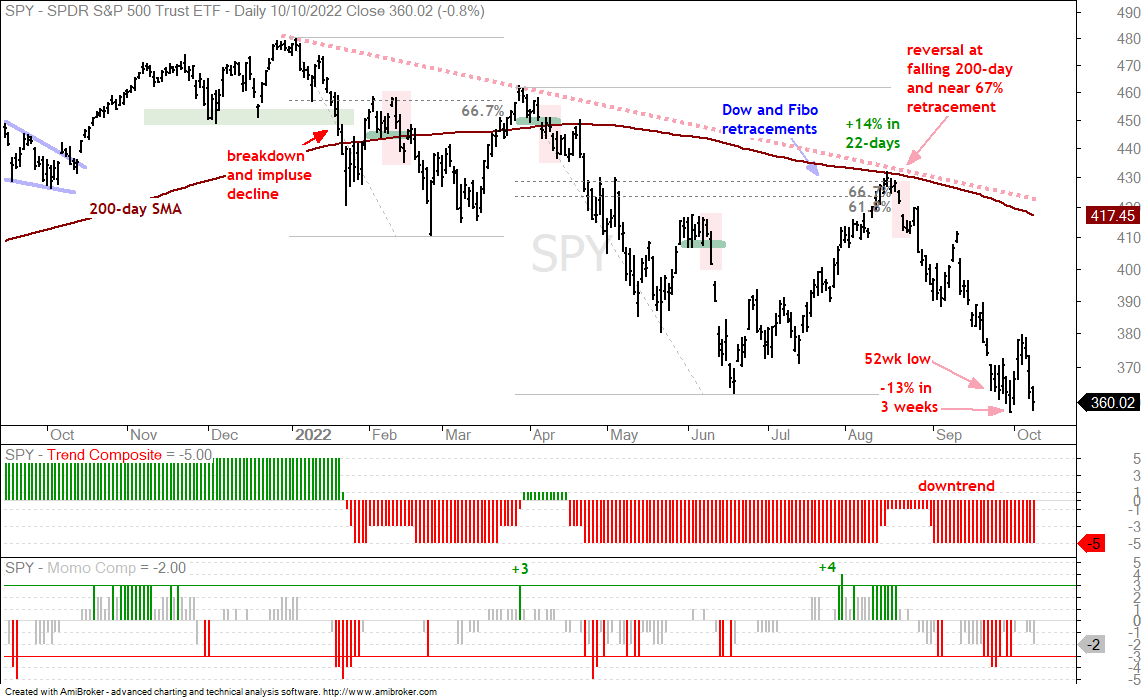
The S&P 500 SPDR (SPY) fell some 13% in three weeks and then bounced with a sharp two day surge (5.82%). This was considered a bear market bounce at the time and it immediately failed as SPY fell back to the 360 area. I am not labelling this area as “support” just because SPY is near the prior low (late Sept/early Oct). Lower lows are expected in downtrends and this means a prior low should not be considered support when the bigger trend is down.
The same logic applies to oversold conditions. Stocks and ETFs can become oversold and remain oversold when the bigger trend is down. Note that the Momentum Composite has been red (oversold) a lot more than green (overbought) in 2022. This shows more downside momentum than upside momentum in 2022.
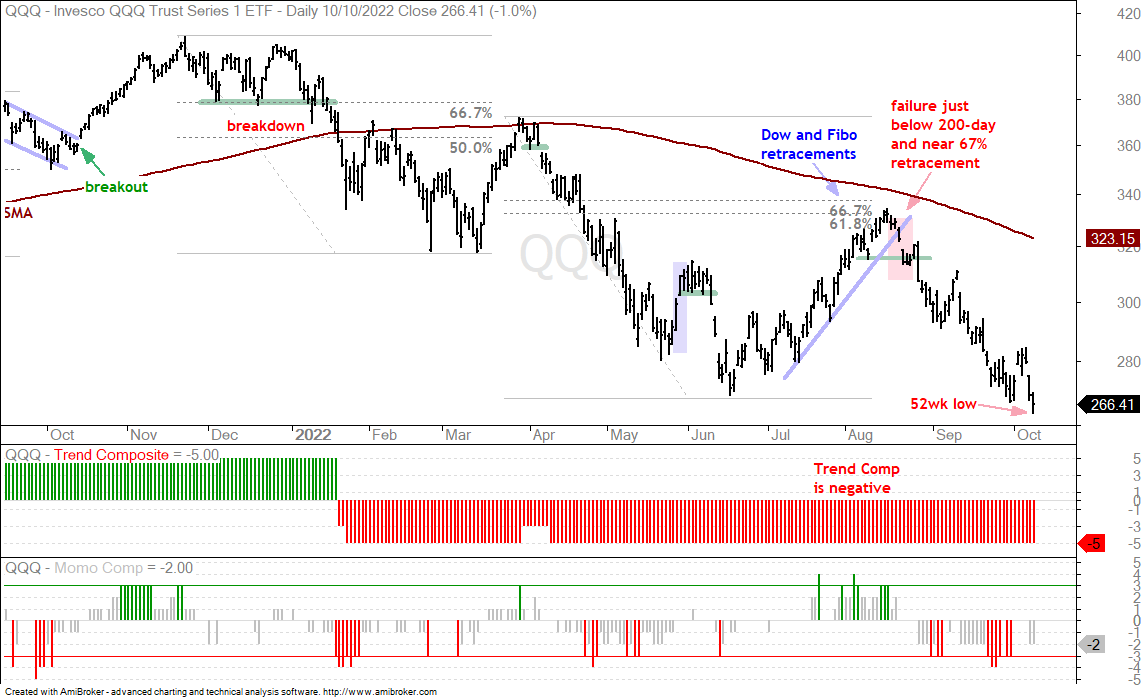
The next chart shows the Nasdaq 100 ETF (QQQ) hitting a new low on Monday. QQQ is leading the way lower and this is weighing on the broader market. Stocks in QQQ represent some 35% of the S&P 500 and the tech sector represents the risk-on trade. QQQ, the Technology SPDR (XLK), the Semiconductor ETF (SOXX), the Software ETF (IGV), the Cloud Computing ETF (SKYY) and the Cybersecurity ETF (CIBR) all hit new lows on Monday.
The Momentum Composite aggregates signals in five momentum-type indicators to identify short-term overbought and oversold conditions. This indicator is part of the TIP Indicator Edge Plugin for StockCharts ACP[3]
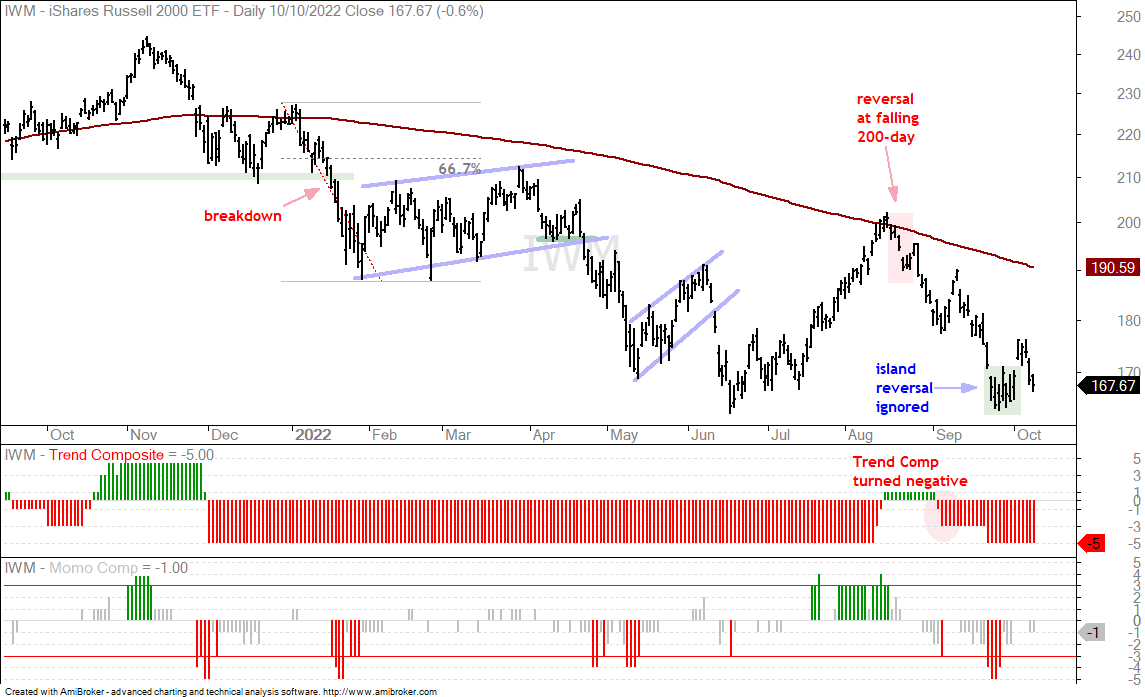
The next chart shows the Russell 2000 ETF (IWM) doing the pop on 3-4 October and the drop over the last four days. The green shading marks the island reversal, which was pointed out last week and then ignored because the bigger trend is down and we are in a bear market. The odds are against short-term bullish reversals and setups in such conditions. If anything, we should be looking to sell into rallies and look for short-term reversals after a bounce, as happened on August 23rd (see report here).
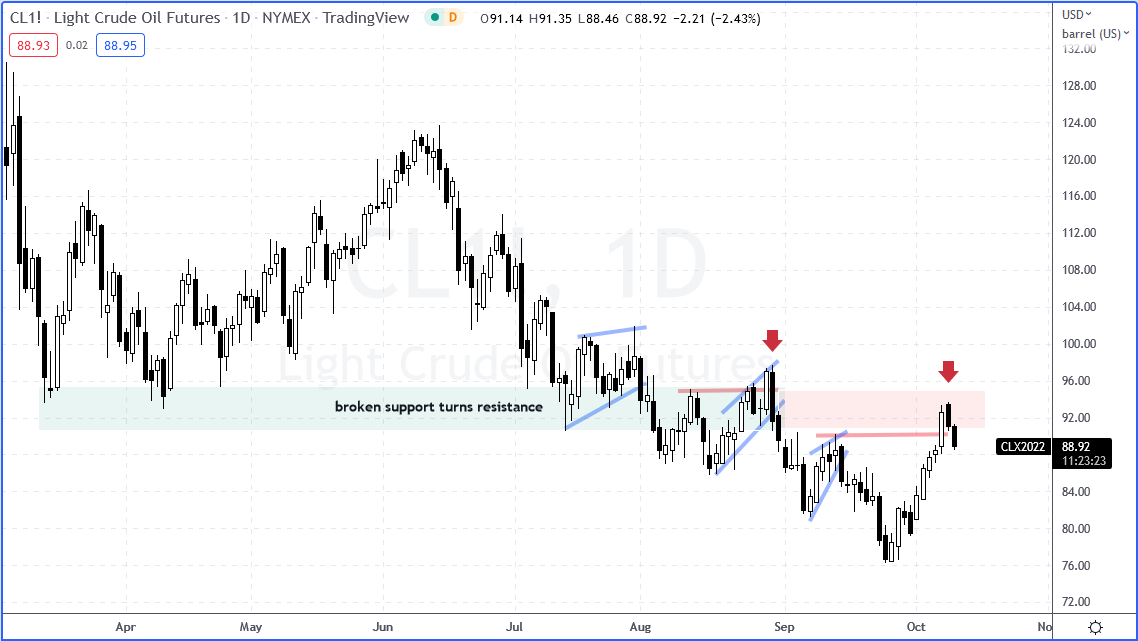
Crude Oil Hits Resistance at Broken Support (CL1!, DBE, DBC)
Chart analysis is subjective and reversals are dependent on picking the right peak for the breakout. The red lines on the Light Crude Futures (CL1!) chart below shows alleged resistance levels and breakouts, but crude reversed soon after these “breakouts” (red arrows). It seems that the mid August high was not an important peak and this could also be the case with the mid September high. Crude broke this high on Friday and then moved sharply lower on Monday. The most recent candlestick reflects early trading on Tuesday and oil is sharply lower.
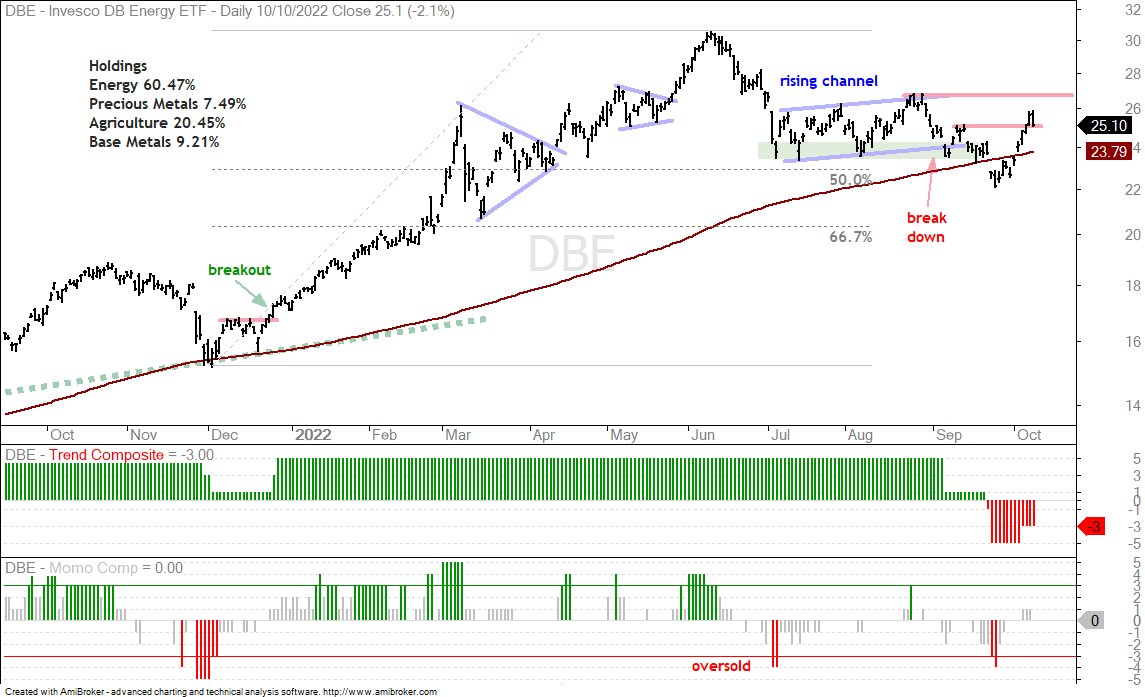
The next chart shows the DB Energy ETF (DBE) breaking its mid September high on Friday and then falling 2.1% in Monday. The September high was my line in the sand, but a re-think leads me to conclude that this peak was not the important peak to watch. Instead, it was the late August high. As such, the October bounce is viewed as a counter-trend bounce after the breakdown in September. The Trend Composite is negative and prices have been trending lower since summer.
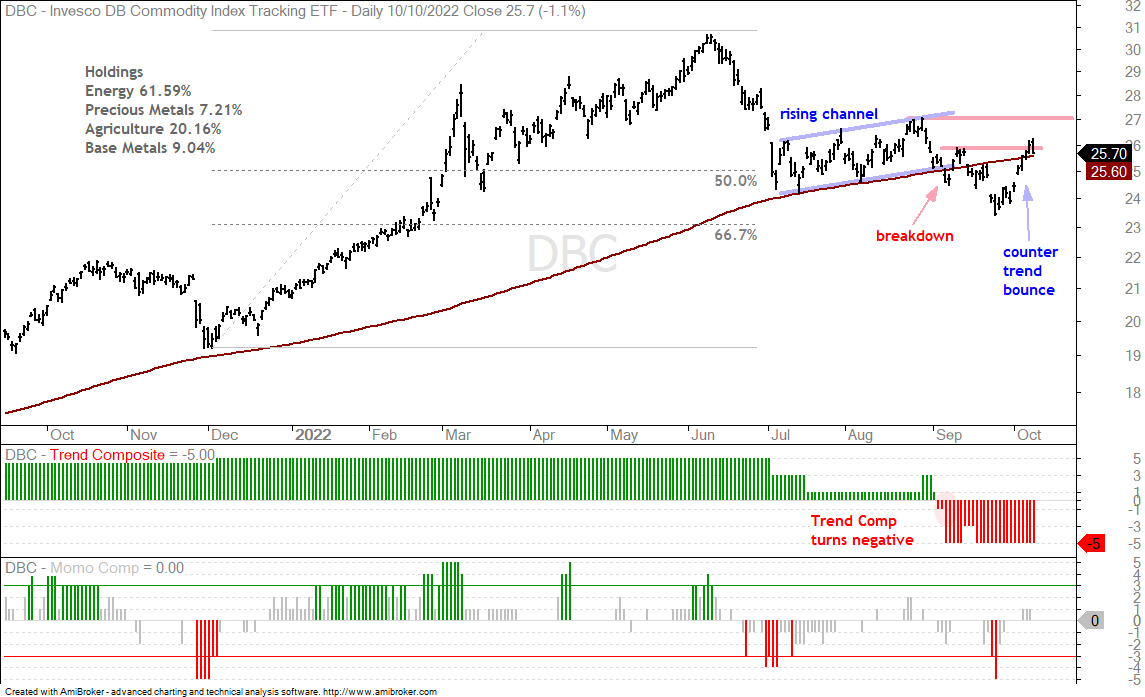
The next chart shows the DB Commodity ETF (DBC) with similar characteristics because 61.6% of the ETF comes from energy. In a separate, but related note, the surge in oil was driven by the production cut from OPEC+, which is led by Saudi Arabia. The decision to cut production has passed and is priced-in. This priced-in decision, however, has not been well received in the US, to say the least.
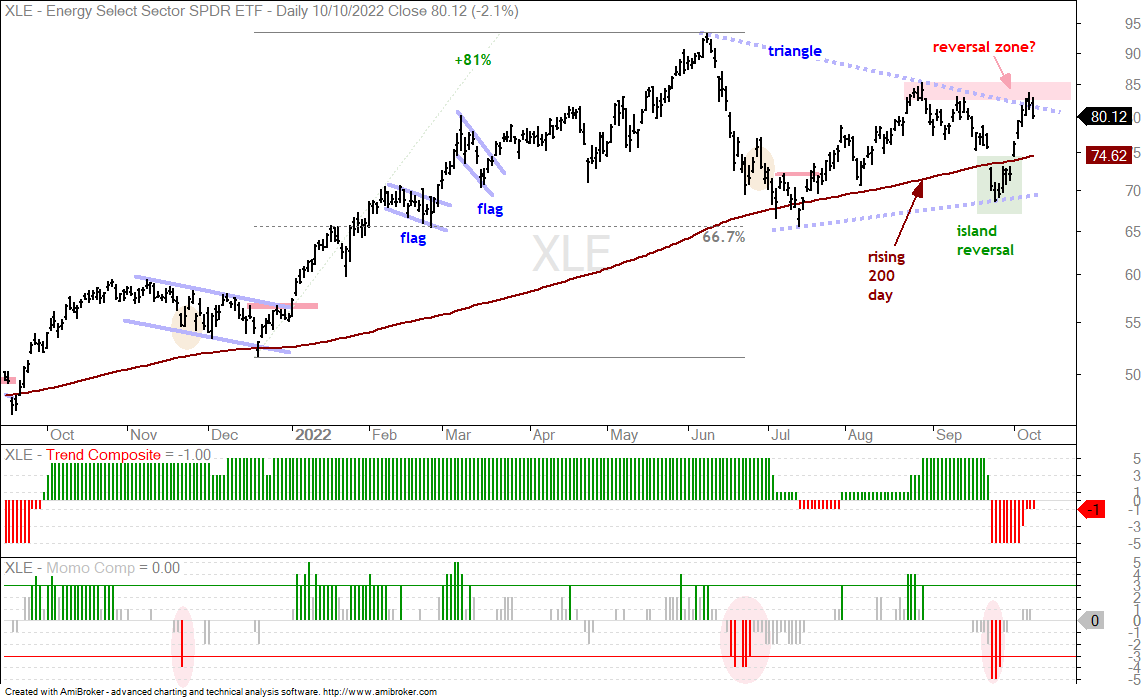
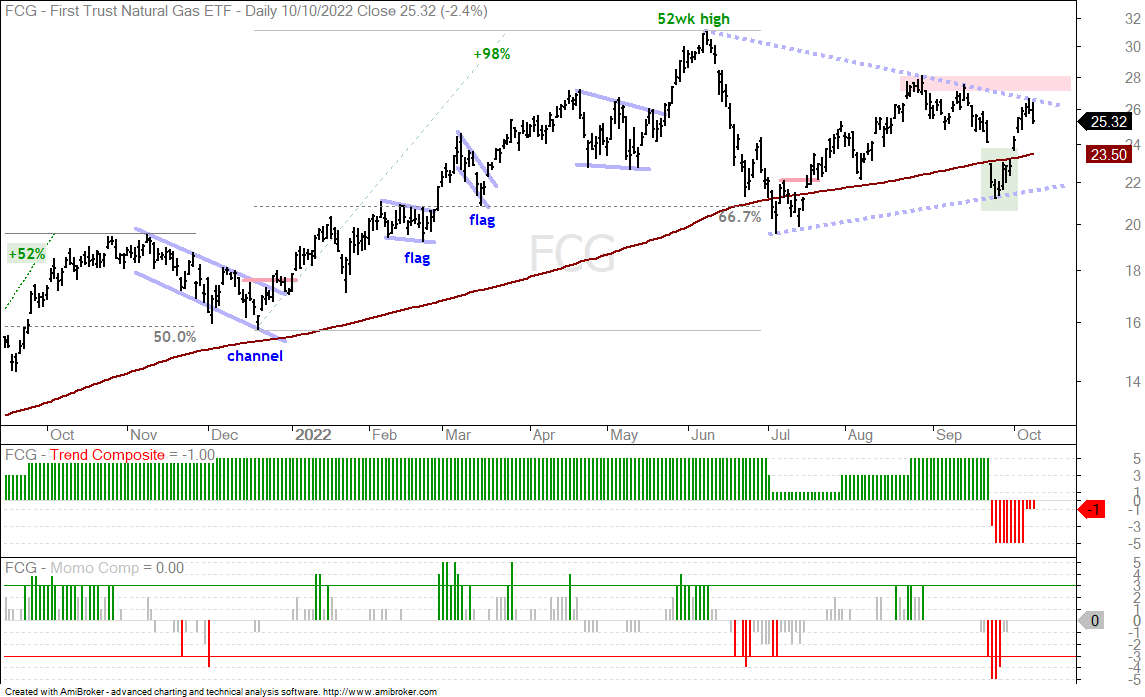
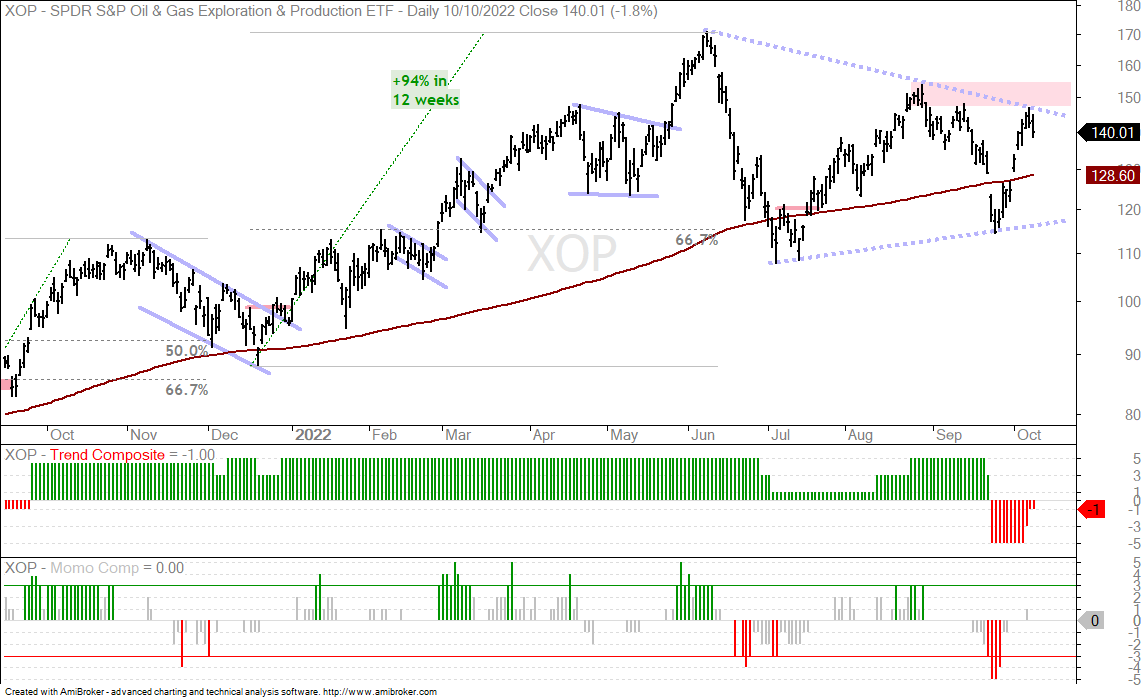
Energy ETFs Hit Short-term Resistance Zones (XLE, FCG, XOP)
The Energy SPDR (XLE) is hitting resistance from its August-September highs after a 20% surge that started with an island reversal. Note that this island reversal formed around the rising 200-day SMA, as opposed to near a 52-week low. Overall, XLE surged 81% into June, retraced 2/3 with a decline into July and then consolidated with a triangle. A triangle after a large advance is typically a rest within an uptrend and a bullish continuation pattern. As such, a break above the resistance zone (red shading) would be bullish.
XLE, the Natural Gas ETF (FCG) and the Oil & Gas Exploration & Production ETF (XOP) have similar chart characteristics and these energy-based ETFs are highly correlated. They all move in the same direction. XLE is at a precarious spot short-term. First, keep in mind that oil is still in a downtrend since summer and stocks are in a bear market. XLE was up some 20% from late September to early October (eight days). Even though the Momentum Composite did not become overbought (+3 or higher), the ETF was clearly short-term overbought after such a surge. XLE is also at resistance from the August-September highs. Thus, this is a spot for a short-term bearish reversal.
The chart above shows FCG with similar characteristics and the chart below shows XOP. Note that the Trend Composite is negative for all three.
You can learn more about exit strategies in this post[4], which includes a video and charting options for everyone.
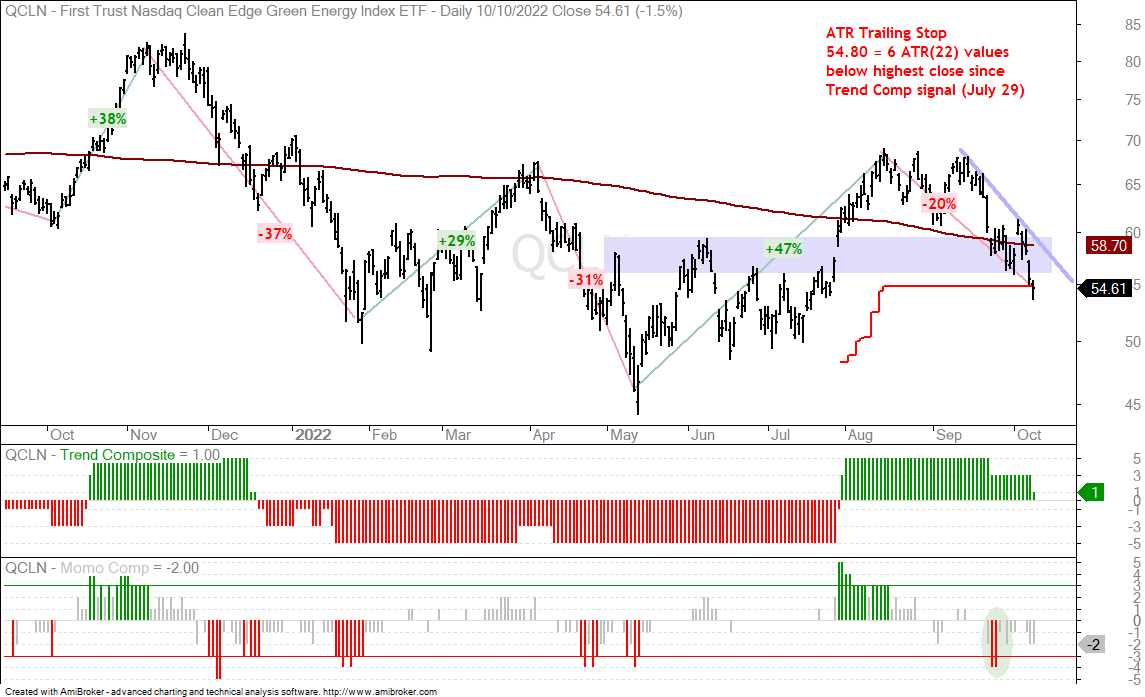
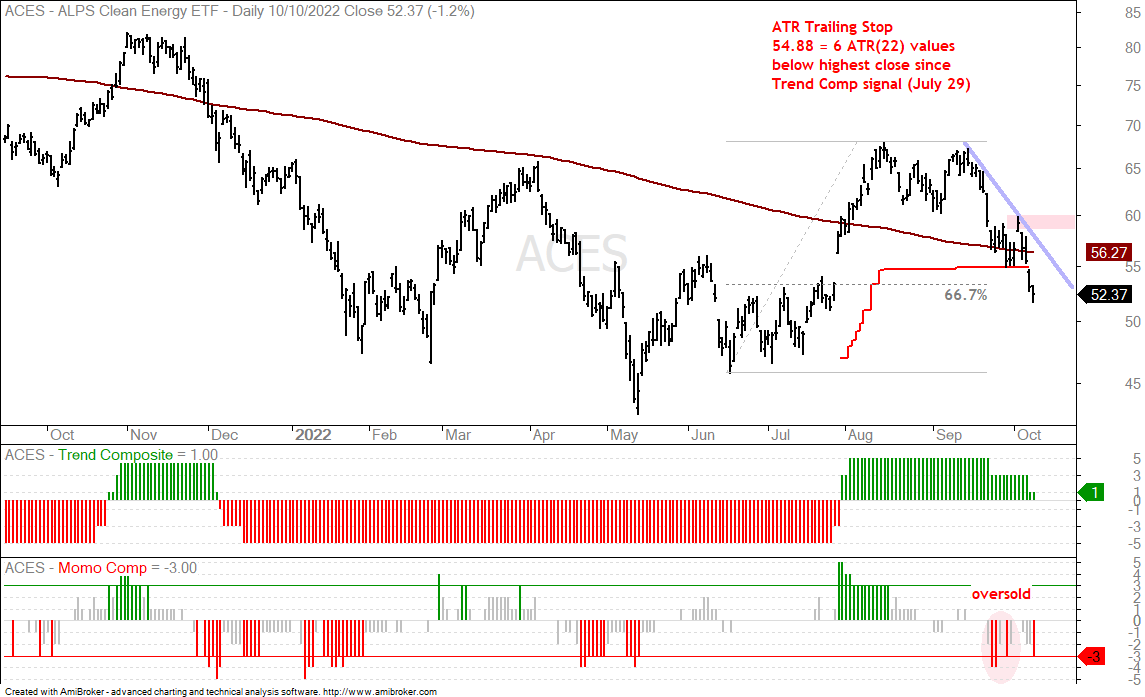
Clean Energy ETFs Affected by Bear Market (TAN, QCLN, ACES)
The bear market is wreaking havoc on attempts to trade the long side in stock-based ETFs. The clean energy ETFs were leading into August and even holding up well in early September. This group was hit hard since mid September as the Solar Energy ETF (TAN), Clean Energy ETF (ACES) and Clean Edge Green Energy ETF (QCLN) fell around 20% the last four weeks. The first chart shows QCLN moving back below its falling 200-day SMA and triggering its ATR Trailing Stop.
The second chart shows ACES with the same sharp decline.
The third chart shows TAN failing to hold the bounce off the 200-day SMA and 2/3 retracement as it fell sharply the last four days. Clean energy is not holding up anymore.
The Trend Composite aggregates signals in five trend indicators: Bollinger Bands (125,1), Keltner Channels (125,2), 5-day Rate-of-Change of 125-day SMA, StochClose (125,5) and CCI-Close (125). The Trend Composite and ten other indicators are part of the TIP Indicator Edge Plugin for StockCharts ACP[3]
Biotech SPDR Holds after Normal Pullback (XBI, IBB)
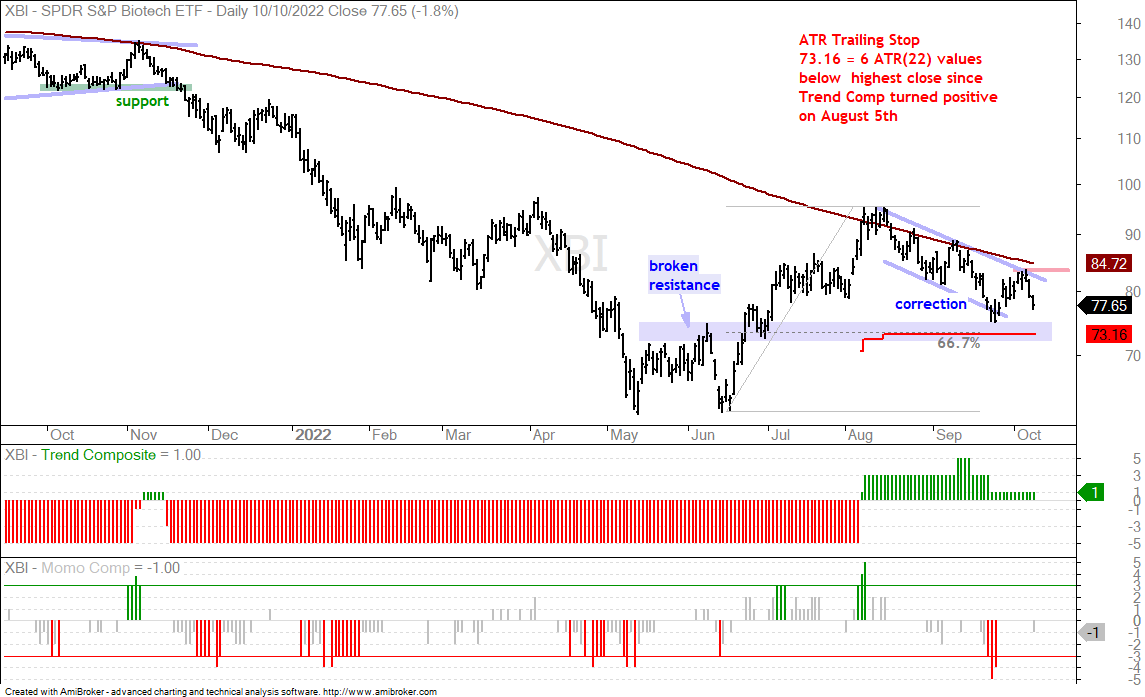
The Biotech SPDR (XBI) is still holding its ATR Trailing Stop and the decline (correction) since mid August looks like a correction after a breakout advance (June to August). This decline retraced around 2/3 of the prior advance and returned to broken resistance, which turns support. All this sounds good, but keep in mind that biotech stocks are still stocks and we are still in a bear market. A break above the early October high would reverse the short-term downtrend and signal a continuation of the bigger uptrend (Trend Composite is positive).
You can learn more about exit strategies in this post[4], which includes a video and charting options for everyone.
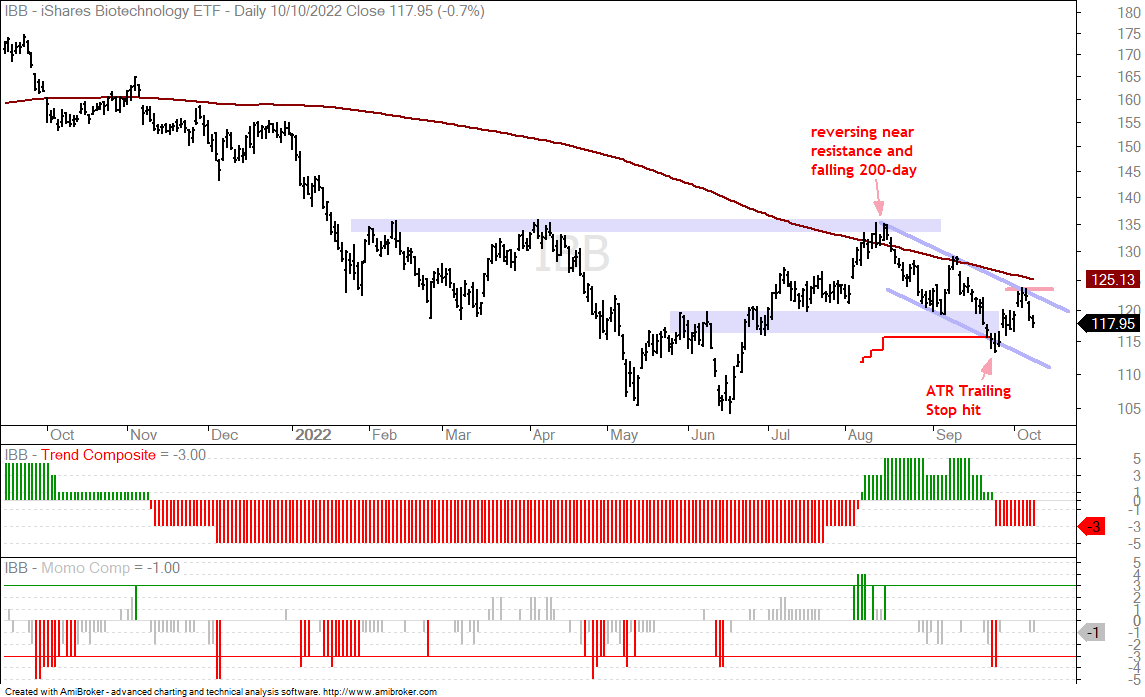
The next chart shows the Biotech ETF (IBB) hitting its ATR Trailing Stop because its decline was deeper than that of XBI. Even so, these two are positively correlated and will move in the same direction. There charts have similar characteristics and a break above the early October high would also be bullish for IBB.
Wheat Lifts DB Agriculture ETF (WEAT, DBA)
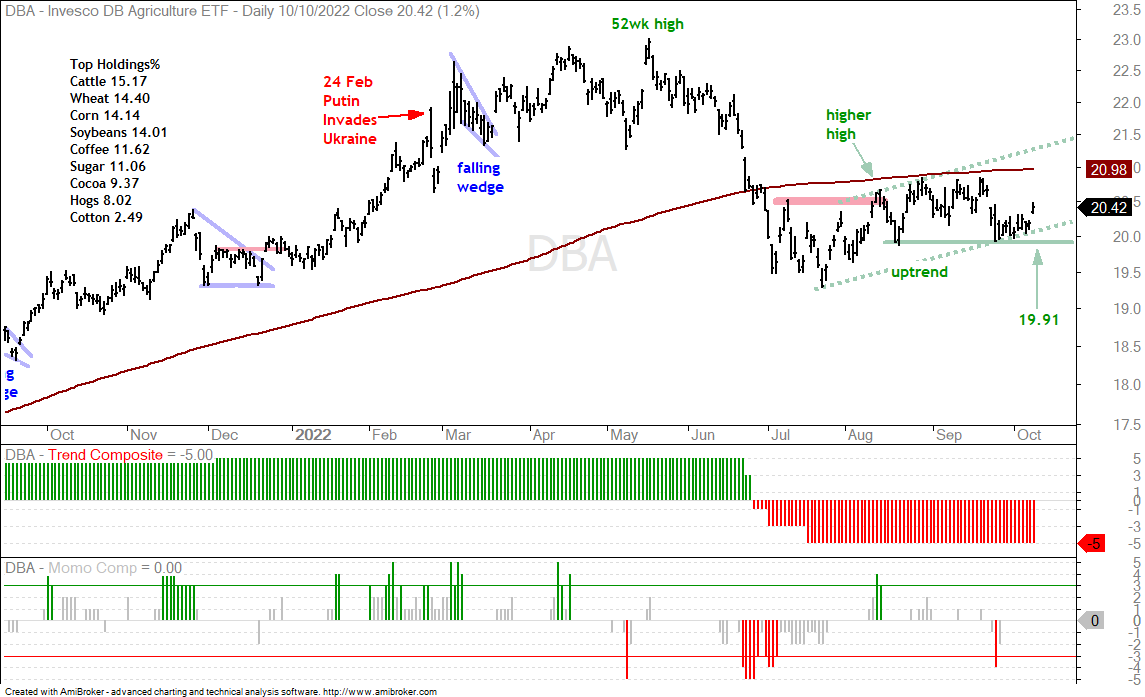
The DB Agriculture ETF (DBA) is showing some resilience as it held the mid August low and surged on Monday. Overall, there is an uptrend into the May high, a downtrend into the July low and an uptrend since the higher high in mid August. The green dashed lines define this uptrend with support marked at 19.01, a close of which would call for a re-evaluation.
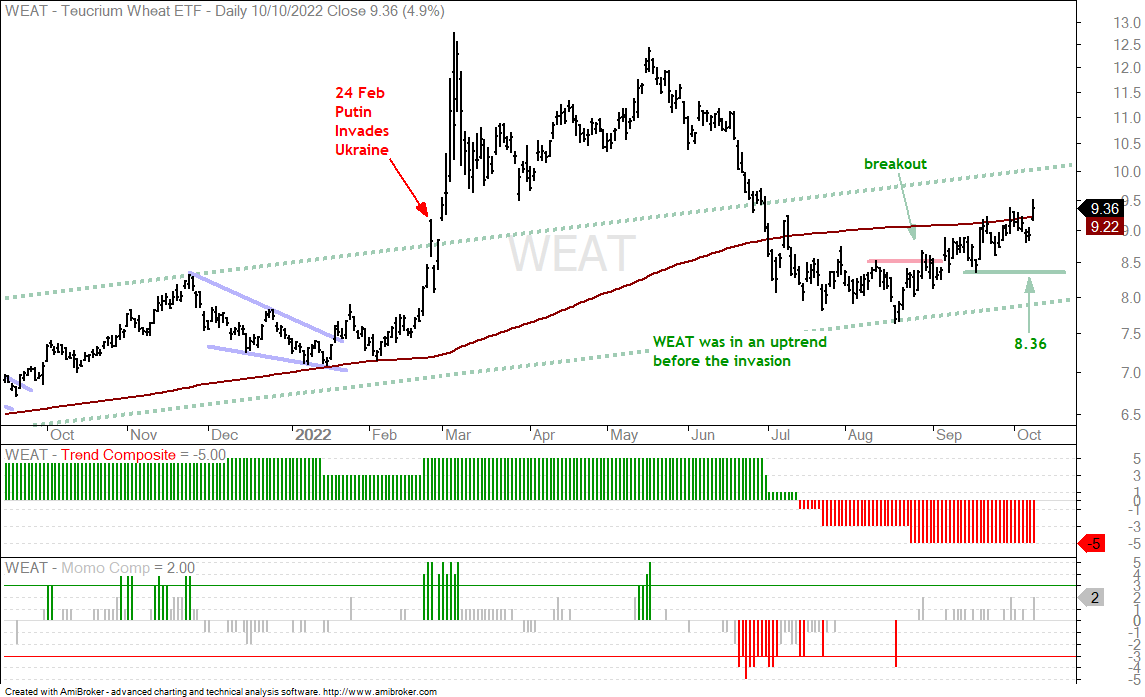
The Wheat ETF (WEAT) moved back above its 200-day SMA with a surge on Monday. The ETF bottomed in mid August and forged a higher high with the breakout surge in late August. It has been moving higher with a tight zigzag since this breakout. Overall, WEAT is still within the rising channel that was present before the invasion of Ukraine. It is also leading because it is trading above its mid August high. Support is set at 8.36 and a close below this level would argue for a re-evaluation.
Corn Remains Strong as Soybeans Weaken (CORN, SOYB)
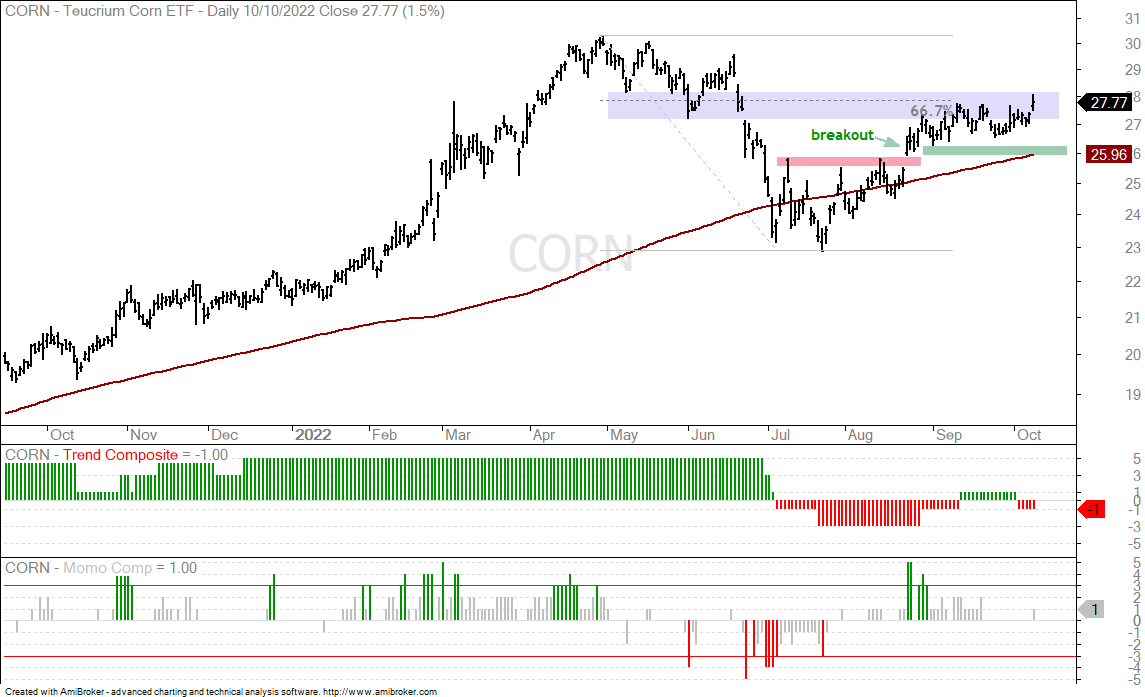
The next chart shows the Corn ETF (CORN) working its way higher since the late August breakout. CORN also surged on Monday and is showing leadership within the markets. The rising 200-day and green support zone are the first levels to watch for a breakdown.
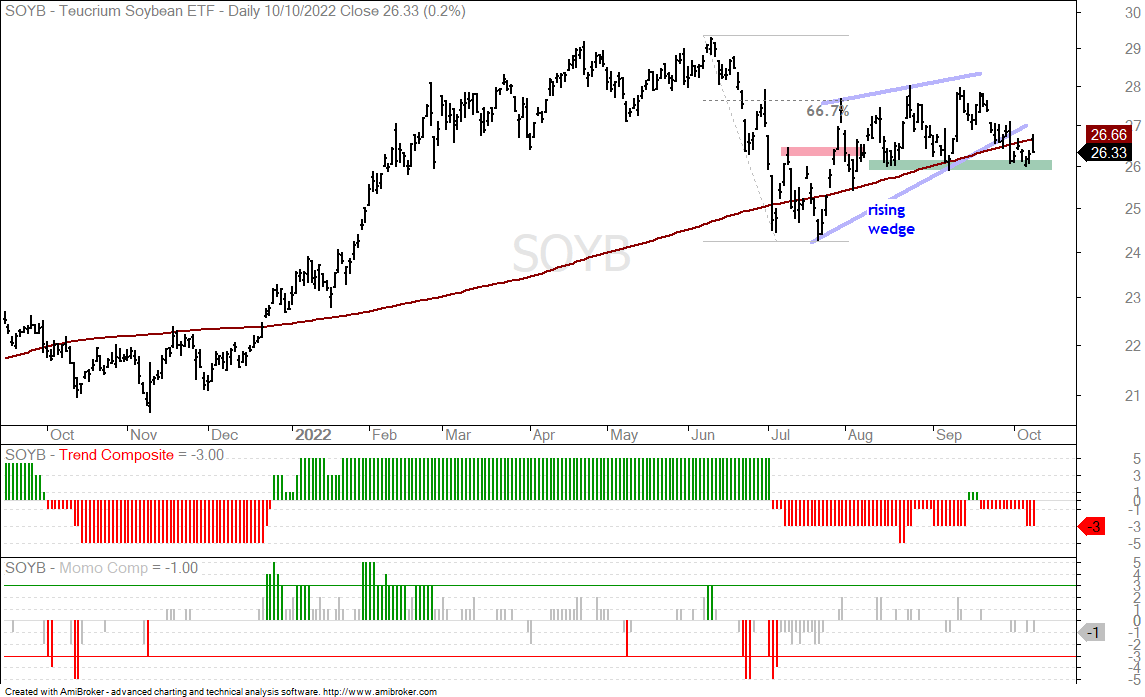
The Soybean ETF (SOYB) is clearly not as strong as WEAT and CORN. In fact, SOYB has a bearish pattern at work because it retraced around 2/3 of the prior decline with a rising wedge and is testing support after a decline the last three weeks. The pattern and retracement amount are typical for counter-trend bounces. As such, a break below the September lows be would bearish for soybeans.
Coffee ETF Falls Back below 200-day (JO)
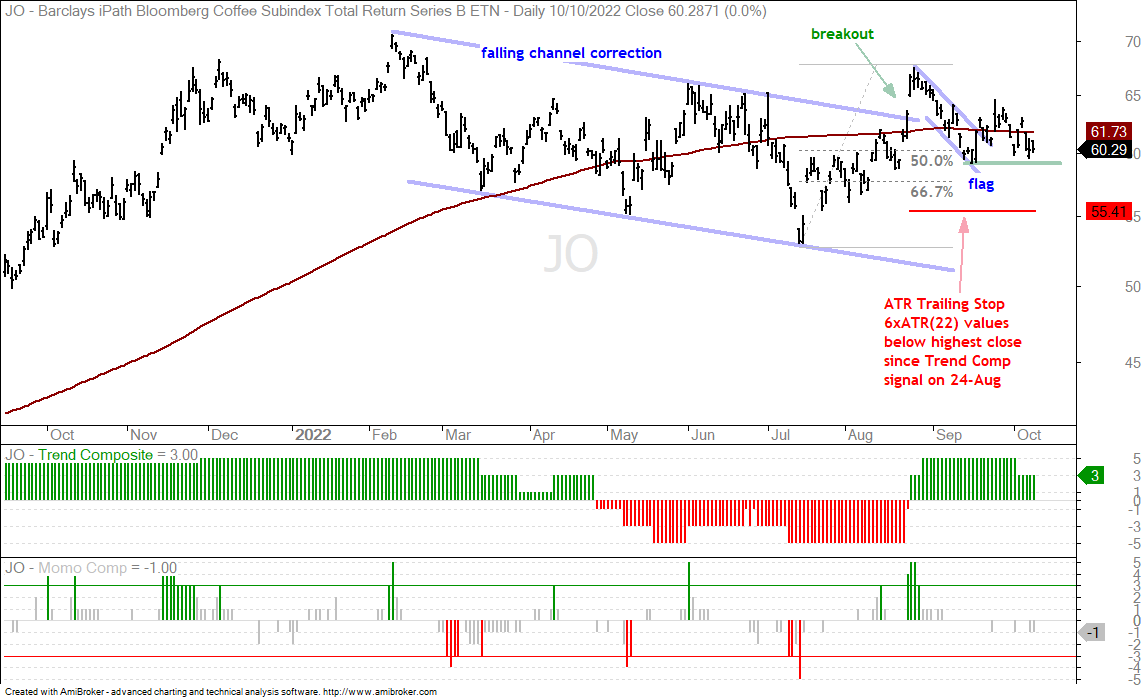
The Coffee ETF (JO) continues to struggle since the breakout in late August. A pullback after a breakout is normal and the falling flag retraced a normal amount of the prior advanced (50-67 percent). JO looked like it got its mojo back with the flag breakout, but the breakout did not gain any traction as the ETF fell back below the 200-day SMA (brown line). The flag low marks support and a close below this low would also put the late August breakout in jeopardy.