The S&P 500 SPDR (SPY) is in a long-term downtrend, but in the midst of a oversold bounce, which started with the outside reversal day on Thursday. SPY started this bounce after a 52-week low so this is still considered a counter-trend bounce within a bigger downtrend. Stocks were severely oversold in late September and mid October so a counter-trend bounce is normal. In general, I am not interested in bounces after a 52-week low because 52-week lows occur in strong downtrends. The downtrend is still the dominant force at work and could re-assert itself at any time. A few ETFs managed to hold above their summer lows in late September and avoid 52-week lows. Some even held above their late September lows in October. These ETFs show relative strength because they held up better and will be featured in today’s report.
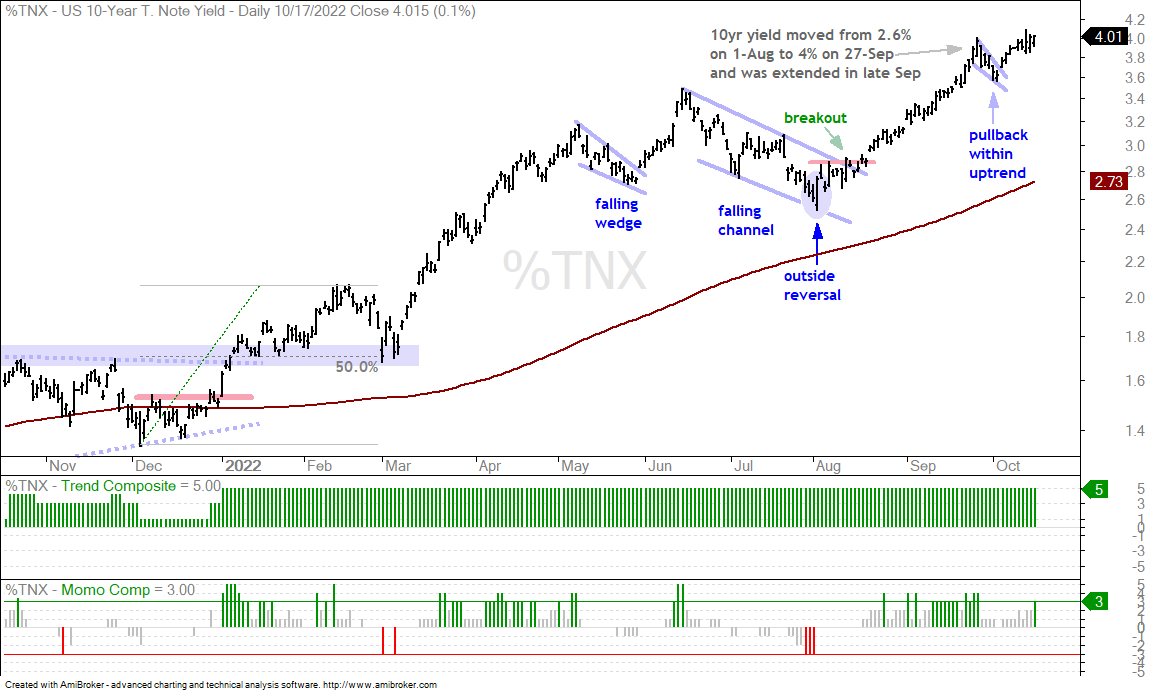
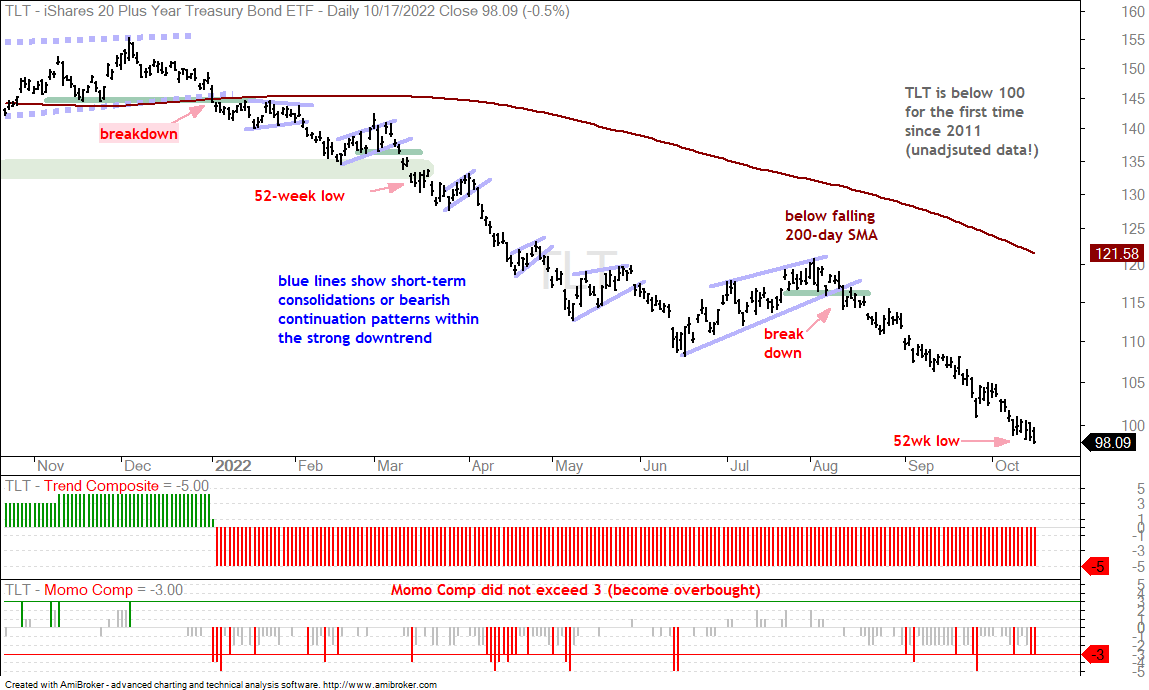
Elsewhere, the 10-yr Treasury Yield is at 4% as the 20+ Yr Treasury Bond ETF (TLT) hit another new low. Rates are rising and bonds remain in strong downtrends. Rising rates may provide a headwind for the Home Construction ETF (ITB).
About the ETF Trends, Patterns and Setups Report
This report contains discretionary chart analysis based on my interpretation of the price charts. This is different from the fully systematic approach in the Trend Composite strategy series. In this ETF Trends, Patterns and Setups report, I am looking for leading uptrends and tradable setups within these uptrends. While I use indicators to help define the trend and identify oversold conditions within uptrends, the assessments are mostly based on price action and the price chart (higher highs, higher lows, patterns in play). Sometimes the chart assessment can be at odds with the indicators.
This Week's Commentary Schedule
Tuesday – 19 October: Market-ETF Report and Signal-Rank Table Update
Wednesday – 20 October Market-ETF Video and Market Regime Update
Thursday – 21 October: Market-ETF Report and Signal-Rank Table Update
Saturday – 23 October: ETF Signal and Rank Table
Composite Breadth Model Remains Bearish
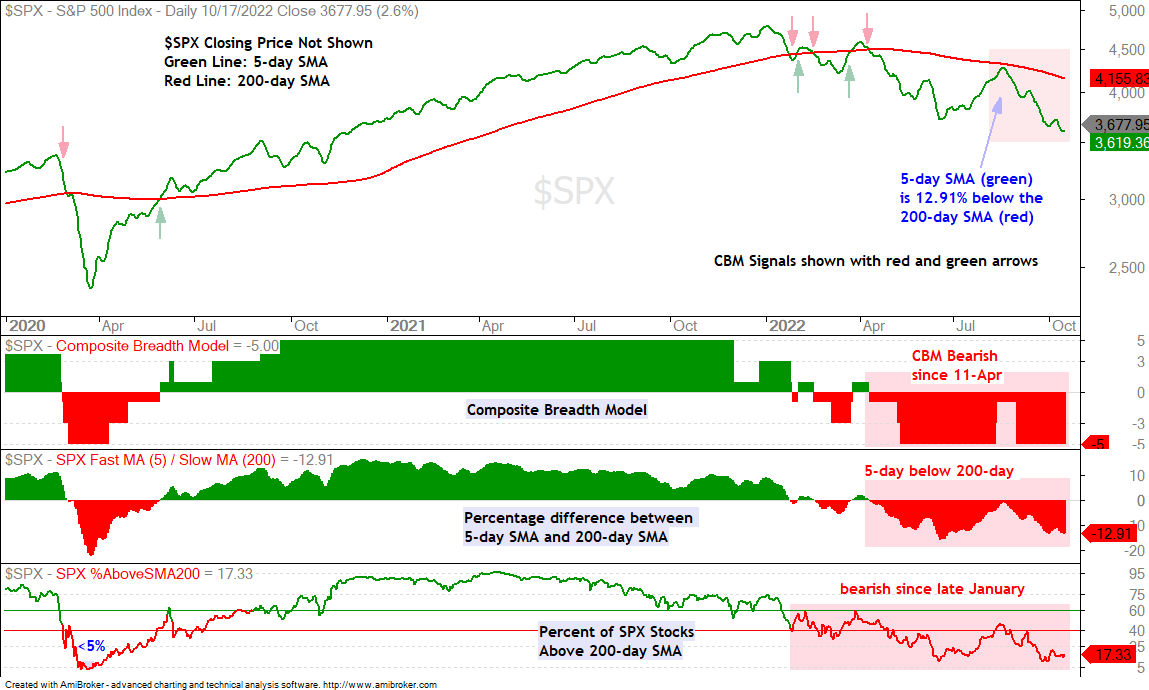
The Market Regime remains bearish for stocks because the Composite Breadth Model (CBM) is negative and yield spreads show stress in the credit markets. The CBM has been negative since April 11th and all five inputs are currently bearish (-5). The 5-day SMA is 12.91% below the falling 200-day SMA and less than 20% of S&P 500 stocks are above their 200-day SMAs. These metrics confirm a long-term downtrend in the S&P 500 and long-term downtrends for the vast majority of stocks in the index.
You can learn more about my chart strategy in this article[1] covering the different timeframes, chart settings, StochClose, RSI and StochRSI.
A Handful of Uptrends
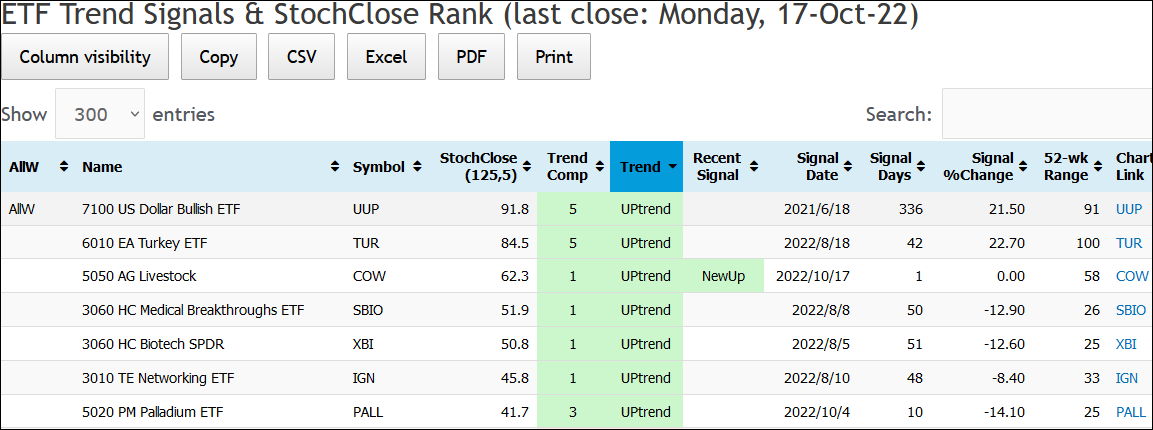
There are only a handful of uptrends (7) within the ETF MasterList (274). The Biotech SPDR (XBI) and Medical Breakthroughs ETF (SBIO) have been in uptrends since mid August and represent the same group (biotechs). The Networking ETF (IGN) is the only other stock-related ETF with an uptrend and the Turkey ETF (TUR) is the only country index ETF with an uptrend. Outside of these stock-based ETFs, the Dollar Bullish ETF (UUP) remains the strongest by far with a StochClose value above 90, which means it is close to a six month high.
Palladium ETF Becomes Oversold (PALL)
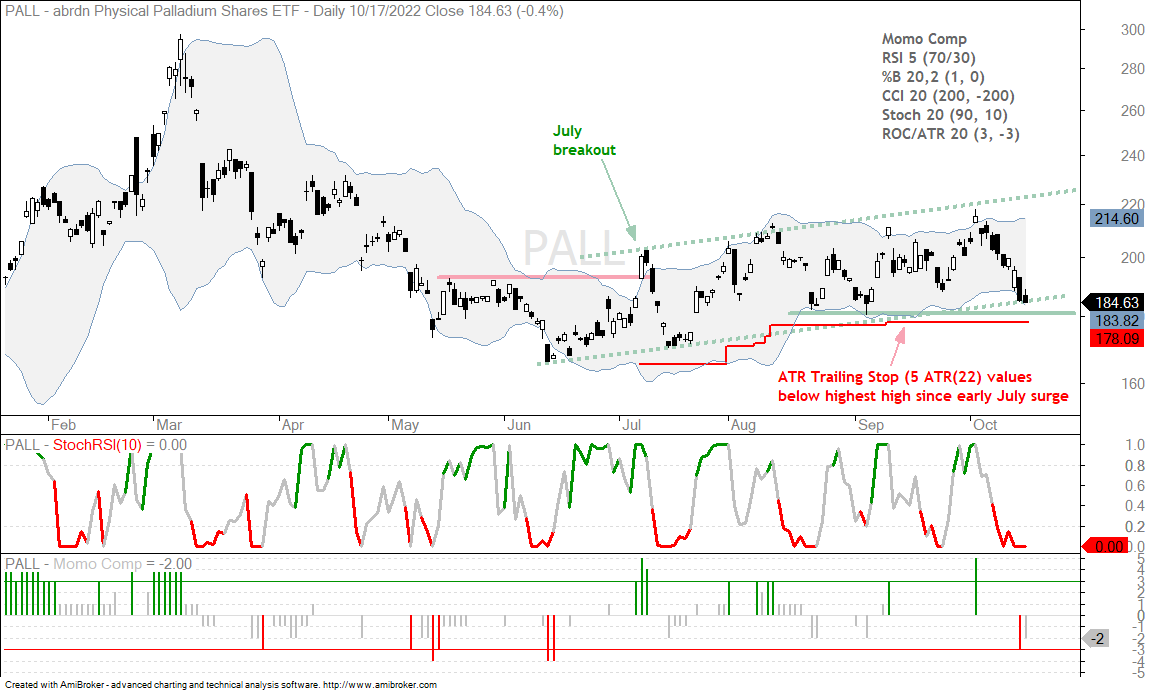
The Palladium ETF (PALL) triggered bullish two weeks ago and then fell back to its August-September lows. Even though the Trend Composite just turned positive, PALL has been on the radar since the July breakout (green arrow). It has also held up relatively well over the last 2-3 months. The chart below shows PALL falling to the lower line of the rising channel and Aug-Sep lows (green line). The ATR Trailing Stop is just below these levels. The ETF is now short-term oversold and at support, which is a setup for a bounce.
The bottom window shows the Momentum Composite hitting -3 to become oversold on Friday. Note that I shortened the RSI periods from 10 to 5 to increase sensitivity in the Momentum Composite. %B is also part of the Momentum Composite and it signals oversold (<0) when price closes below the lower Bollinger Band (20,2), which occurred on Friday. Now that PALL is oversold, traders can either buy the falling knife and set a stop or wait for a StochRSI pop above .80.
The Momentum Composite aggregates signals in five momentum-type indicators to identify short-term overbought and oversold conditions. This indicator is part of the TIP Indicator Edge Plugin for StockCharts ACP[2]
Trend Composite Turns Positive for Livestock ETF (COW)
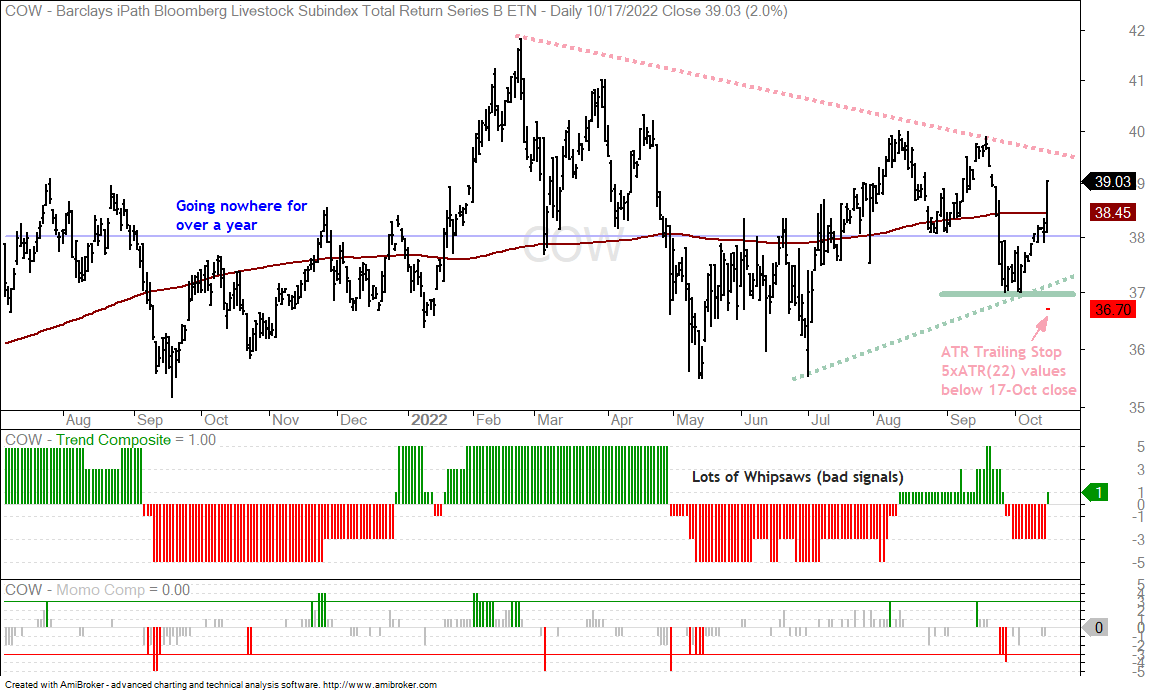
The Trend Composite turned bullish for the Livestock ETF (COW) on Monday. A look at the chart shows a large trading range for well over a year as the ETF oscillates around the 38 level. The Trend Composite has not been much help with lots of whipsaws during this period. The only reason I even consider COW is because we are in a bear market and stock alternatives are preferred. COW is part of the ETF MasterList to make it comprehensive and provide alternatives during bear markets. We never know which trend signals will result in a whipsaw (loss) and which will lead to an extended trend (profit). The red dash shows the ATR Trailing Stop at 36.70 for reference.
Trend and Momentum strategies work when there are uptrends and strong momentum. Over the last 25 years, the S&P 500 has been above its 200-day SMA 70% of the time, which means we can expect less than favorable market conditions around 30% of the time. It is not a cake walk. There are not many uptrends right now and momentum is only a short-term phenomenon. This means trend and momentum strategies are in drawdown right now and waiting for conditions to improve (bull market). Stock-based ETFs are the place to be in bull markets. Bear markets are for hunkering down and preserving capital.
SPY Turns Volatile after Big Decline (plus QQQ, IWM)
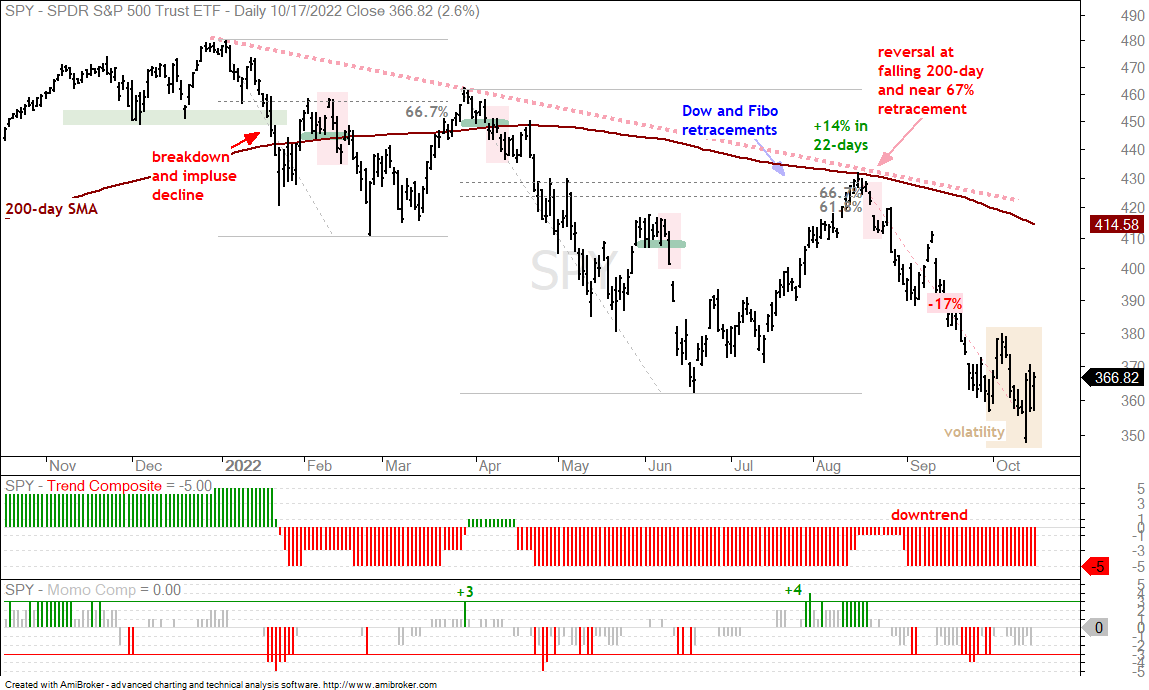
October is doing what October does best: swing with big moves to-and-fro. SPY surged around 5% on October 3-4, fell some 5% from October 6th to 11th, forged a massive intraday reversal on October 13th (Thursday) and then promptly fell 2.3% on Friday. This amounts to a bunch of noise within a long-term downtrend. SPY hit 52-week lows in September and October, the Trend Composite is negative and the ETF is well below the falling 200-day SMA. SPY fell 17% from mid August to early October and is entitled to an oversold bounce or consolidation. At this point, any bounce would still be considered an oversold bounce within a bigger downtrend.
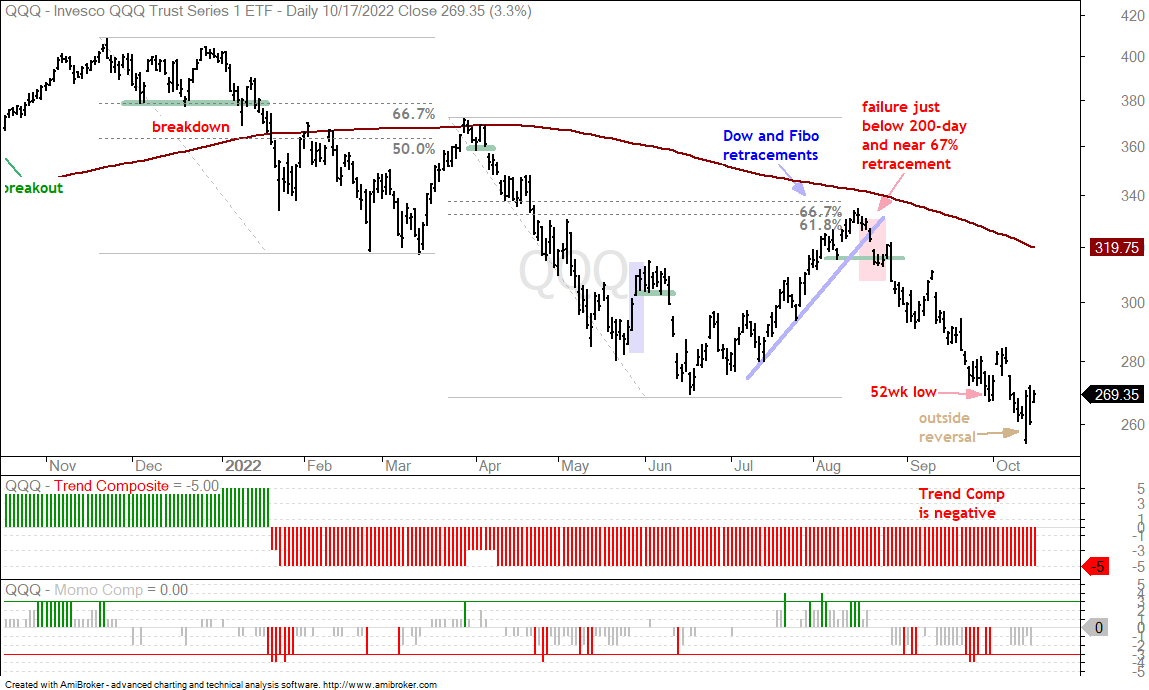
The next chart shows QQQ with an outside reversal on October 13th. Almost all stock-based ETFs forged outside reversals last Thursday. This pattern is akin to a bullish engulfing because it marks a strong one-day reversal after a weak open. The open is below the prior low and the close is above the prior high. One day is hardly enough to reverse the downtrend. Even though this could lead to an oversold bounce, I am not interested in bullish reversal patterns when the bigger trend is down and in a bear market. The long-term downside forces are stronger than the short-term bounce and this means the odds of a successful long trade are not favorable.
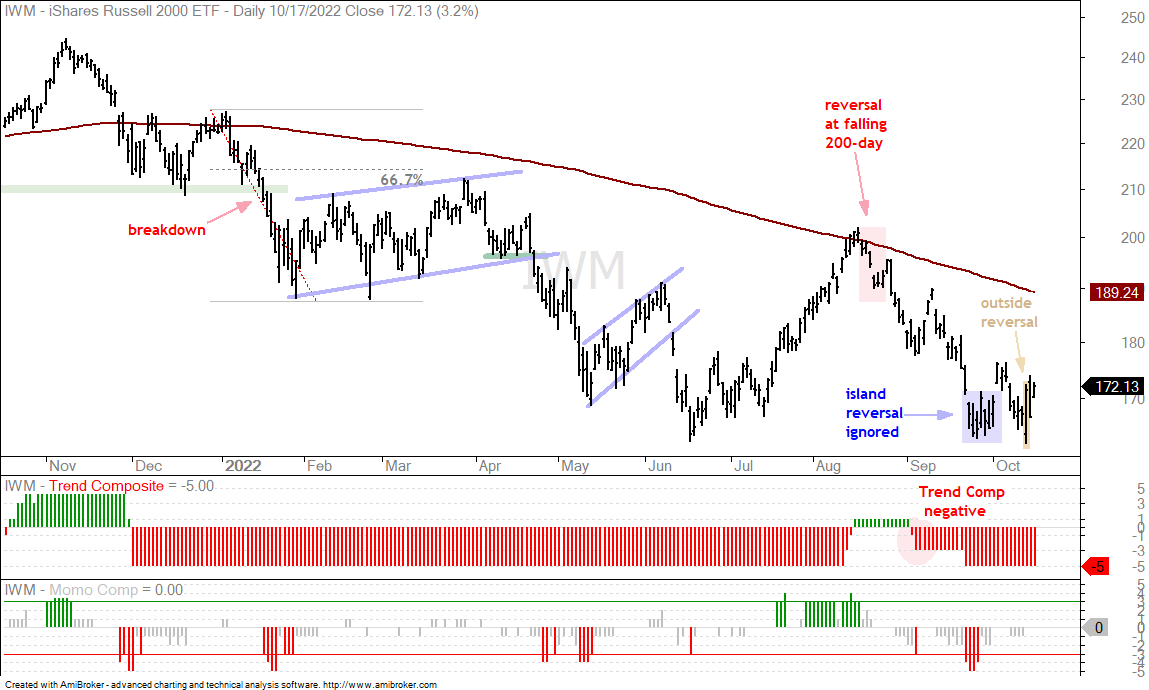
The Russell 2000 ETF (IWM) is holding up better than SPY and QQQ because it managed to hold its summer low in late October and the mid-October closing low held above the late September closing low. IWM forged an island reversal in early October, but fell back into the consolidation (blue shading). An outside reversal day is now in play, short-term. Again, I am not interested in short-term bullish setups when the long-term trend is down and in a bear market.
Biotech SPDR Corrects after Surge (XBI)
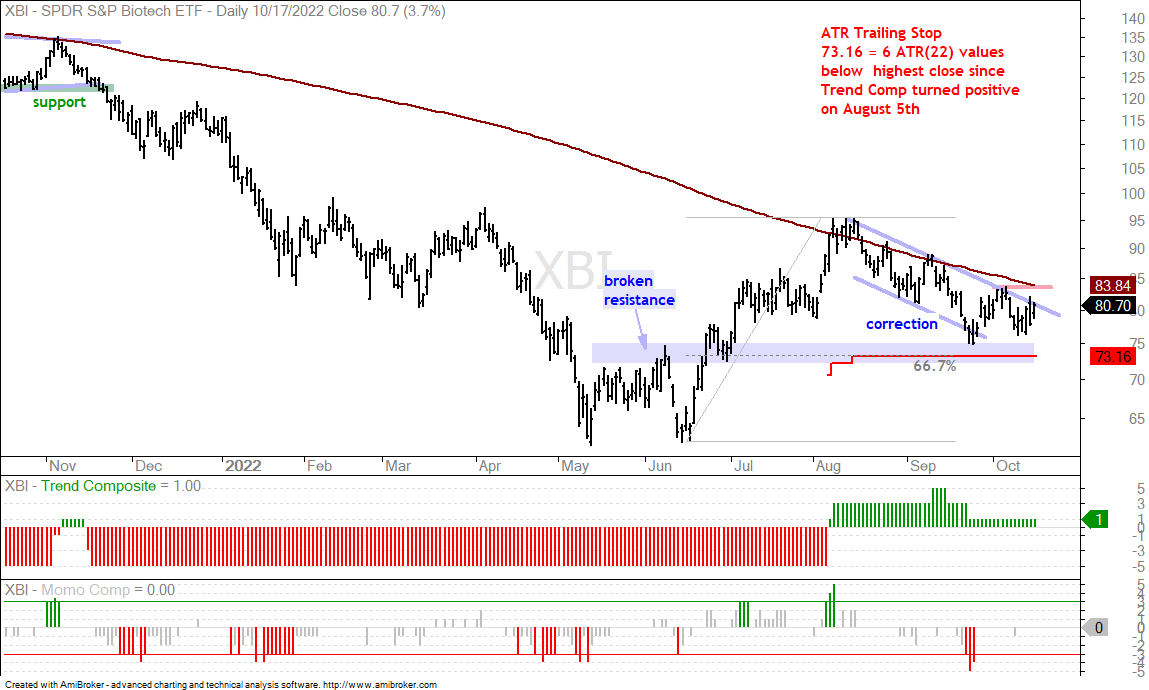
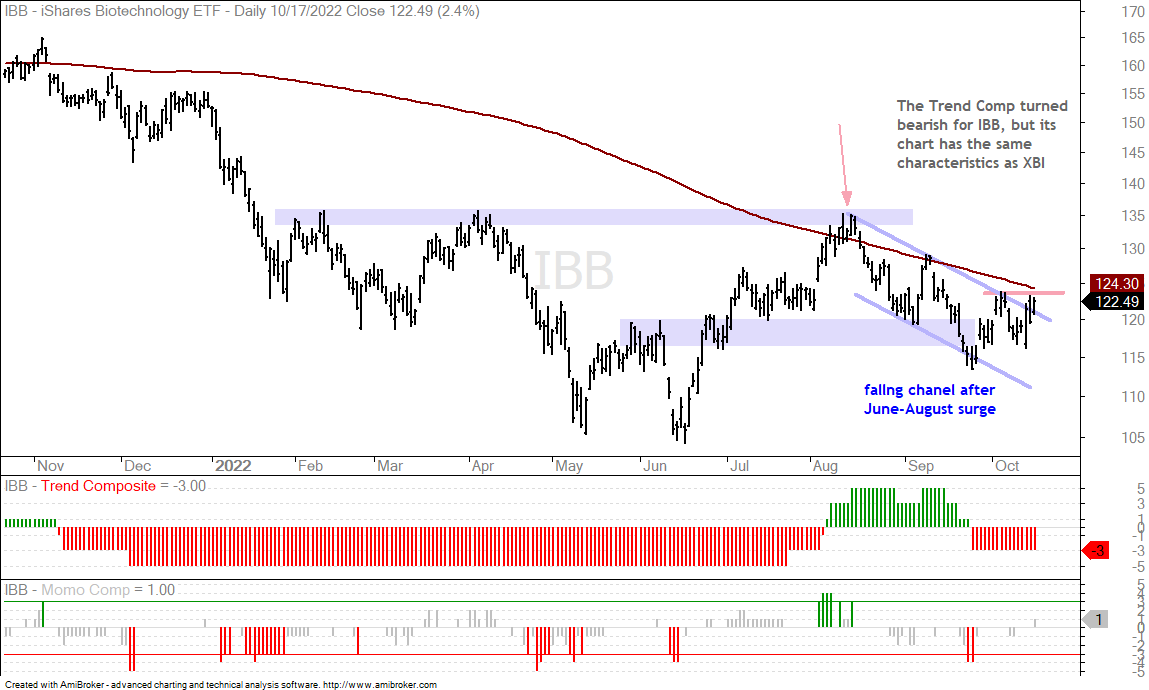
The Biotech SPDR (XBI) remains one of the strongest ETFs in the MasterList because it’s Trend Composite is positive, it held well above the summer lows in September and the mid October low held above the late September low. The decline from mid August to mid September looks like a correction because it retraced 50-67% of the prior advance and formed a falling channel. The ETF also found support near the prior breakout zone (blue shading). Even though XBI is holding up better than SPY, it is not immune to broad market swings because it moved in tandem with SPY from mid June to mid August (up) and mid August to late September (down).
The Trend Composite aggregates signals in five trend indicators: Bollinger Bands (125,1), Keltner Channels (125,2), 5-day Rate-of-Change of 125-day SMA, StochClose (125,5) and CCI-Close (125). The Trend Composite and ten other indicators are part of the TIP Indicator Edge Plugin for StockCharts ACP[2]
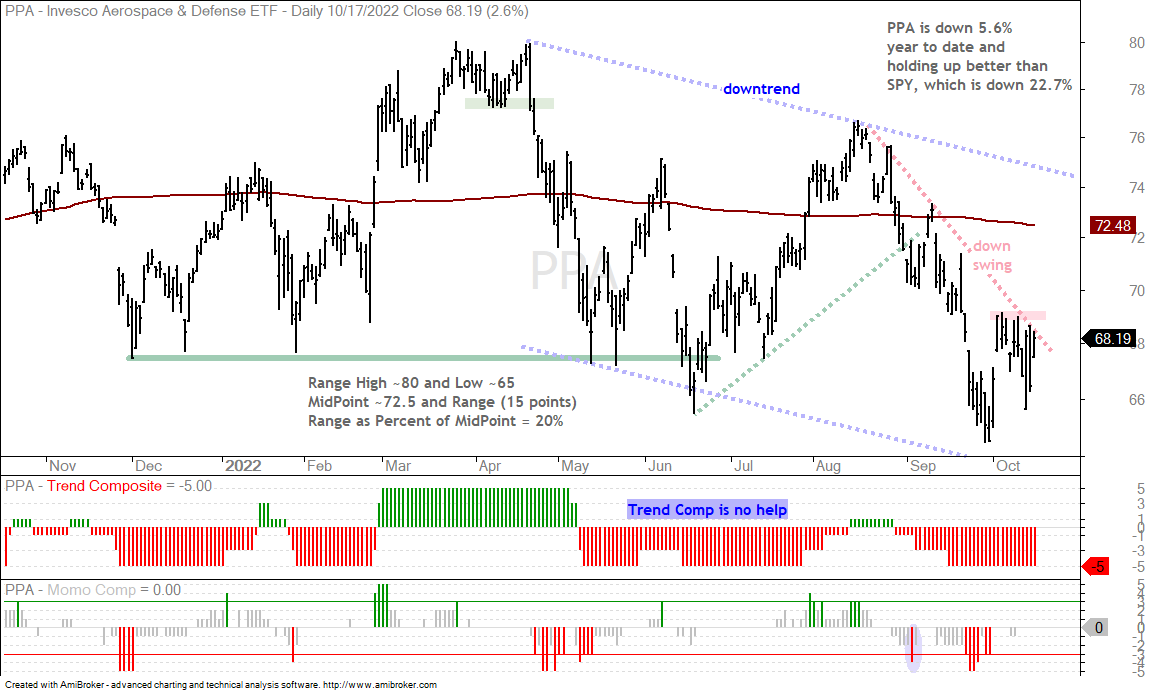
The Aerospace & Defense ETF (PPA) remains on my radar because it is less sensitive to economic swings and less correlated to the broader market than your average stock-based ETF. SPY is down over 20% year-to-date and PPA is down 5.6%. On the price chart, PPA is in a downtrend with lower lows and lower highs since May (blue dashed lines). The swing within this large falling channel is also down (August to September). The Trend Composite and 200-day SMA are no help so I am focused on the immediate swings. The red dashed line and red resistance zone define the current downswing. A break above 69 would reverse this downswing and argue for another upswing.
You can learn more about exit strategies in this post[3], which includes a video and charting options for everyone.
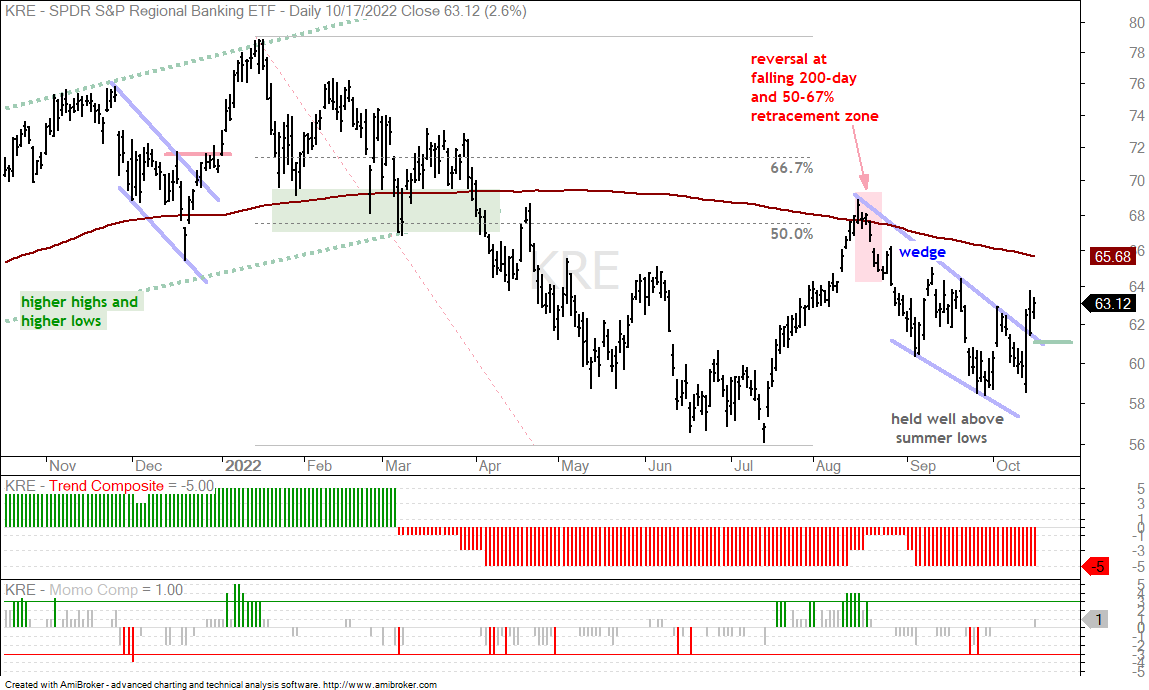
Regional Bank ETF Breaks early October High (KRE)
I highlighted the Regional Bank ETF (KRE) and Home Construction ETF (ITB) last Thursday because they were holding up better than SPY. ITB fell sharply on Friday and is probably best avoided with the 10-yr Treasury Yield pushing 4%. Banks may view the rise in Treasury yields differently, but I am not a specialist on banking fundamentals so will refrain from speculation. KRE is still a stock-based ETF and still tied to broad market moves. The chart shows KRE with a falling wedge into September. KRE held well above the summer lows and broke out with a surge the last three days. Not many ETFs are trading at their high of the month (October) right now and KRE shows relative strength. A close below 61 would argue for a re-evaluation.
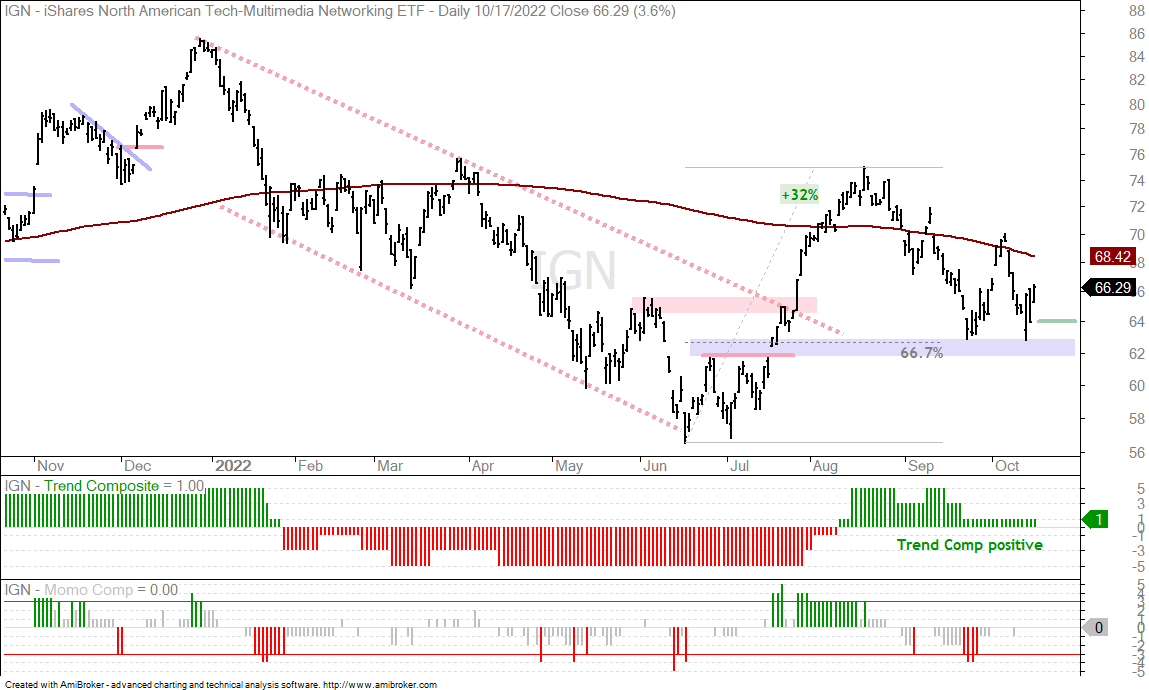
Networking ETF Tests Breakout Zone (IGN)
The Networking ETF (IGN) is by far the strongest of the tech-related ETFs. Note that SKYY, CIBR, FDN, IPAY, SOXX and IGV recorded 52-week lows in October, while IGN remains well above its summer lows and the Trend Composite is positive. We are still in a bear market and IGN is below its falling 200-day, but it is the least dirty shirt in the wardrobe. The chart shows IGN surging from early July to mid August and retracing around 2/3 of this advance with a decline back to the 63 area (blue shading). This zone is near a prior resistance level and marks a support-reversal zone. Like the rest of the market, IGN forged an outside reversal to affirm support here and followed through with a big gain on Monday. A close below last week’s closing low (63.98) would call for a re-evaluation.
You can learn more about exit strategies in this post[3], which includes a video and charting options for everyone.
Oil Turns Down as DB Energy ETF Forms Pennant (CL1!, DBE)
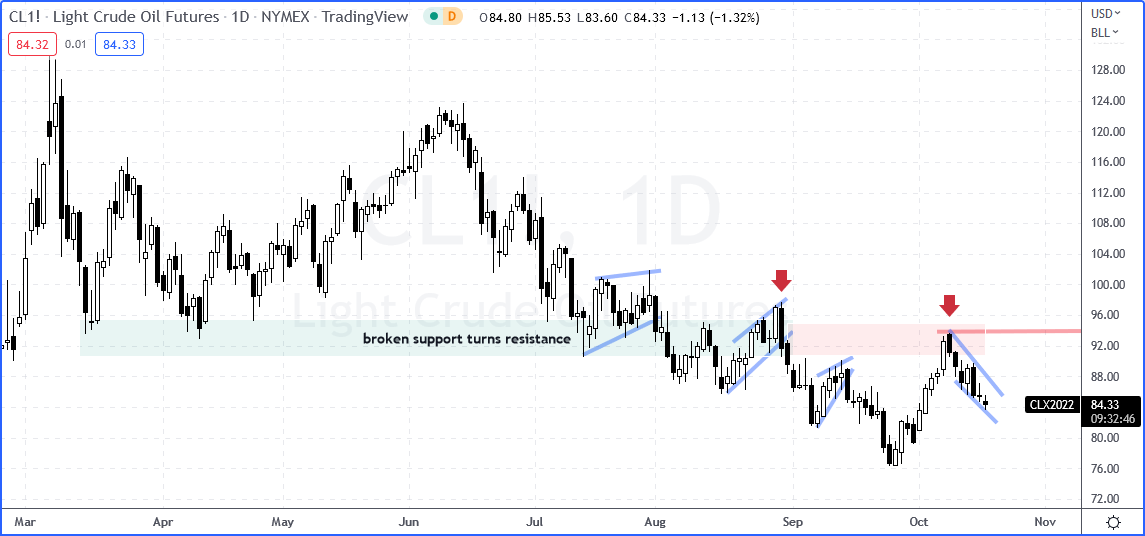
Light Crude Futures (CL1!) remain in a downtrend since June with lower lows and lower highs the last five months. Oil surged from late September to early October on the heels of OPEC+ supply cuts, which were announced on October 5th. Oil surged above 92 two days later and then fell the last seven days. I am bearish on oil because the bigger trend is down, prices reversed in the prior support zone (green/red shading) and the short-term trend is down (falling wedge). A close above 90 would reverse the short-term downtrend and call for a re-evaluation.
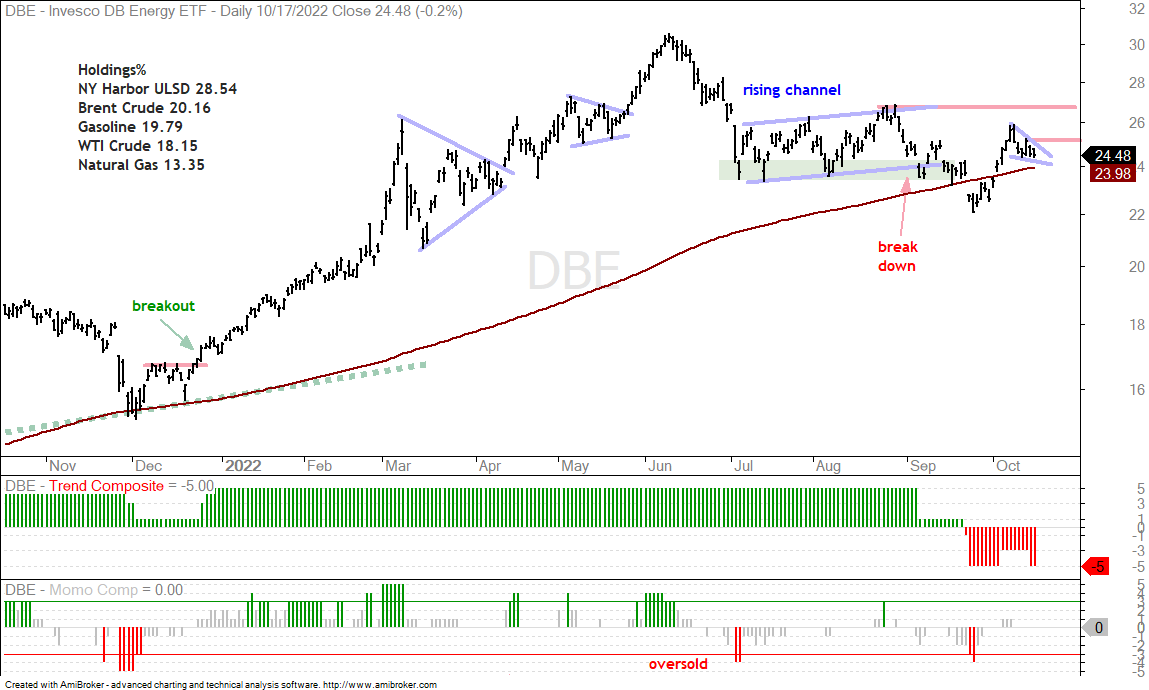
The next chart shows the DB Energy ETF (DBE) in a downtrend overall since the September breakdown. The ETF bounced back above the rising 200-day SMA as oil surged into early October. The ETF then fell back the last six days with a small pennant, which could be a short-term bullish continuation pattern. A short-term breakout in oil (above 90) and pennant breakout in DBE (above 25.5) would be bullish for the energy complex. I will stay bearish until we see said breakouts.
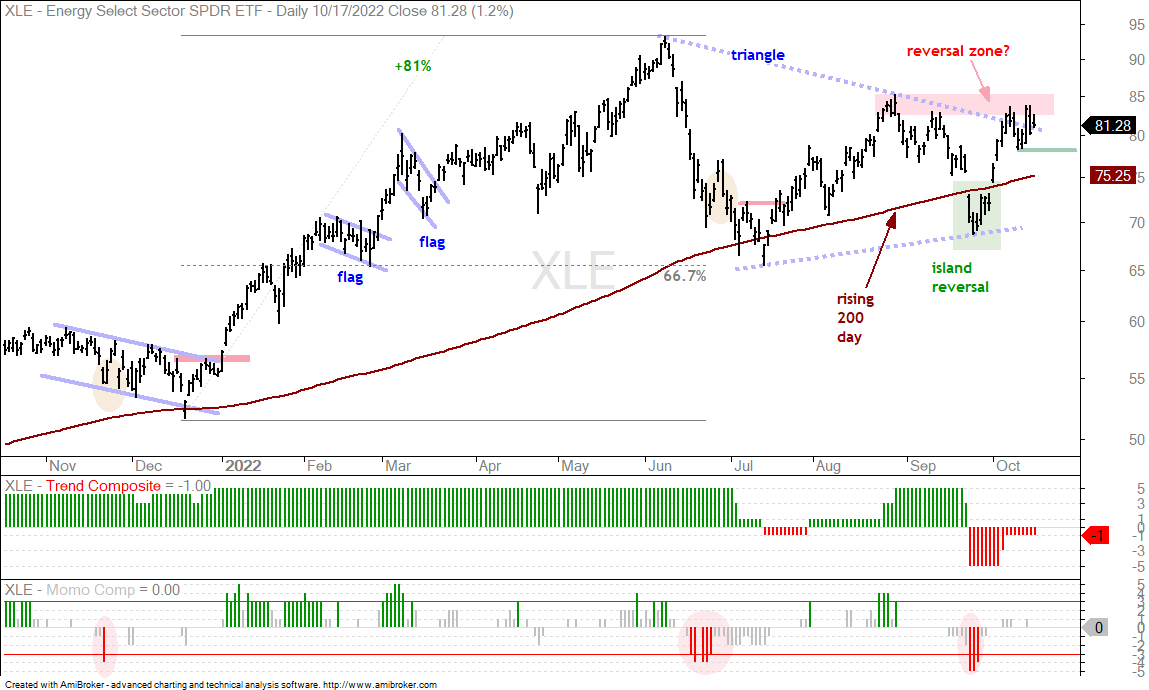
Energy-based ETFs Hit Make or Break Zones (XLE, XOP, FCG)
The Energy SPDR (XLE) remains near a make or break zone. XLE surged some 81% into mid June and then consolidated with a big triangle. This triangle could represent a rest after the big advance, which would make it a bullish continuation pattern. Further strength would solidify a triangle breakout and signal a continuation of the December-June advance.
XLE also held up relatively well as oil fell the last seven days. A breakout in oil would be positive for this group, but further weakness would likely weigh. XLE is trading in a resistance zone marked by the August-September high (red shading). The short-term swing remains up since the island reversal with short-term support set at 78 (green line). A break here would reverse the short-term upswing and be short-term bearish for XLE.
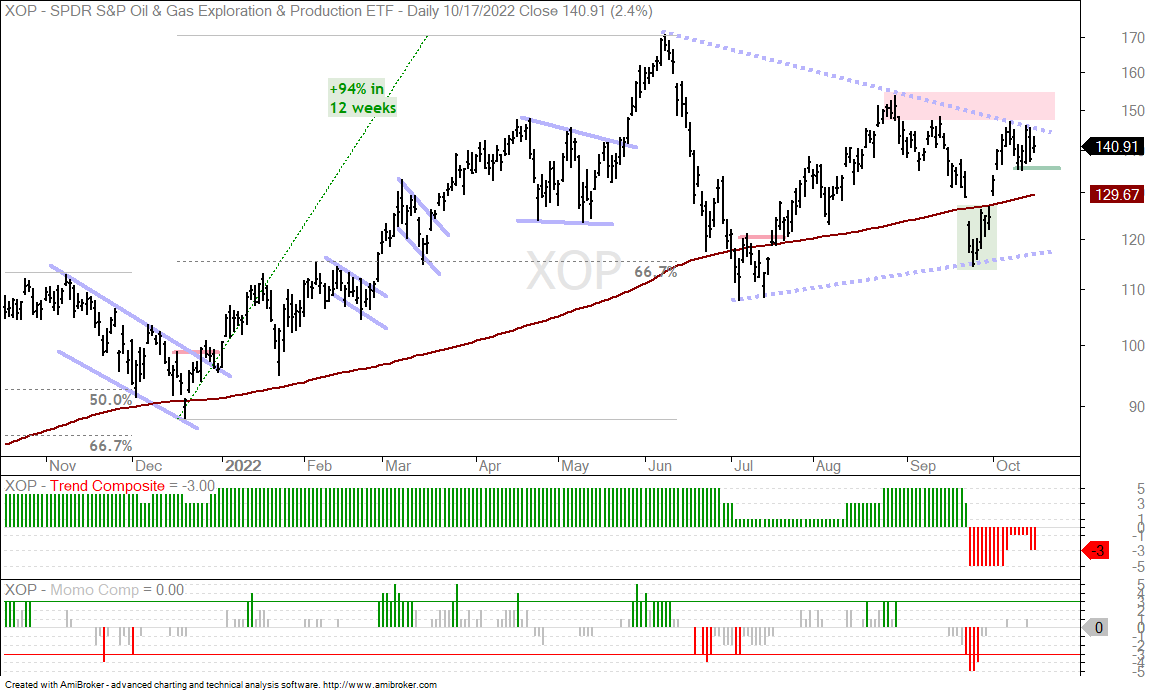
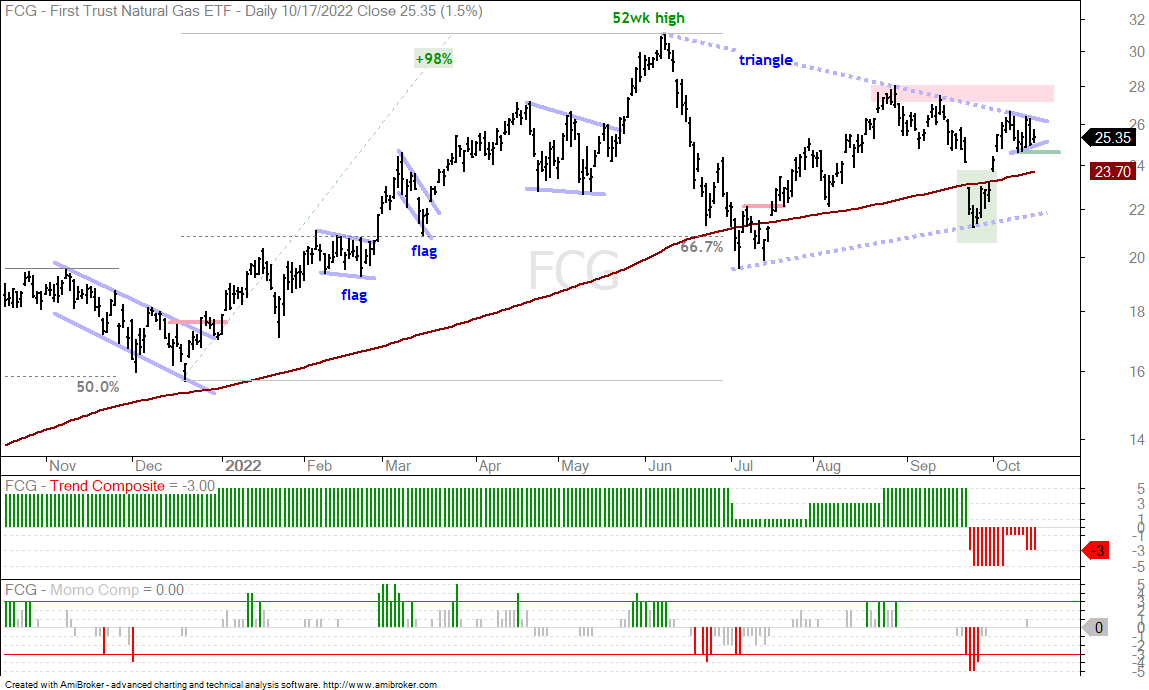
The chart above shows the Oil & Gas Exploration & Production ETF (XOP) with similar characteristics. The next chart shows the Natural Gas ETF (FCG) falling short of the resistance zone and stalling the last two weeks with a small pennant. A breakout at 26.5 would be short-term bullish, while a break below 25.5 would be short-term bearish.