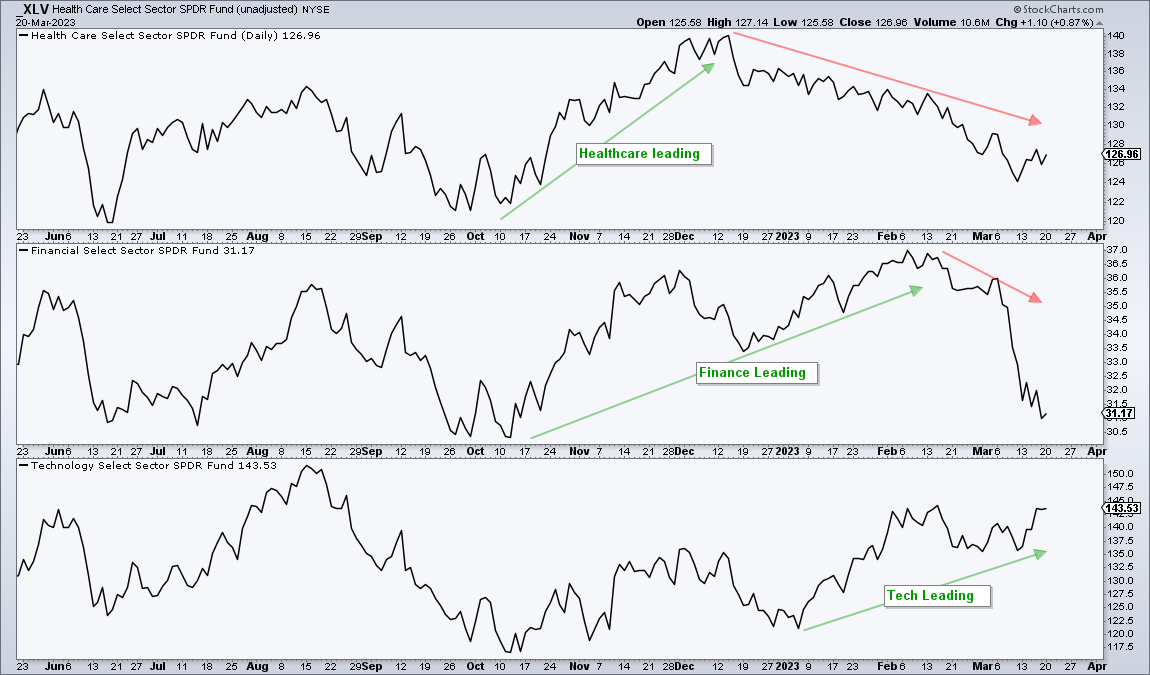
The market went through some serious rotations over the last few months. The Finance sector led the market off the October low and then fell apart over the last four weeks. Healthcare and the defensive groups led the market from early October to mid December with big gains and then succumbed to selling pressure the last three months and underperformed. We now have QQQ, the tech sector, the comm-services sector and semiconductors leading the market in 2023.
Large-cap tech stocks are holding up the market and leading right now. Leadership, however, is subject to change so I would watch the current upswings closely. By that same token, I would also monitor downswings in the defensive groups because they could return to relative strength. Basically, it is a market of big swings, not extended trends. This means we have to be more nimble because a seemingly innocent downswing can evolve into a double digit decline.
About the ETF Trends, Patterns and Setups Report
This report contains discretionary chart analysis based on my interpretation of the price charts. This is different from the fully systematic approach in the Trend Composite strategy series. In this ETF Trends, Patterns and Setups report, I am looking for leading uptrends and tradable setups within these uptrends. While I use indicators to help define the trend and identify oversold conditions within uptrends, the assessments are mostly based on price action and the price chart (higher highs, higher lows, patterns in play). Sometimes the chart assessment can be at odds with the indicators.
Report Schedule
Tuesday – 21-Mar: Market/ETF Report
Wednesday – 22 Mar: Market/ETF Video
Thursday – 23 Mar: Strategy Update or Article
Systematic Strategies and Tables
Here are the three active strategies and their respective tables.
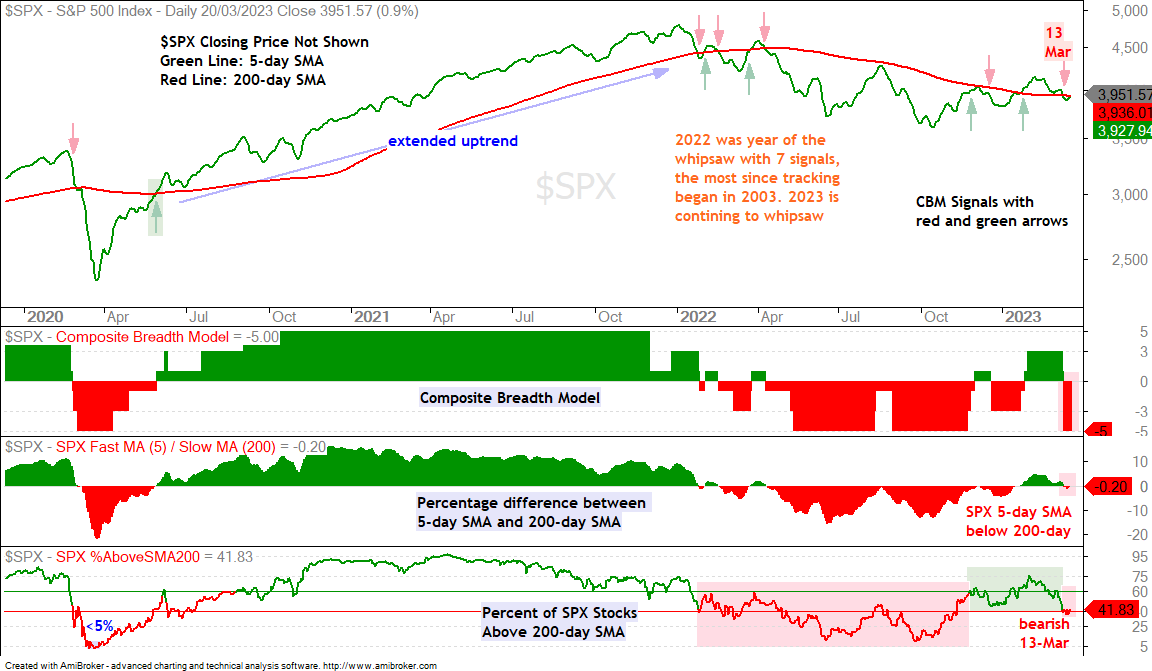
We can debate if this is a bear market or not, but it is clearly not a bull market that lifts all boats, or even the majority of boats. The Composite Breadth Model is at -5 and BBB yield spreads show serious stress as they widened significantly from March 7th to 15th. The Fed is not sitting on the sidelines as the balance sheet expanded by $297 billion last week and erased four months of contraction. At best, the market is choppy with internal rotations. At worst, we are in a bear market environment and risk levels are above average for stocks and stock-based ETFs.
The Fed meets on Tuesday and will make its policy statement on Wednesday at 2PM. Given the events of the last two weeks, this is one of the most anticipated Fed meetings in a long time. My advice is to turn off the news and watch the charts after the dust settles. We can expect some short-term volatility (noise) in bonds, the Dollar, gold and stocks.
TLT Stalls at Resistance
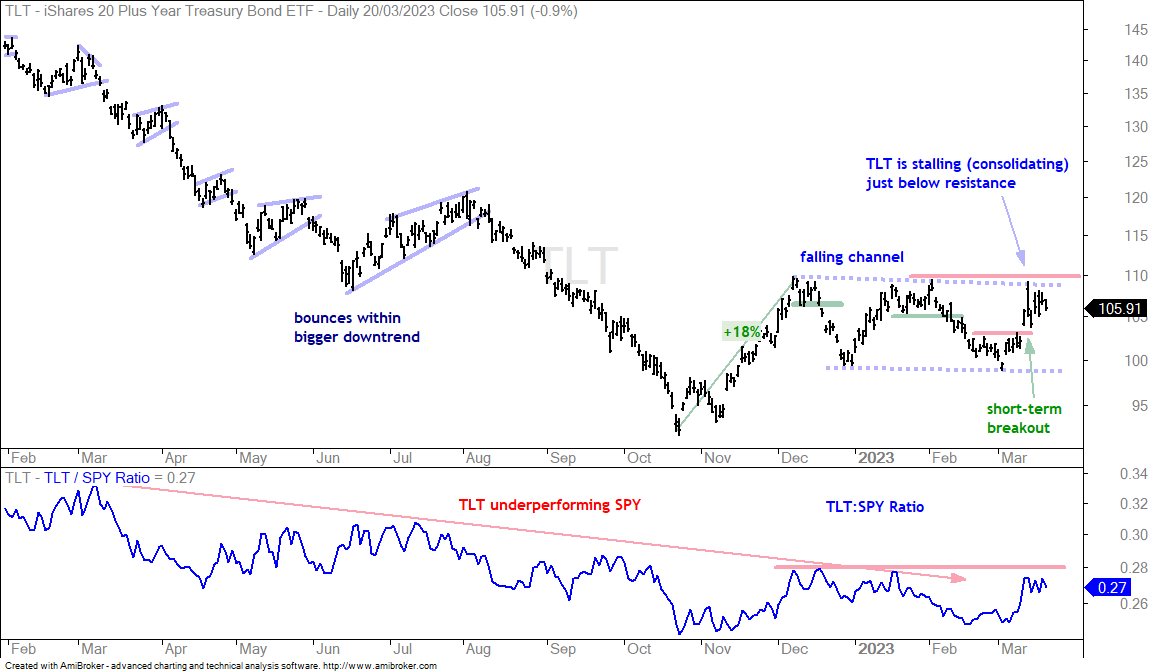
The Trend Composite turned positive for several bond ETFs over the past week (IEI, IEF, AGG, LQD TIP, STIP). The 20+ Yr Treasury Bond ETF (TLT) is the longest duration bond ETF (20+ years) and most of the action is at the shorter end of the curve. Hence, the Trend Composite turned positive for the 3-7 Yr Treasury Bond ETF (IEI), but has yet to turn positive for TLT. This is a bet that the Fed will rethink its policy. The chart below shows TLT surging from mid October to mid December and then correcting with a falling channel the last three months. TLT surged in early March to reverse the downswing within this channel and then stalled just below resistance. A breakout at 110 would reverse the downtrend and argue for a move to the 120 area. A breakout in TLT would point to a decline in the 10-yr Treasury Yield.
Dollar Reverses Short-term Upswing
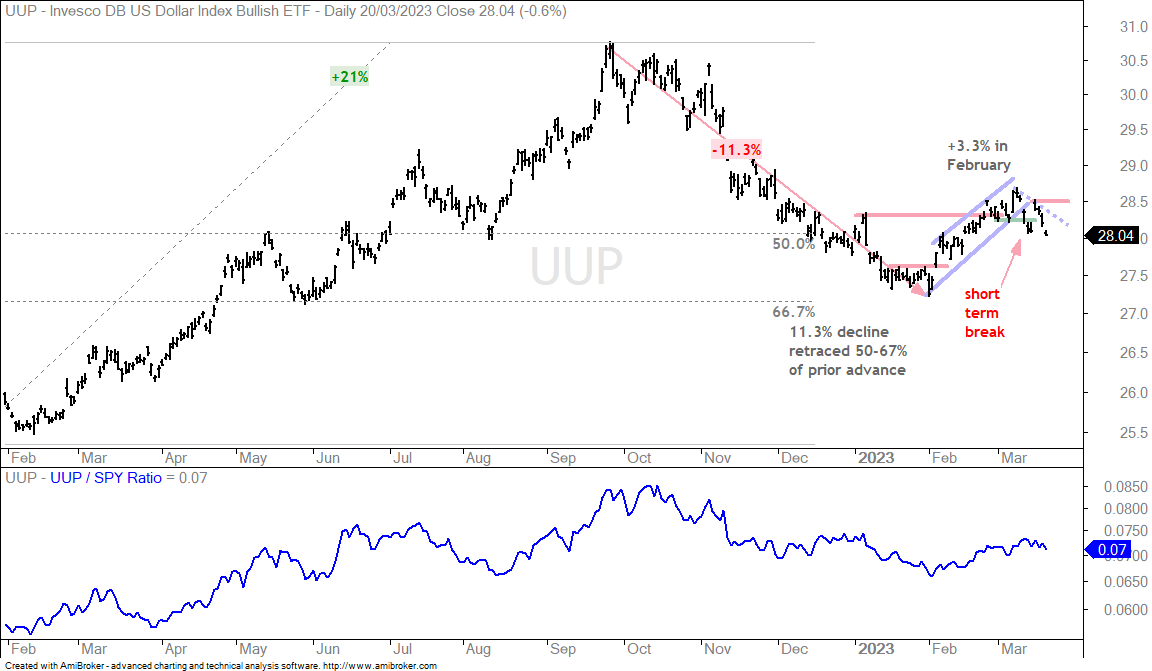
The Dollar Bullish ETF (UUP) has been negatively correlated to TLT, which means it tends to move in the opposite direction. UUP fell from October to December as TLT advanced and UUP bounced in February as TLT fell. Most recently, UUP broke short-term support to reverse its upswing. I am marking resistance at 28.5 and a breakout here would reverse this downswing.
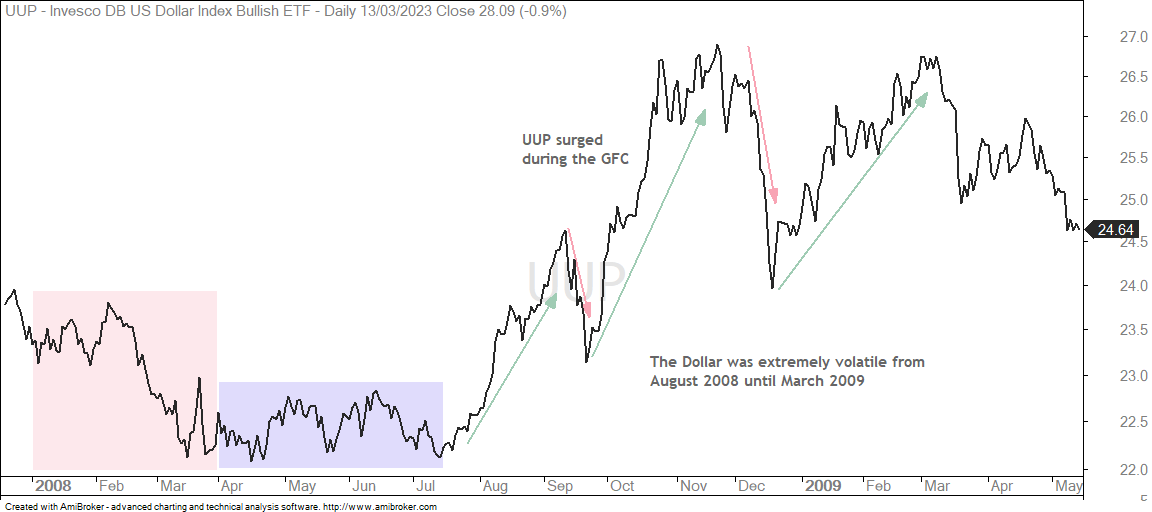
The US Dollar is often the safe haven currency that benefits in times of turmoil. Note that the Dollar fell in the first quarter of 2008, firmed into the summer and surged from mid July to late October, which was the height of the Global Financial Crisis. I am NOT predicting another GFC, but I consider the Dollar a safe haven currency.
Precious Metals Extend on Breakouts (GLD, SLV, PLTM)
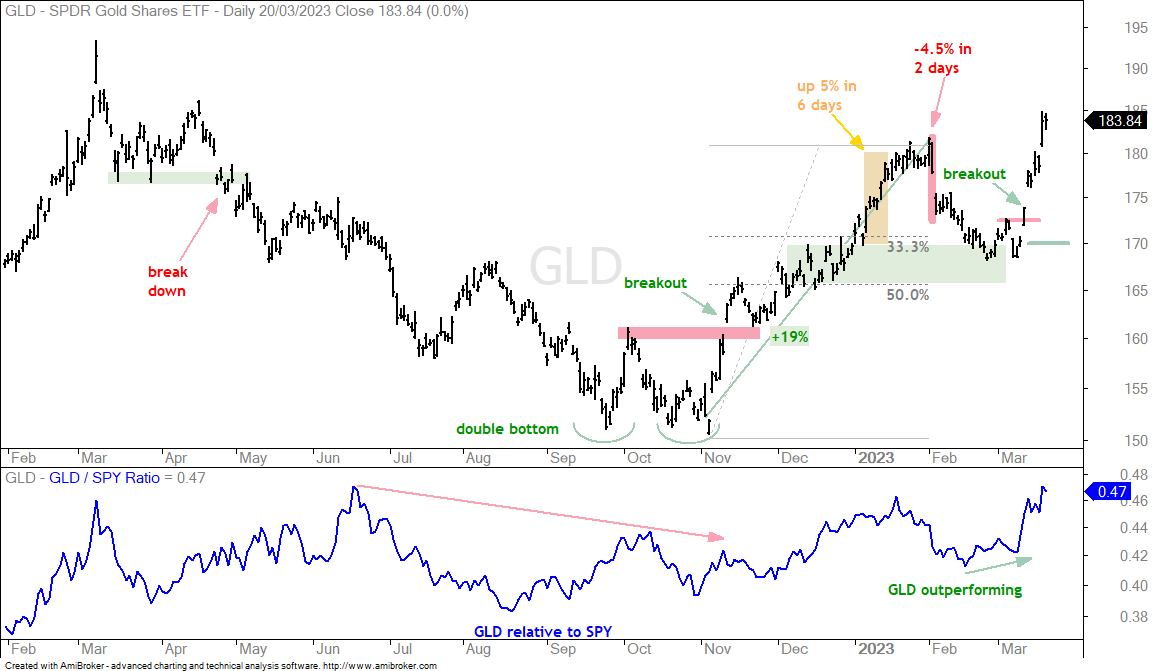
Precious metals benefitted from the decline in the Dollar and uncertainty in the financial markets. The first chart shows the Gold SPDR (GLD) breaking out on March 10th and rising 3.36% the last five days. Overall, GLD advanced some 19%, retraced 33-50 percent of this advance and found support in late February-early March. The breakout reversed this pullback and the long-term trend is clearly up for GLD. Gold is also leading most other assets in March. I am not sure where to mark support or my re-evaluation at this stage and will leave it at 170 for now.
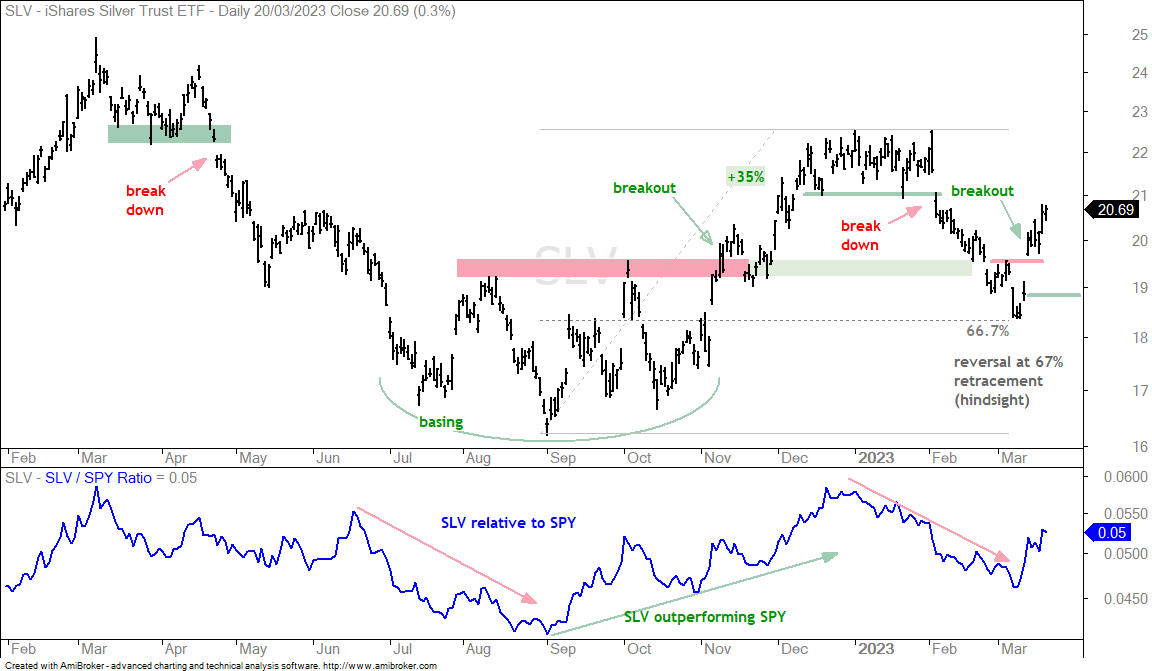
The next chart shows the Silver ETF (SLV) retracing 2/3 of the prior (35%) surge and breaking out with a surge on March 10th and 13th (Friday-Monday). SLV continued higher after the breakout and remains bullish. SLV is just gold on steroids and has a much higher standard deviation than gold.
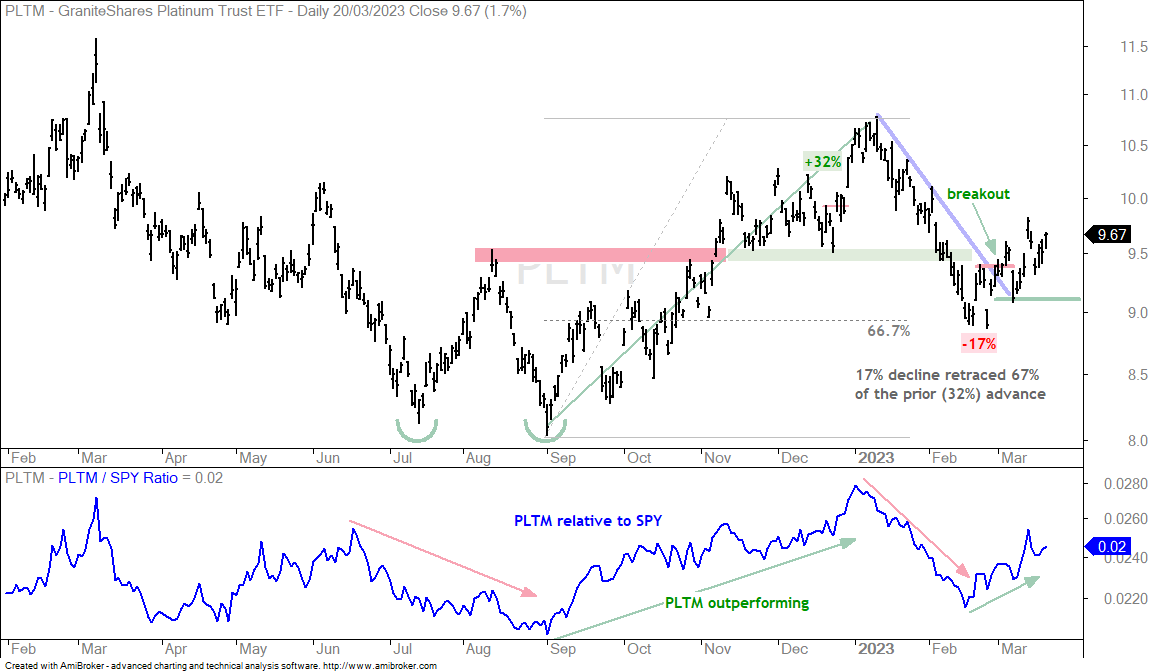
The next chart shows the Platinum ETF (PLTM) with characteristics similar to SLV. The green line marks the re-evaluation at 9.10.
Gold Miners ETF Extends on Breakout and Leads (GDX, SIL)
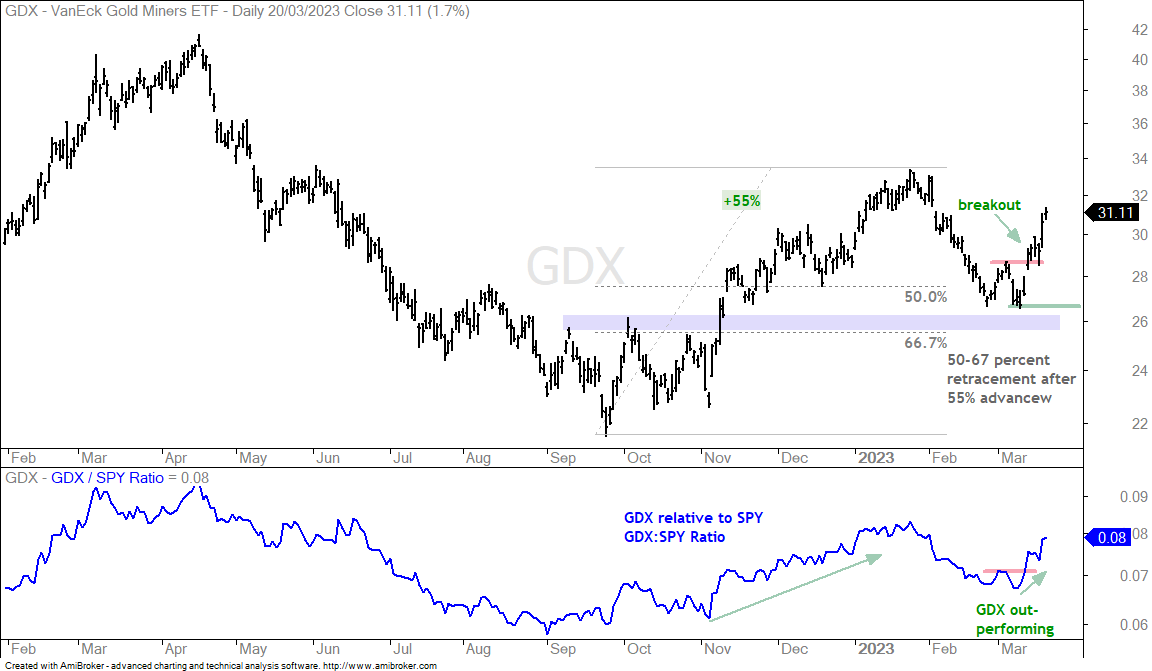
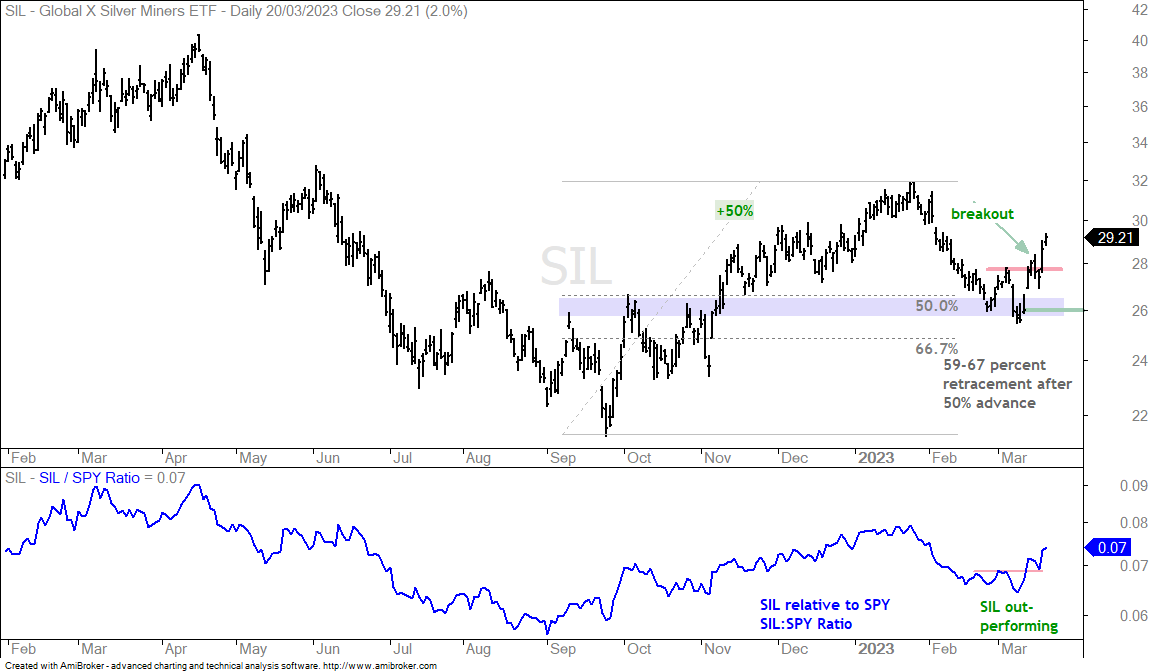
Unsurprisingly, the Gold Miners ETF (GDX) followed gold and joined the breakout parade. The charts are all quite similar: big move (+55%), retracement (50-67%), support found in late February-early March and a breakout. This is a two steps forward (+55%) and one step backward (retracement) sequence that indicates an uptrend. Marking the re-evaluation is the big challenge right now. I could set it at 28, but this may be too tight and I would like to allow a little wiggle room. For now, I will leave it at the early March low.
The next chart shows SIL with similar characteristics.
QQQ Continues to Lead with a Breakout
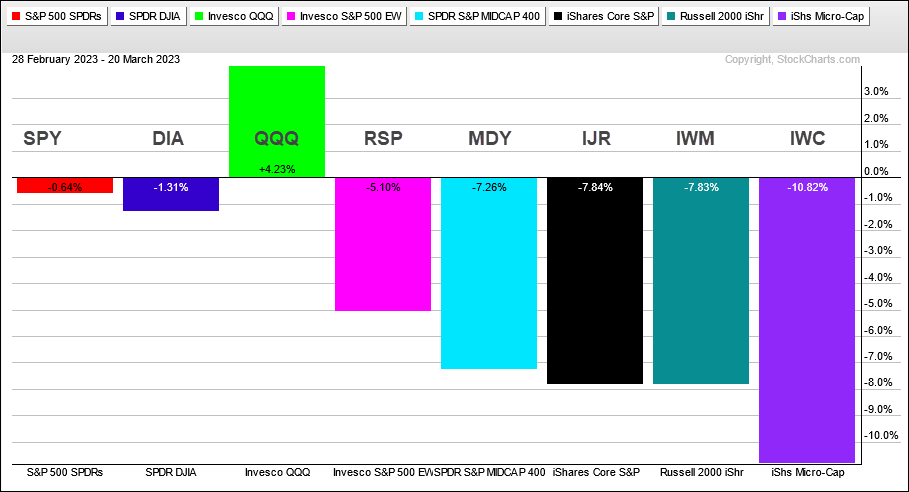
QQQ reflects the current dislocation within the stock market. SPY is down .64% in March, the S&P MidCap 400 SPDR (MDY) is down 7.26% and the Russell 2000 ETF (IWM) is down 7.83%. SPY is holding up a lot better than MDY and IWM. On the complete other side, QQQ is up 4.23%. Note that Nasdaq 100 stocks account for some 35% of the S&P 500. There is a crazy dislocation between large-caps and mid-small caps, and between large-cap techs and the rest of the market.
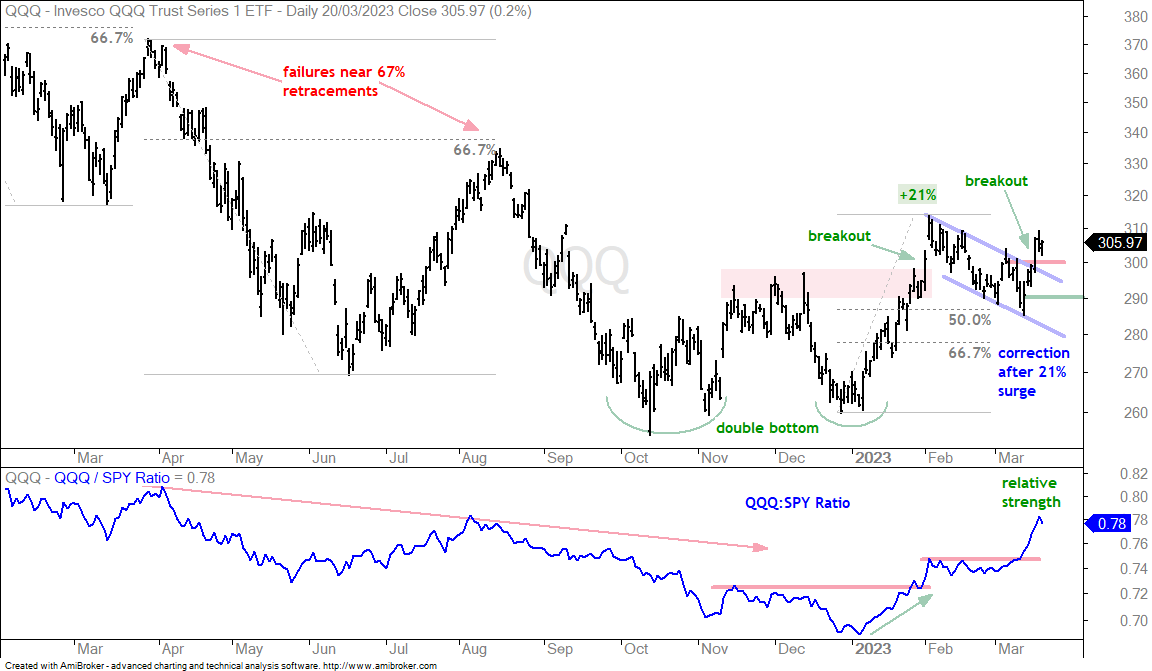
The chart below shows QQQ with a double bottom breakout, a pullback after the 21% advance, a falling channel that retraced 50-67 percent and a channel breakout last Thursday. The double bottom breakout was bullish, but QQQ was overbought after the 21% advance. The correction alleviated the overbought condition and provided a tradable setup. Chartists can look for a short-term reversal within the falling channel or trade the breakout. This current breakout is bullish until proven wrong and I will mark my re-evaluation at 290. The indicator window shows the price-relative (QQQ:SPY ratio) breaking out on March 10th, three days before the price breakout.
Tech and Comm Services Lead, while Defensive Sectors Hold Up
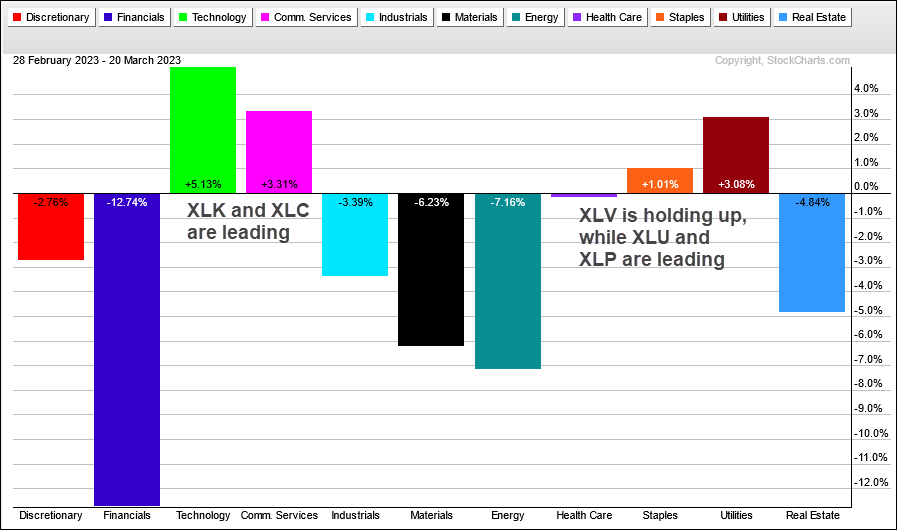
The next chart shows performance for the eleven sectors in March. The Technology SPDR (XLK) and Communication Services SPDR (XLC) are up and leading. The Healthcare SPDR (XLV) is down a fraction and holding up relatively well. The Utilities SPDR (XLU) is up 3% and leading, while the Consumer Staples SPDR (XLP) is up 1% and showing relative strength. It is a strange mix, but it is what it is.
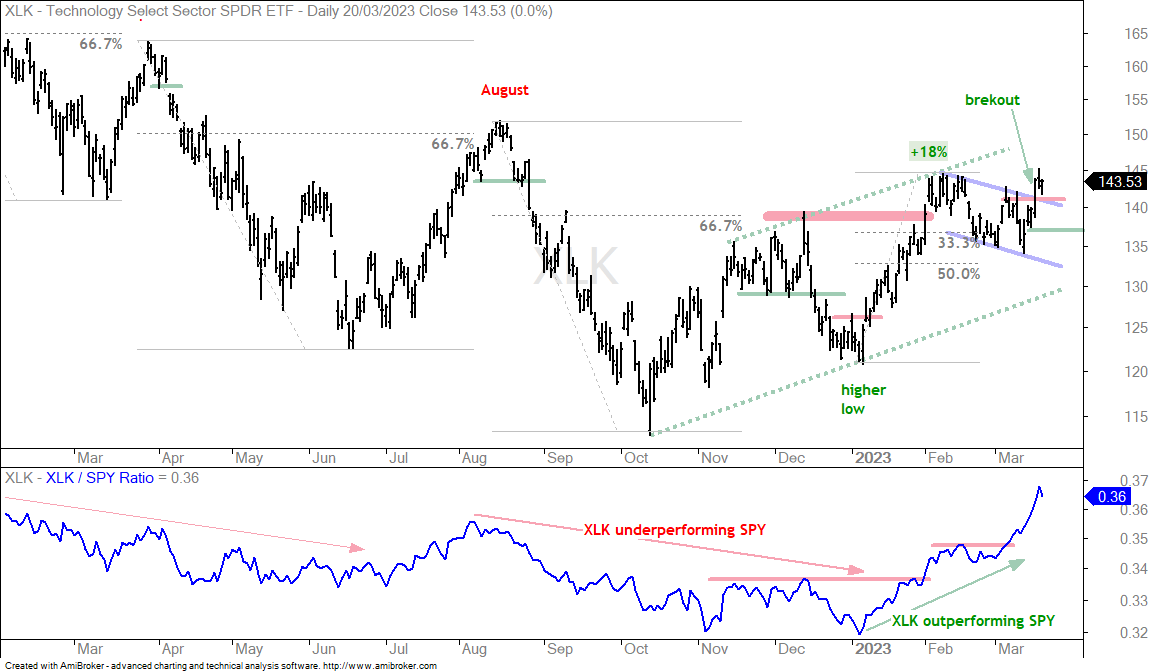
The next chart shows the Technology SPDR (XLK) with a rising channel since the October low. XLK advanced 18%, retraced 33-50 percent with a falling flag and broke out with a surge on Thursday. The green line marks my re-evaluation level at 137. The indicator window shows the price-relative rising the entire year as XLK outperforms SPY in 2023.
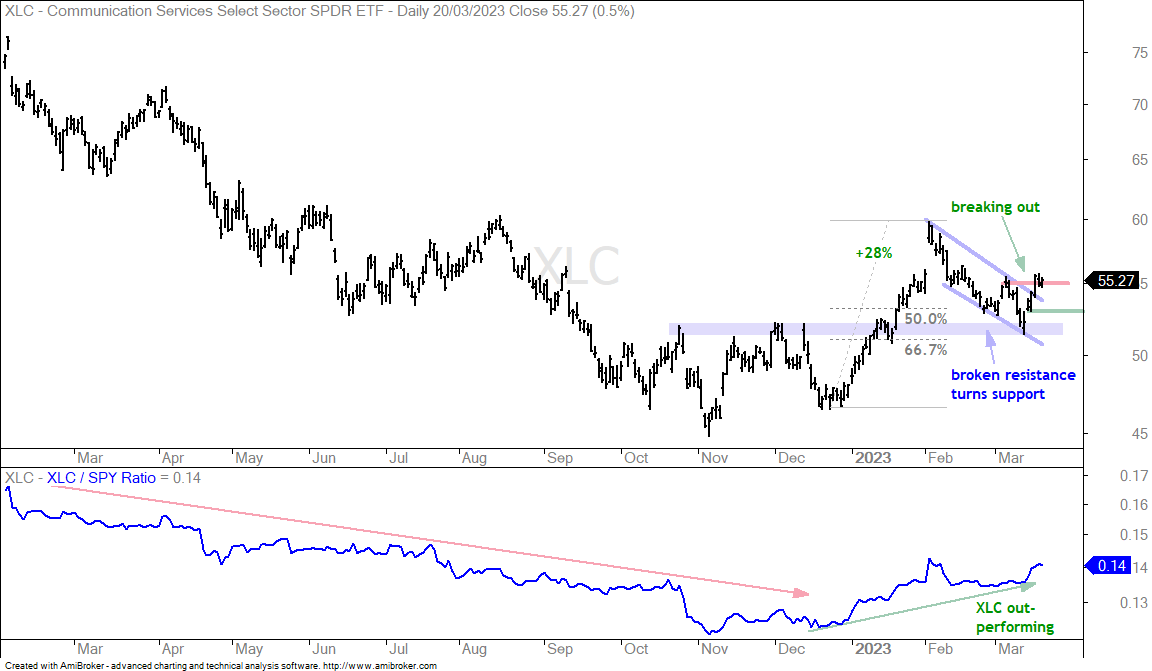
The next chart shows XLC with a bounce off broken resistance and a breakout working.
Semis Lead Tech-Based ETFs (SOXX, IGV, CIBR)
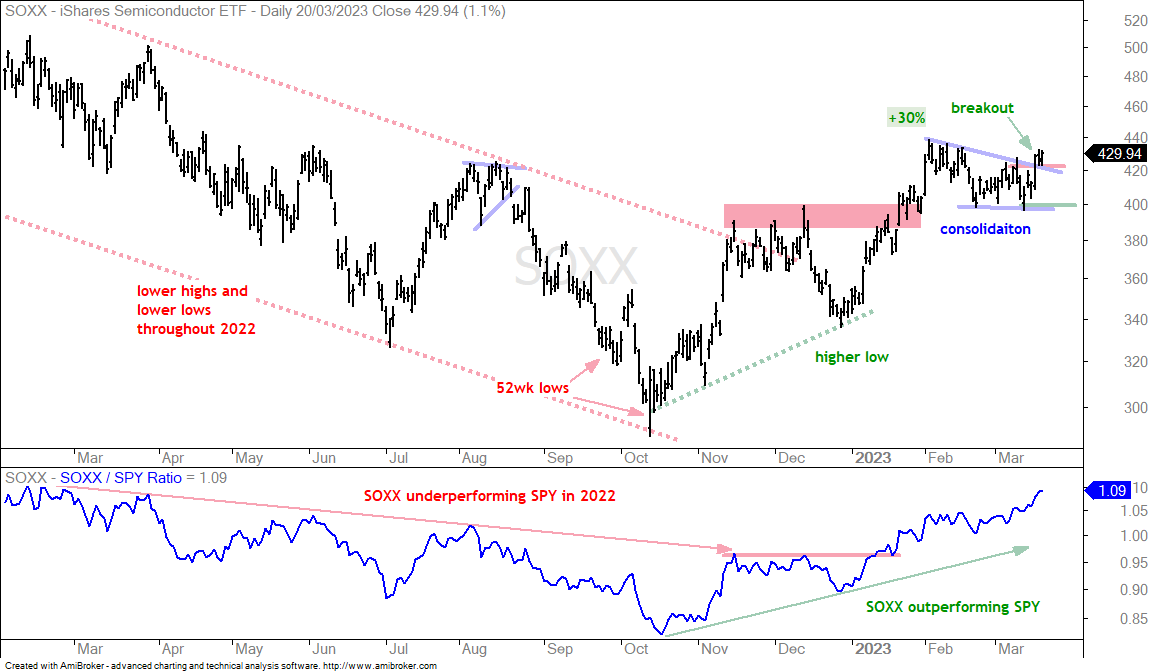
Even though we are seeing breakouts in QQQ and XLK, I am not seeing a lot of breakouts in the tech-related ETFs. Relative strength is concentrated in ETFs related to large-cap semiconductors (SOXX, SMH). This is disconcerting because strength in tech is not across the board. Keep in mind that the tech sector is a cyclical sector and dependent on the economic cycle. The same goes for semiconductors. The first chart shows SOXX with a 30% surge, a consolidation into March and a breakout on Thursday. The overall trend is up and the breakout is bullish until proven wrong. I am marking support at 400. The indicator window shows the SOXX:SPY ratio moving higher since October as SOXX continues to lead.
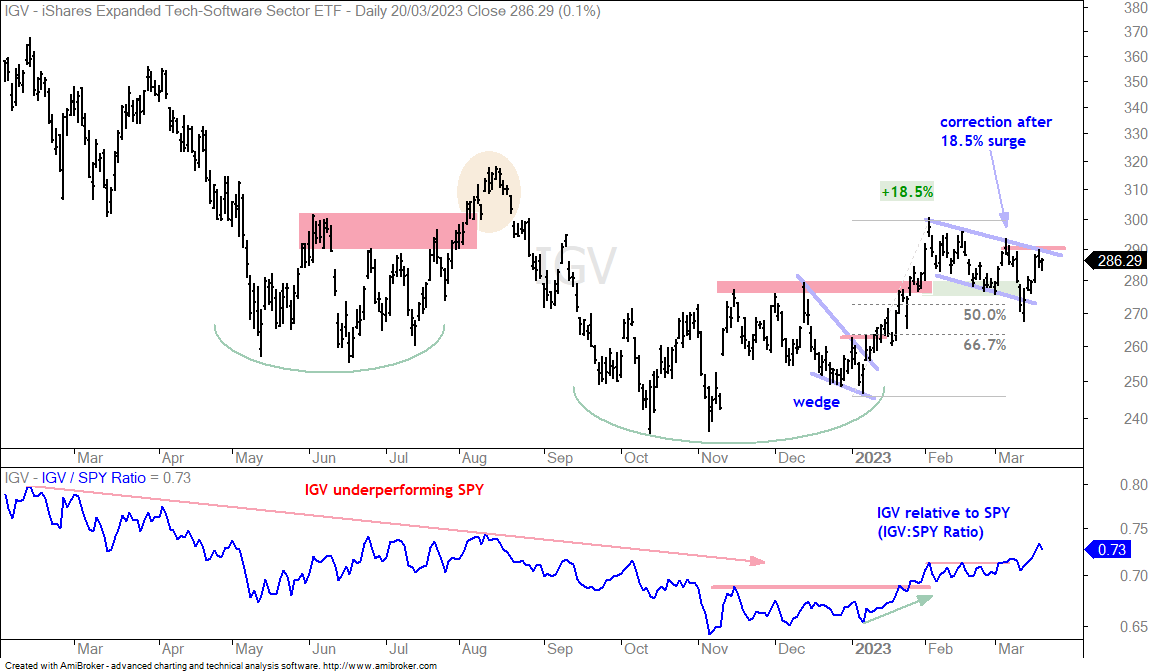
The next chart shows the Software ETF (IGV) with an 18.5% advance and a pullback that retraced 50-67%. The short-term trend is still down because IGV is short of a breakout. IGV was mildly oversold with the dip below 270 last week and got a bounce the last five days. A breakout at 290 is needed to reverse the short-term downtrend.
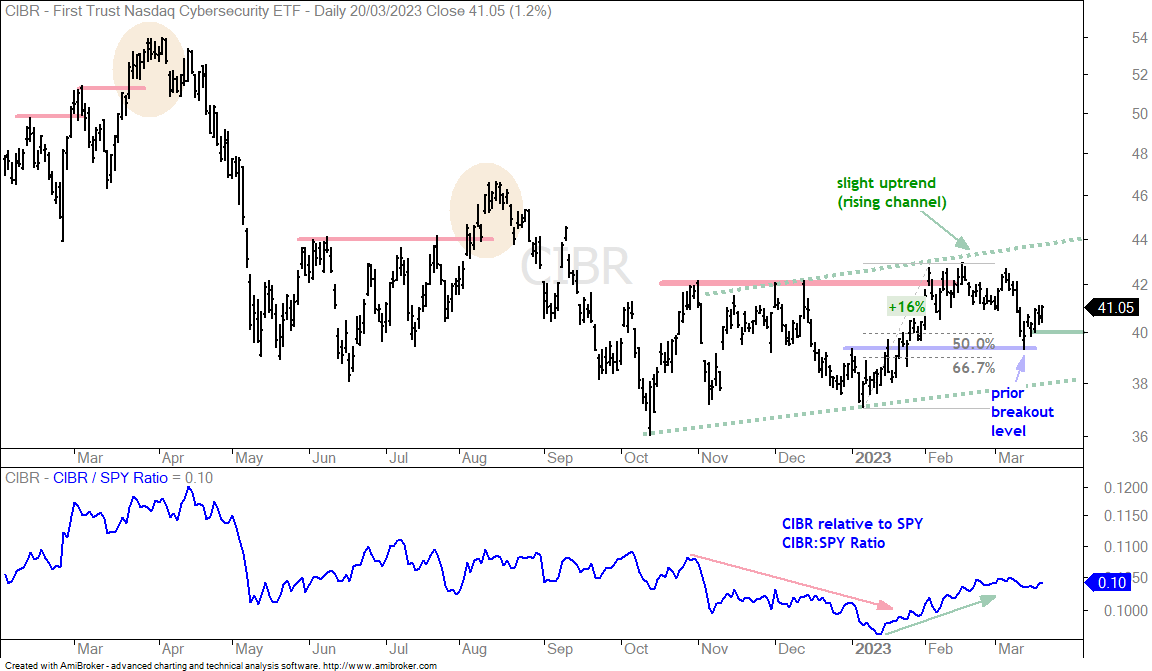
The next chart shows the Cybersecurity ETF (CIBR) with a slight uptrend since October (green dashed lines). CIBR advanced 16% into February, retraced 50-67% with the March decline and bounced off broken resistance (blue line). I do not see a falling flag or wedge, but CIBR was slightly oversold below 40 and is getting a bounce within the rising channel. A close below 40 would argue for a re-evaluation.
Video Games eSports ETF Gets Breakout (ESPO)
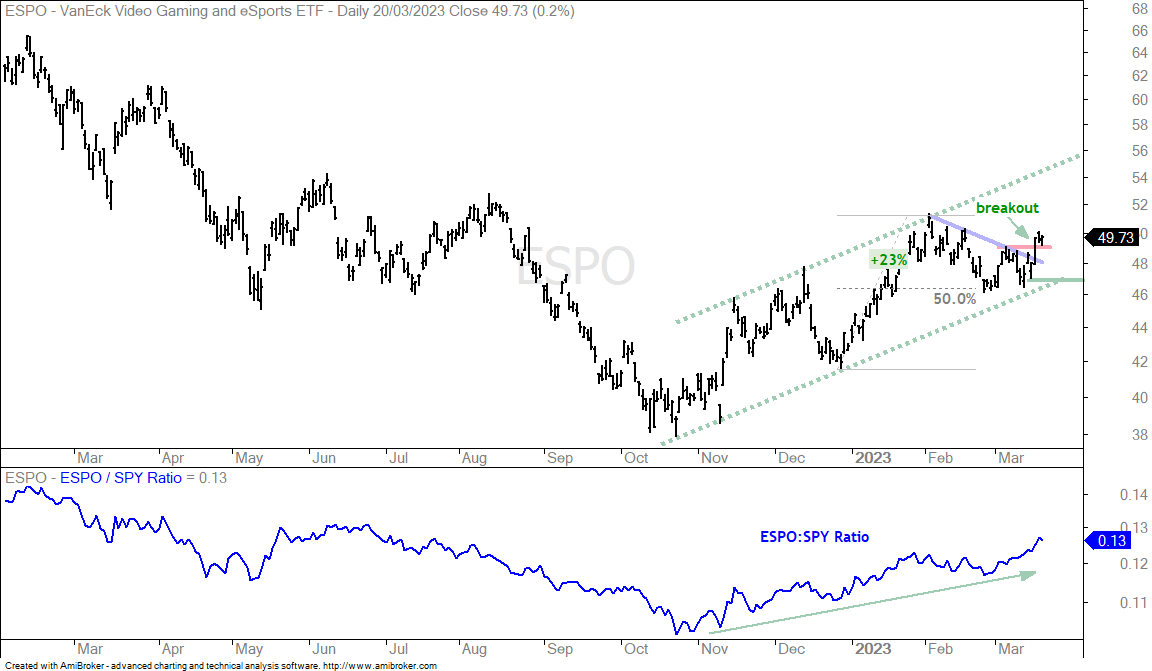
ETFs trading above their early March highs are leading this month. The next chart shows the Video Games eSports ETF (ESPO) with an uptrend working since October and a pullback that retraced 50% of the prior 23% advance. Note that ESPO is part of the high-beta trade, which has been working since October. ESPO broke out with a surge last week and the price-relative shows ESPO leading SPY. I am setting my re-evaluation at 47.
Home Construction ETF Still Correcting (ITB)
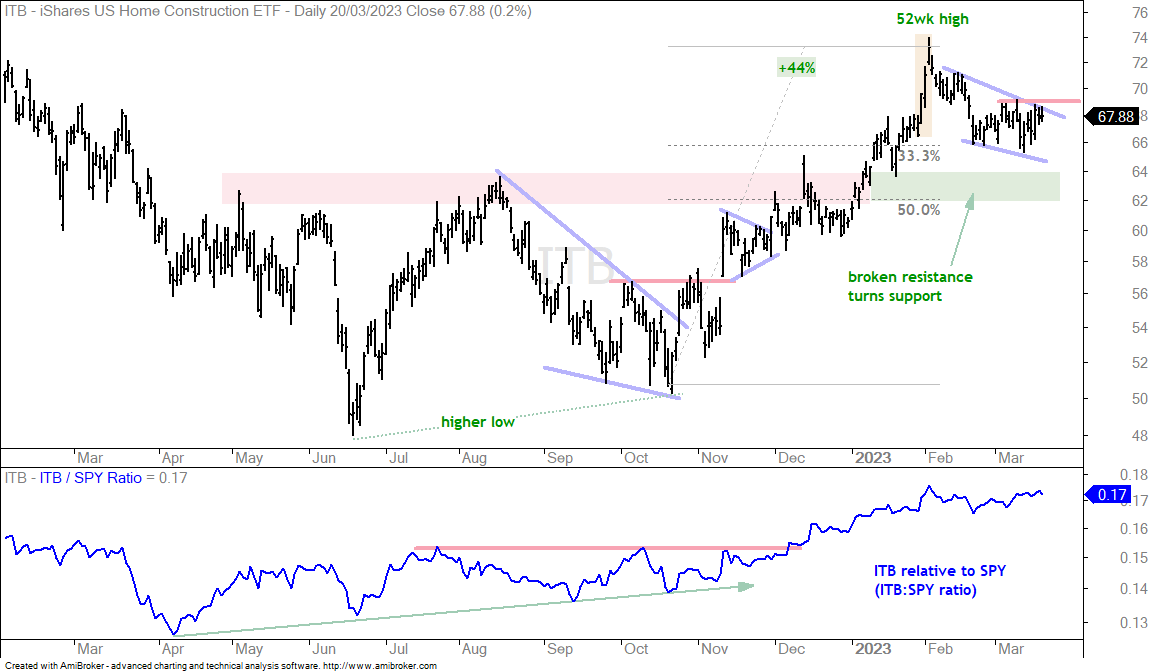
The next chart shows the Home Construction ETF (ITB) in correction (pullback) mode. I am calling this a correction because the bigger trend is still up. A falling wedge is taking shape with the March highs marking resistance. Note that ITB has yet to break the early March high. A breakout at 69 would signal an end to the correction and a resumption of the bigger uptrend. Keep in mind that housing is also a cyclical group and dependent on the economy, as well as credit conditions.
Defense and Water ETFs Test Support (PPA, PHO)
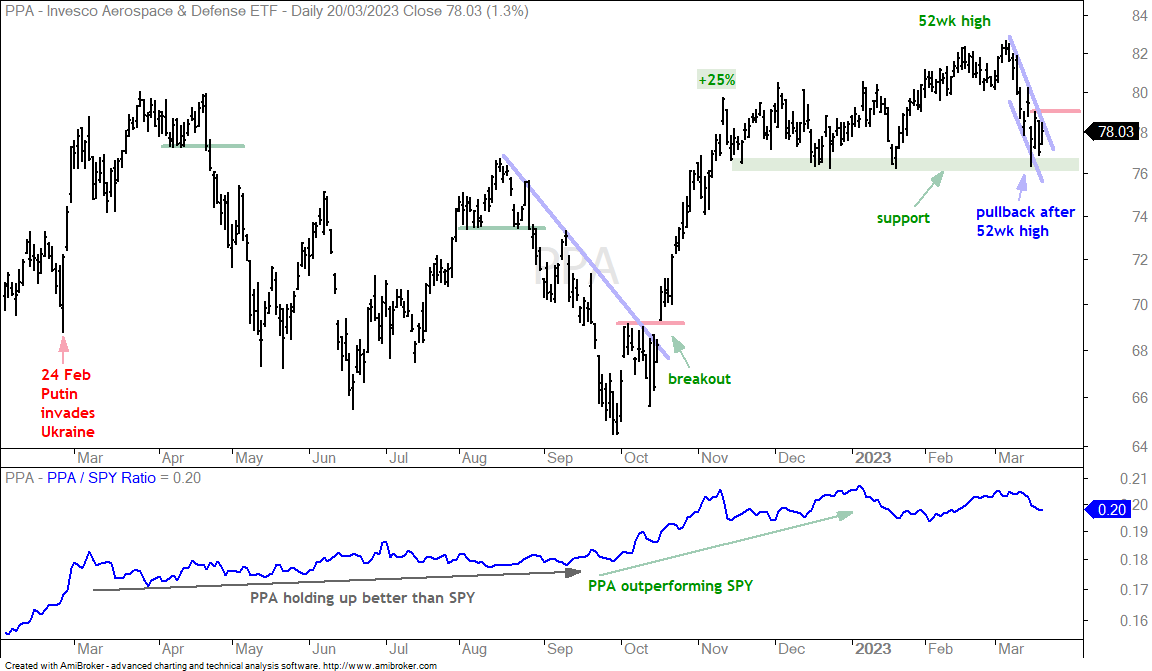
The next chart shows the Aerospace & Defense ETF (PPA) hitting new highs in February-March and then pulling back rather hard the last two weeks. PPA is testing support from the December-January lows and a break here would be bearish. As long as support holds, this is considered a pullback within an uptrend and this puts PPA at a moment of truth. A breakout at 79 would reverse the short-term slide and affirm support in the 76-77 area.
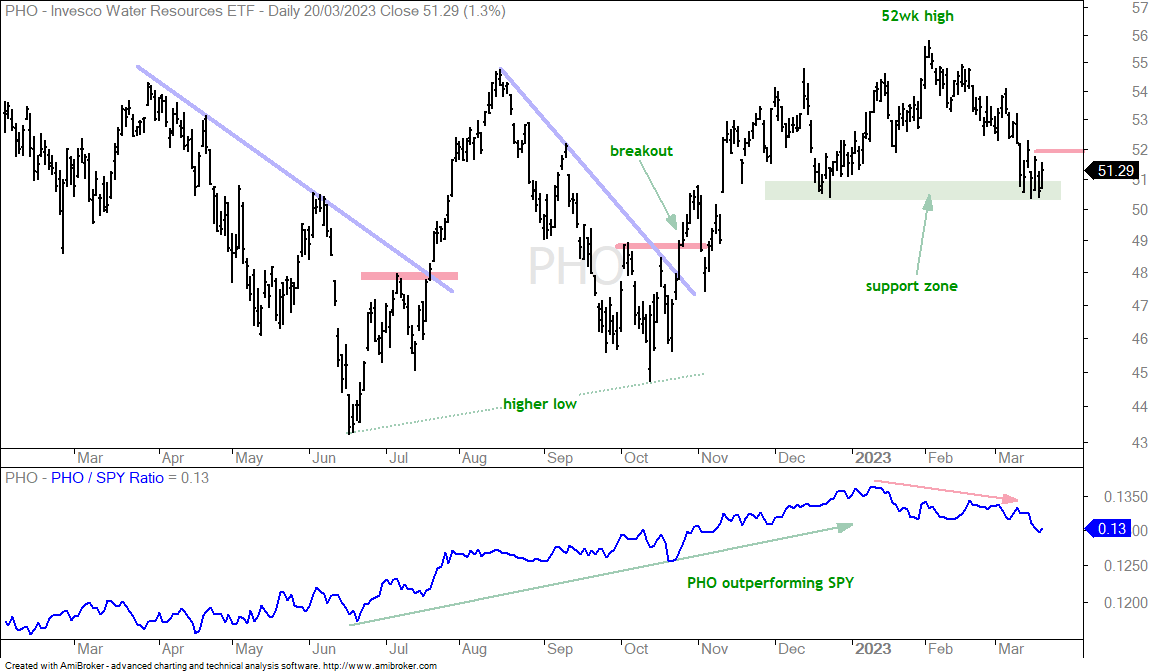
The next chart shows the Water Resources ETF (PHO) with a support test underway as well. PHO was leading in early February with a 52-week high and then fell around 10% into early March. PHO is testing the December lows and attempting to firm. A breakout at 52 would reverse the short-term downtrend.
Utilities Lead Defensive Sectors with a Breakout (XLU, XLP, XLV)
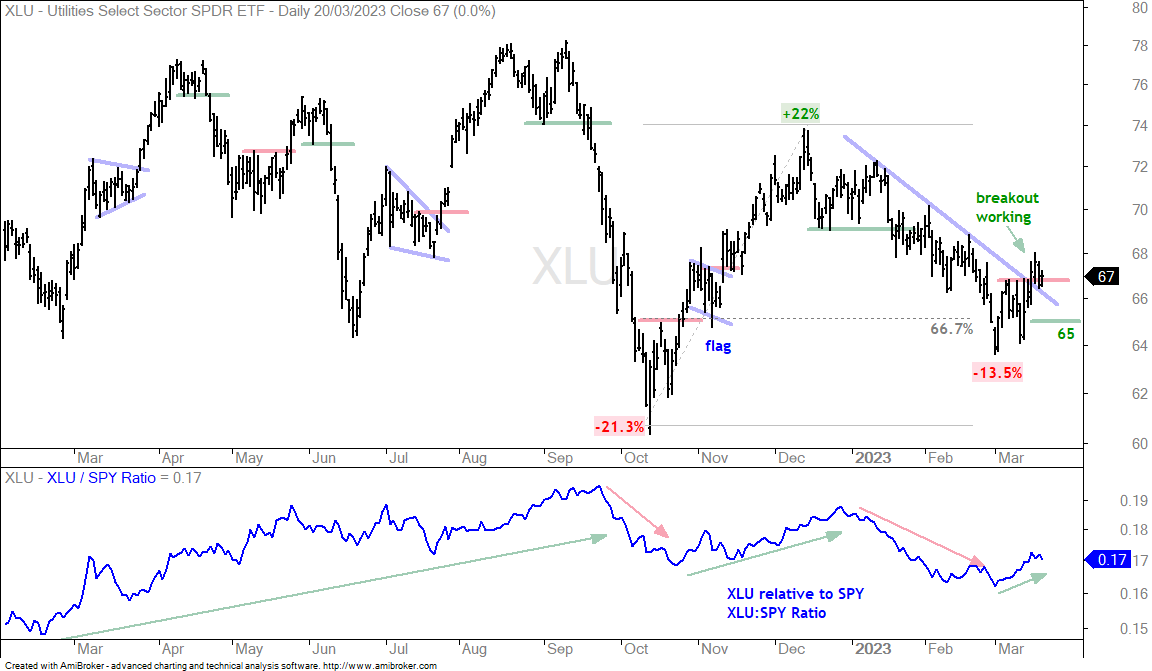
As shown earlier, the defensive sectors are holding up relatively well here in March (Utilities XLU, Consumer Staples XLP, Healthcare XLV). They held up relatively well in 2022 with small losses (<4%) as the S&P 500 SPDR fell 19.5%. They are lagging in 2023 because SPY is up 3% year-to-date and these three are down between 2.4% and 6.54%. I do not see long-term trends on the charts for XLV, XLP and XLU. Instead, they are largely range bound with rather sizable swings, both up and down. The first chart shows XLU with a 22% upswing into December and a 13.5% downswing into early March. XLU is making a bid to reverse the downswing with a breakout working. The green line marks my re-evaluation at 65.
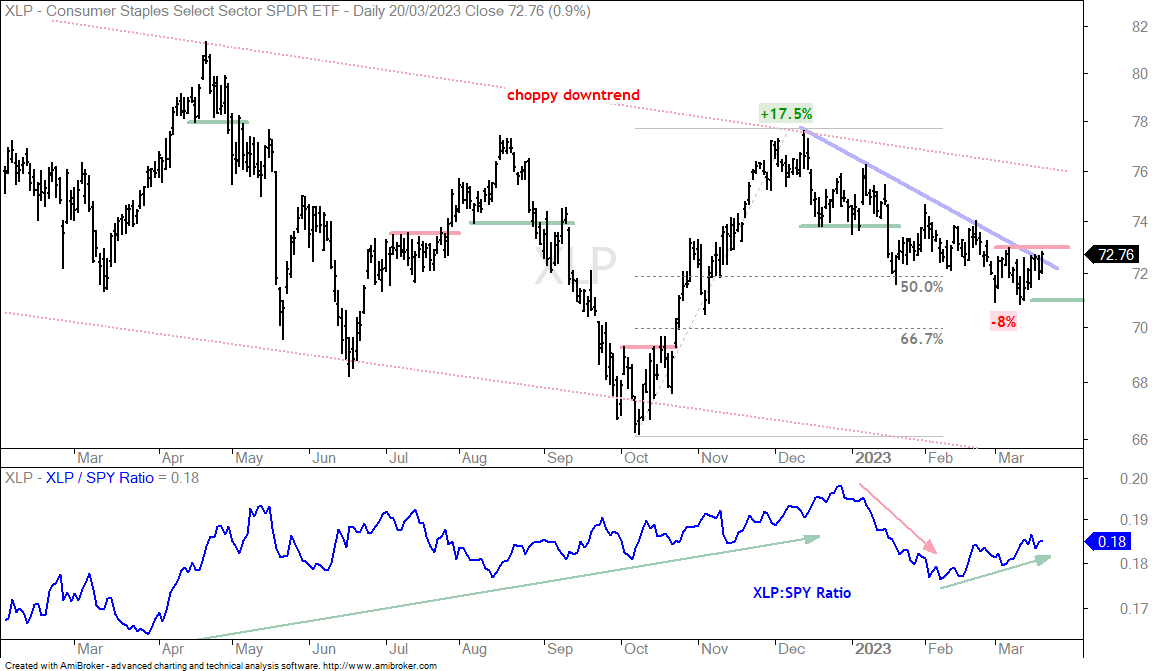
The next chart shows XLP with an 8% downswing that retraced 50-67 percent of the prior upswing (17.5%). XLP firmed the last few weeks and a breakout at 73 would be bullish. I would then set a re-evaluation level at 71.
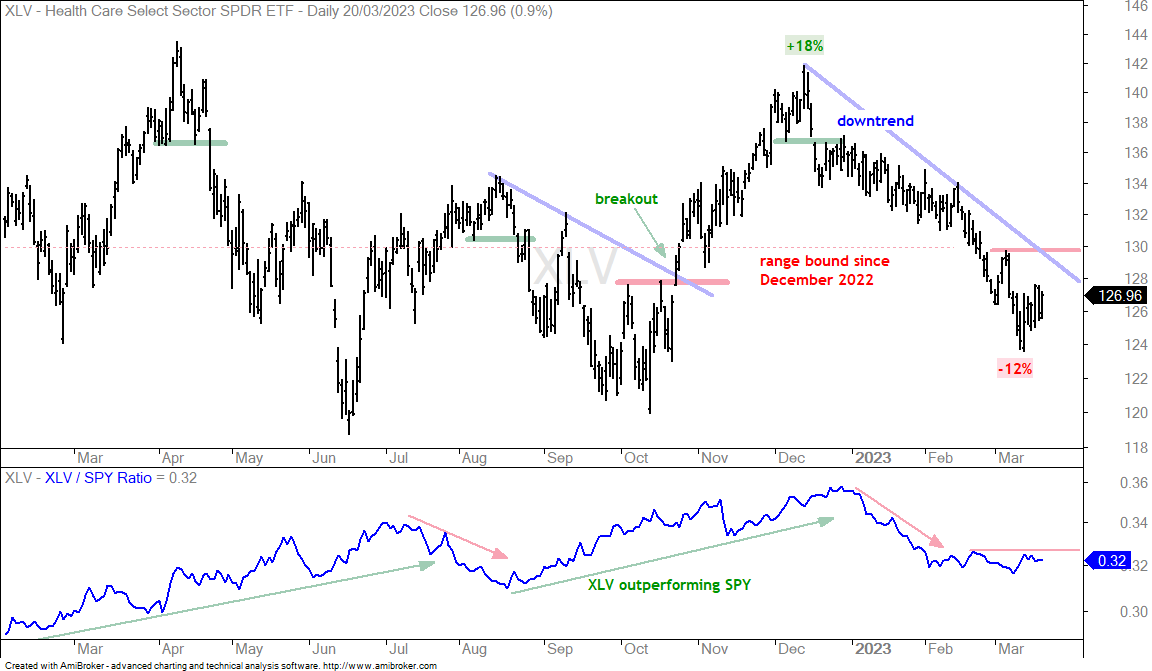
The next chart shows XLV with a 12% downswing since December. XLV has fluctuated between 144 and 118 over the past year and is currently in the lower half of this range. The swing is clearly down with resistance marked at 130. The indicator window shows the XLV:SPY ratio flattening out and a break above the February high would show a return to relative strength.
Biotech ETF Still on the Radar (IBB)
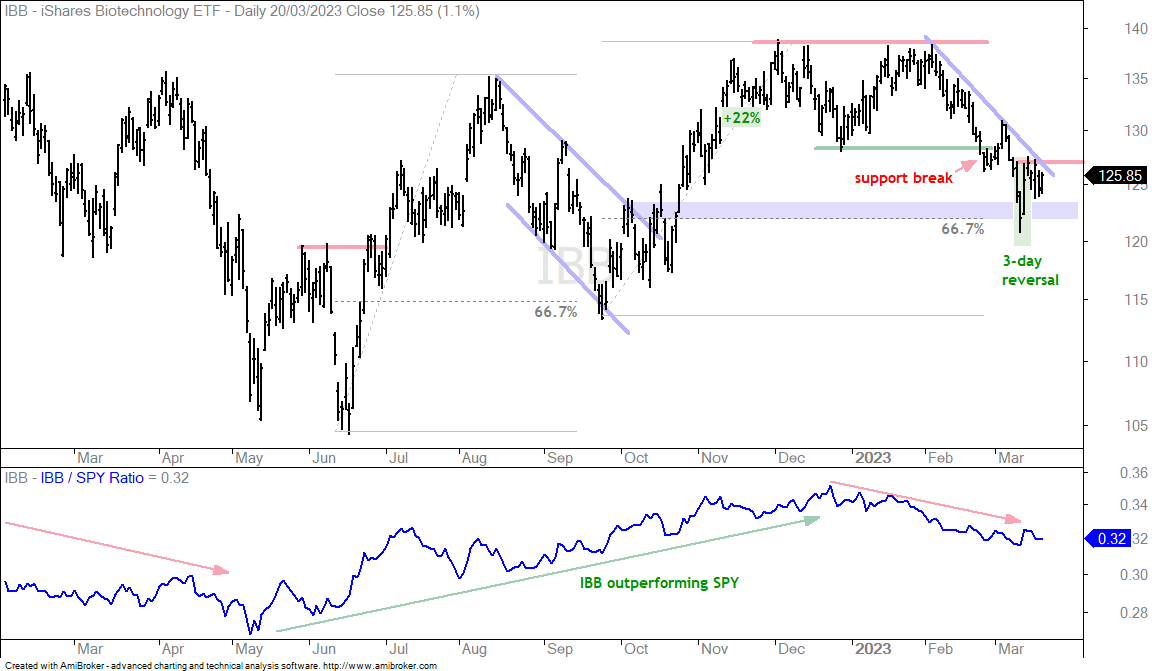
The Biotech ETF (IBB) fell with the rest of the market in February-March and broke support in late February to reverse its uptrend. The trend since early February is clearly down, but this could be a correction after the September-November advance. Notice that this decline returned to the October breakout zone and broken resistance turns into support (blue shading). Second, notice that this decline retraced 67% of the prior advance. IBB forged a 3-day reversal on March 9th, 10th and 13th (green shading). The ETF then stalled for four days. A follow through breakout at 127 would be bullish here and reverse the six week downswing.