Posted By
Arthur Hill, CMT
On
In
Archive |
No Comments
Stocks turned a bit mixed the last two weeks, but the bulk of the evidence remains bullish, both long-term and short-term. Looking at the five biggest equal-weight sectors, we saw new highs in the EW Technology ETF (RYT), EW Industrials ETF (RGI) and EW Healthcare ETF (RYH) this week. Technology led in 2019 and continues to lead in 2020.
The EW Consumer Discretionary ETF (RCD) and EW Finance ETF (RYF) stalled the last few weeks and moved sideways. These are basically short-term consolidations after new highs and bullish continuation patterns. RYF perked up over the last two days and a breakout in Finance would be positive. Such a breakout could carry over into small-caps because the Finance sector is the second largest sector in the Russell 2000 ETF (IWM) and S&P SmallCap 600 SPDR (IJR). Keep an eye on the Regional Bank ETF (KRE) too.
SPY Goes for an Outsized Gain
SPY is up 1.32% for the week and 1.92% above Monday’s open. As you can see, a large white candlestick formed as SPY opened near the low and is currently near the high of the week. This is shaping up as an “outsized” candlestick that looks similar to those seen in January 2018 (red zone). Notice how SPY formed three outsized candles then and the weekly gain exceeded 2% in two of the four weeks. The advance enters the danger stage when we start seeing outsized advances. An outsized advance off a low is a bullish up thrust, while an outsized advance after a 13 week advance is a sign of excess.
Danger and excess are not, however, the same as bearish. As we saw in January 2018, the excess could extend to the end of the month and the PPO(1,40,0) could exceed 10%, which would mean the close is more than 10% above its 40-week EMA. That would be excessive. I am using this version of the PPO to measure excess and the PPO(4,40,0) to measure trend direction. Note that the latter PPO has been positive since February, which means the 4-wk EMA has been above the 40-week EMA. This captures the long-term trend as good as any moving average pair.
Short-term Uptrend Extends Yet Again
The comparison to January 2018 was first noted on December 20th[1] and this scenario continues to play out. In addition, the short-term uptrend remains in place and there cannot be a correction without a short-term reversal of some sort. I continue to monitor the 1-day Rate-of-Change, 2-day Average True Range and %Above 20-day EMA. We have not seen an outsized decline (greater than 1%) since early October, volatility has been largely subdued and %Above 20-day EMA remains well above 50%. An outsized decline would show the first signs of strong selling pressure. Combined with an uptick in volatility (ATR above 30), this would suggest that conditions are changing and the S&P 500 could move into corrective mode. The advance, no matter how extended, could extend even further as long as these three indicators stay bullish.
High-Low Lines Continue to Rise
Note that I originally showed a chart with the 4-week and 26-week High-Low Lines, but found some questionable data points and removed it. This 52-week High-Low Lines from StockCharts are now shown.
In addition to the indicators above, I am also watching the High-Low Lines for the big three: S&P 500, S&P MidCap 400 and S&P SmallCap 600. Two of the three have been rising (above their 10-day EMAs) since early September. The $SML High-Low Line turned up in mid October. All three are currently rising and this supports the immediate uptrend in the indexes. A downturn in two of the three High-Low Line would be negative.
Small-caps are Dragging their Feet
Large-caps and large-techs continue to perform well, but small-caps are down the last two weeks. The declines are modest and I am NOT going to read too much into small-cap weakness. The message here is to favor large-caps and large-techs over small and mid caps. As we saw throughout 2019, the S&P 500 can do just fine when small-caps underperform. Note, however, that the S&P SmallCap 600 SPDR and Russell 2000 ETF were still up over 20% in 2019. Small-caps underperformed because the S&P 500 SPDR and Nasdaq 100 ETF seriously outperformed with gains exceeding 30%.
IWM Forms Bull Flag
Even though small-caps are lagging, the chart for the Russell 2000 ETF (IWM) remains bullish. Long-term, the ETF broke out of a big falling wedge in November and RSI moved out of its bear range (>60). The ETF continued recording 52-week highs in December and then pulled back the last three weeks. There was also a 3-week pullback in November as a bull flag formed. The current pullback also looks like a bull flag (consolidation after an advance). The odds favor a breakout because we are in a bull market overall, IWM is in a long-term uptrend and IWM is in a short-term uptrend.
Index Breadth Model Remains Bullish
There is no change in the Index Breadth Model, which has been net bullish since September 5th. S&P SmallCap 600 High-Low% ($SMLHLP) is the only indicator with an active bearish signal.
Click here for an article and video[2] explaining the indicators, signals and methodology used in the Index Breadth Model. This article also includes the signals of the last five years.
S&P 500 Leads New High List
The chart below shows the High-Low pairs for the S&P 500, S&P MidCap 400 and S&P SmallCap 600. There were 81 new highs in the S&P 500, which means 16.2% of its components hit new highs. This means there are plenty of strong uptrends in the S&P 500 and large-caps are leading. There were just 28 new highs in the S&P SmallCap 600, which is 4.66% of components. As a percentage of the whole, there are fewer strong uptrend in small-caps. The pickings are still better in large-caps. Separately, note that there were 67 new highs in the S&P SmallCap 600 on October 21, but there were also 10 new lows. This means High-Low% was +9.5% ((67 – 10)/600) and did not exceed +10% for a bullish signal.
Sector Breadth Model Remains Bullish
A bearish signal triggered in the Materials sector this week, but the Sector Breadth Model remains firmly bullish. The six biggest sectors drive the S&P 500 and all breadth indicators are on active bullish signals for these six. The trouble starts when we start seeing bearish signals in the big sectors.
A Bearish Signal in XLB, But...
The 10-day EMA of Materials AD Percent ($XLBADP) moved below -30% for a bearish breadth thrust. The Materials sector is the smallest of the 11 sectors so this signal does not weigh much in the grand scheme of things. In addition, the sector is still net bullish because the other two indicators remain on active bullish signals. Also note that this sector has just 28 stocks and the chemical group accounts for 71%. Thus, XLB is really just a play on the big chemical stocks (LIN, APD, ECL, DD, DOW, PPG, LYB).
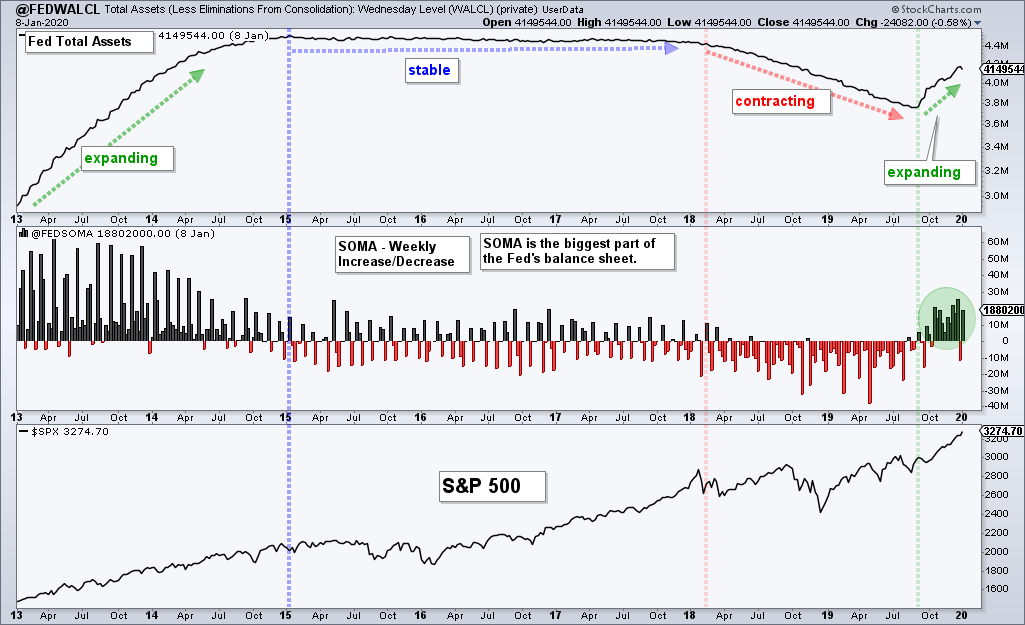
Fed Assets Decrease, but SOMA Increases
It was the opposite of the previous week as Total Assets on the Fed’s balance sheet[3] decreased a little and the System Open Market Account (SOMA)[4] increased substantially. Last week we saw a dip in SOMA and an uptick in total assets. One or two weeks does not make a big difference here because the trend is clearly up when it comes to Fed Assets and SOMA. Both have been increasing since September and this increase was substantial, substantial enough to fuel a big bull run in stocks. The Fed has yet to let up and remains a positive force for stocks right now.
Bottom Line: Bull Market Environment
Stocks got their first short-term test as SPY declined on January 3rd (Friday) and opened weak the following Monday. Iran was all over the news, but Mr Market had other ideas, as is so often the case. Follow the news and you will miss the moves. It is pretty much that simple. SPY moved higher after Monday’s open and hit another new high on Thursday.
As noted in the charts above, we have yet to see signs of true excess in the S&P 500 SPDR. Sure, SPY is up around 14% since early October and the advance seems overbought. However, keep in mind that RSI(14) has crossed above 70 five times since early November (November 7, 12 and 25, December 16 and January). The cross above 70 on December 16th lasted 12 days.
At this stage, we still have long-term and short-term uptrends in the S&P 500 SPDR. The Fed is accommodative and I have yet to see signs of serious excess. With 2018 as a model, this advance may have further room to run before getting exhausted. I will take it day-by-day and week-by-week. Simply monitor the charts and take the signals when they come.