There are Black Swan events and then there are BLACK SWAN events. The current decline, 12% in six days, ranks as one of the sharpest on record. Not counting 1929, the sharpest decline on record is the crash in October 1987, when the S&P 500 fell some 28% in 4 days. I went through the S&P 500 and marked some prior declines that were sharp and started close to new highs.
The first eight occurred from 2010 until now. Note that the S&P 500 is up 164% from January 2010 to February 2020 (sans dividends). During this timeframe, the index experienced at least eight gut-wrenching declines from new highs or within 2% of a new high. The percentage number at the end shows the average daily decline for each move.
February 2020: hit new high 19-Feb and fell ~12% in 6 days (-2%)
October 2018: within 1% of high on 3-Oct and fell ~8% in 6 days (-1.33%)
January 2018: hit a new high on 26-Jan and fell ~12% in 10 days (-1.2%)
August 2015: within 2% of high on 17-Aug and fell ~11% in 6 days (-1.83%)
September 2014: hit new high on 19-Sept and fell ~9% in 18 days (-.50%)
January 2014: within 1% of high on 22-Jan and fell ~6% in 6 days (-1%)
July 2011: within 2% of high on 21-Jul and fell ~17% in 12 days (-1.42%)
April 2010: hit new high on 23-Apr and fell ~10% in 10 days (-1%)
October 2007: hit new high on 11-Oct and fell ~10% in 31 days (-.32%)
July 2007: hit new high on 19-Jul and fell ~10% in 20 days (-.50%)
February 2007: hit new high on 20-Feb and fell ~6% in 10 days (-.60%)
May 2006: hit new high on 9-May and fell ~8% in 25 days (-.32%)
The chart below shows the S&P 500 with the red lines marking 5 and 10 day declines greater than 10%.

Short and sharp declines are not as rare as one might think. Note that some of the declines extended 20 days or more with an average daily move that was -.50% or less. These are the “typical” corrections that mark relatively orderly declines that extend a little longer. They often form falling wedges or channels.
SPY is Ripe for an Oversold Bounce
We do not need any indicators to suggest that the market is oversold and ripe for a bounce. Nevertheless, I ran a backtest on the S&P 500 just to test some setups. Buy when SPY declines eight to ten percent within a five to twenty day period and RSI(14) is below 30. Note that this is still the falling knife stage because RSI has not yet turned up. The sell signal is when RSI(14) moves above 50. This is not a trade for a home run, but rather a base-hit attempt after an oversold extreme.

The table below summarizes the results when the five to twenty day Rate-of-Change exceeds -8%, -10% and -12%. Using ROC below -10% as an example, there were 16 trades since 1990 with 13 winners and 3 losers. It is a small sample size, but the win rate is 81%. Note that this system did not differentiate between bull and bear markets. The average gain was 4.22% and the average loss was 2.16%.

The 5-day ROC hit -7.93% on Wednesday and did not trigger. The 6-day ROC hit -12.07% on Thursday so all three versions triggered. In addition, RSI(14) is below 30. The setup is here and the sell signal would be when RSI(14) moves above 50. The table below shows the trades when using ROC below -10%. The backtest was run using Amibroker software.

Index Breadth Model Turns Red, all Red
The Index Breadth Model started taking hits on Tuesday with the 10-day EMAs of Advance-Decline Percent triggering bearish with moves below -10%. These are bearish breadth thrusts and these are usually the first signals in the breadth model. They were the first to trigger bullish in January 2019. The High-Low Percent and %Above 200-day SMA indicators triggered for the S&P SmallCap 600 on Tuesday as well. These indicators then triggered bearish for the S&P MidCap 400 on Wednesday and the S&P 500 on Thursday. It was a cascade from small-caps to mid-caps to large-caps. All nine indicators are now bearish and this means the model is in bear market mode.

Bearish Breadth Thrusts
The chart below shows the 10-day EMAs of Advance-Decline Percent for the S&P 500, S&P MidCap 400 and S&P SmallCap 600. There have been lots of individual signals since January 2018, but there have been just three majority signals where at least 2 of the 3 indicators trigger. These occurred in February 2018 (bearish), January 2019 (bullish) and February 2020 (bearish). That’s one per year. Note that I did not include the September 2019 majority signal because the indicator group was already majority bullish at the time. I will be watching this indicator group for the first signs that the stock market is shifting back to bull mode.

Click here for an article and video [1] explaining the indicators, signals and methodology used in the Index Breadth Model. This article also includes the signals of the last five years.

Tech Sectors Holds Out - For Now
The chart below shows the Technology SPDR (XLK) with the three breadth indicators: 10-day EMA of XLK AD Percent ($XLKADP), XLK High-Low% ($XLKHLP) and XLK %Above 200-day EMA (!GT200XLK). Note that you can chart these indicators for the other sectors by changing the sector symbol. Technology triggered net bullish on February 1st, 2019 when two of the three indicators turned bullish. The 10-day EMA of Advance-Decline Percent triggered several more signals over the past year, but the other two indicators stayed bullish. This is why Technology stayed net bullish the entire year. This is about to change because there was a bearish breadth thrust on Tuesday and the other two indicators are perilously close to triggering. A move below -10% in High-Low Percent and 40% in %Above 200-day EMA would complete the bearish hat-trick.

Fed Asset Expansion Slows
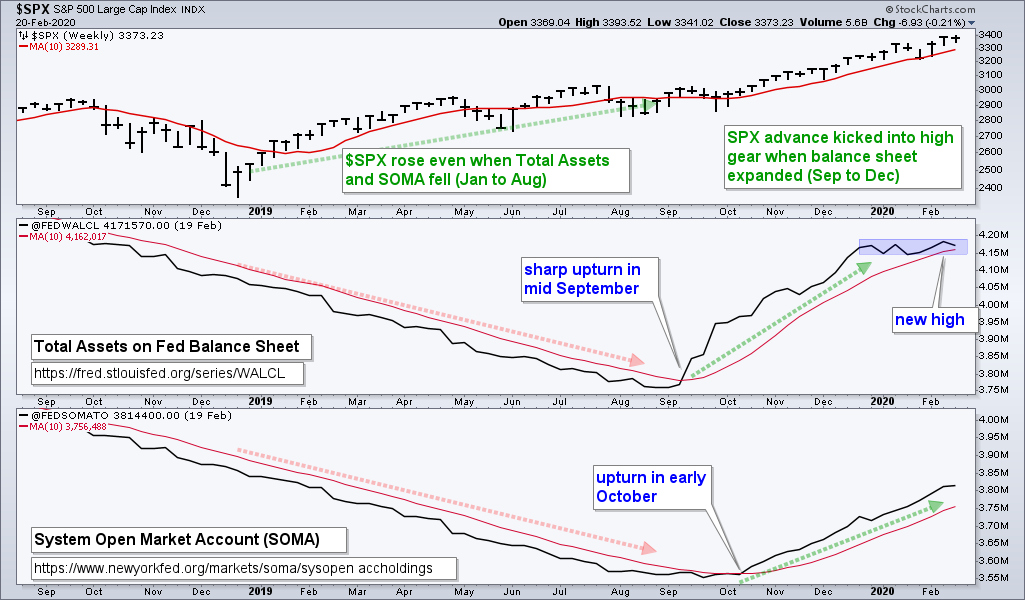
Total Assets on the Fed’s balance sheet ticked lower for the second week in a row. After expanding sharply from mid September to late December, growth flattened over the last eight weeks. The System Open Market Account (SOMA), however, continued to rise and hit a new high for the move this past week. Overall, the Fed remains accommodative, but less so here in 2020.
The Fed is most certainly watching the stock market and the spread of the Coronavirus, as are the other central banks around the world. Yes, the famous PPT may take action soon with some sort of joint communique. Plunge Protection Team refers to the Working Group on Financial Markets, which was created in the aftermath of the 1987 crash. The PPT allegedly intervened in the markets in early February 2018 and held a teleconference on December 24th, 2018, after the market tanked. Links: Fed Balance Sheet [2] and System Open Market Account (SOMA). [3]
If history is any guide, I would expect the PPT and the central bankers of the G-whatever to attempt something. Such actions may work in the short-term and provide a bounce. There was a bounce in the second half of February 2018 and then a test of the lows in early April. There was a massive bounce the last week of December 2018 and this carried until late April. Stick to the chart! I will wait and see if any bounce is strong enough reverse the bearish signals seen this week.
Bottom Line: Bear Market and Extremely Oversold
A signal is a signal and the breadth tables have signaled a bear market environment. The S&P 500 is below the 200-day SMA, but this is often a big battle ground with lots of whipsaw signals. The 20-day SMAs are also above the 200-day SMAs for SPY, IWM and MDY. Thus, price has yet to confirm what we are seeing on the breadth tables. Note that the SPY moving average cross lagged the bullish breadth signal on February 5th by a month as the 20-day SMA did not move above the 200-day SMA until March 1st, 2019.
Even though the breadth tables signal a bear market environment, this does not preclude counter-trend bounces and general chaos. The stage is currently set for a counter-trend bounce, but risk remains above average with the change in the breadth models. Bear market bounces can be just a sharp as bear market swoons. As long as the breadth models remain bearish, I will look to fade rallies and avoid long positions.