The S&P 500 SPDR (SPY) was never in trouble this year and the Russell 2000 ETF (IWM) was never up less than 8% year-to-date. Small-caps surged out of the gate with IWM gaining around 17% the first two months of the year. This amalgamation of 2000 stocks then embarked on a long consolidation with a slight downward bias the next six months. Even at its lowest close (August 27th), lowly IWM was still up over 8% for the year. Not bad for eight months work.
The chart below shows IWM with the January-February surge and extended decline, which could be a corrective move after the big advance. Think two steps forward and one step backward. A big falling channel or wedge formed and IWM exceeded the September high here in November. Even though we do not see a clean and convincing breakout that would wipe out the wall of worry, the higher high is there and this is how uptrends start. Even a pullback back into the range would not be that negative (failed breakout) because a pullback after a 10% surge is pretty normal.

The indicator window shows RSI moving from bull range to bear range in early October 2018. The bull range is typically from 40 to 80, and the bear range is from 20 to 60. RSI has been locked in this bear range all year because momentum never really took off. An uptick in momentum could be the next step. A break above 60 would put RSI in its bull range and at its highest level since late September. This would also provide further evidence that the bull market is indeed broadening.
Small-caps underperformed large-caps during the six month midyear stretch because SPY continued higher from March to August and hit new highs in October-November. Relative weakness in small-caps did not derail the S&P 500 and we now have the possibility of a breakout in small-caps. Note that the S&P MidCap 400 SPDR (MDY) already hit a 52-week high.
Now let’s look at SPY, which serves as my main barometer for the stock market. SPY surged to a new high in April, but did not hold this “breakout”. Big deal. It was not really a breakout and a pullback after a 20+ percent surge is perfectly normal. The April high was, in fact, a 52-week high, and 52-week highs are bullish. SPY went on to record new highs in June and July, and then embark on a consolidation, which is also normal. Yes, these advance-correct and advance-consolidate sequences are normal for uptrends.

Most recently, SPY broke out of a thirteen week consolidation (Ascending Triangle) and this signals a “continuation” of the long-term uptrend. This is not a breakout that starts the long-term uptrend, but rather the breakout that continues the long-term uptrend. SPY is also above its rising 40-week SMA and the PPO(4,40,0) is firmly positive.
We are in a bull market. Trade accordingly. Speaking in probabilities, expect more bullish resolutions than bearish resolutions, look for bullish setups, ignore bearish setups and stay on the right side of the trend.
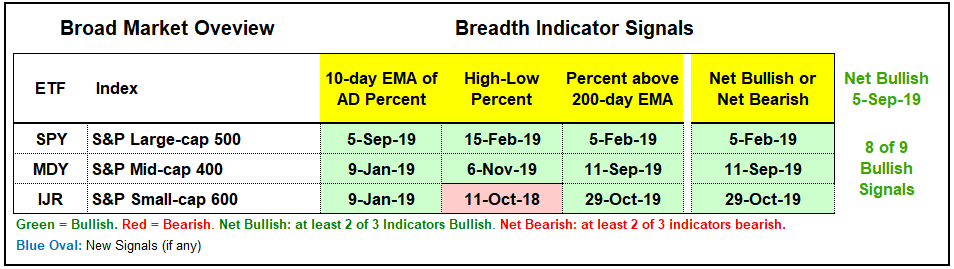
Index Breadth Model Remains Bullish
There is no change in the Index Breadth Model, which remains firmly bullish. Eight of the nine indicators are on active bullish signals. S&P 600 SmallCap High-Low% ($SMLHLP) is the only indicator with an active bearish signal (since October 2018!). A move above +10% is needed to reverse this signal. The S&P 500 has been net bullish since early February and the model as a whole has been net bullish since early September. Large-caps are leading overall, but the bull market in stocks started broadening in early September and the weight of the evidence is clearly bullish.
The lack of new highs has been an issue for some time now and is just part of the wall of worry narrative. I have a news flash! There is ALWAYS something to be worried about and there is ALWAYS something that gives us cause for concern. Our job, as technical analysts, is to filter the noise and weight the evidence. Turn off the TV’s and talking heads, and tune into the evidence. New highs are not what they were in 2017 and 2018, but the high-low indicators are still more bullish than bearish.
Small-Cap New Highs Expand
The number of stock making new highs has been a lagging link in the breadth indicators this year. While the S&P 500 trades at a new high, the number of new highs within the index has yet to exceed 100 and get back to the levels seen in June. The number of new high in the S&P Small-cap 600 and S&P MidCap 400 is also inspiring and well below the levels seen in 2017 and 2018. This may be changing as new highs expanded in the small-cap universe over the last few weeks.
The first chart shows the High-Low pairs for the S&P 500, S&P 400 MidCap Index and S&P 600 SmallCap Index with lines at the 10% levels (e.g. plus/minus 50 for $SPX, plus/minus 40 for $MID and plus/minus 60 for $SML). First, notice that new lows in the S&P 500 have not exceeded 50 (-50) since December and new highs have exceeded 50 numerous times this year. Second, notice that new lows expanded in May and August and exceeded 40 for $MID and 60 for $SML. Large-caps held up better in May and August.

What about the right side of the chart, which is the most important side? New highs in small-caps and mid-caps increased over the last four weeks and this indicates a broadening of the bull market. The green shading on the chart above shows a steady stream of new highs since mid October. The chart below quantifies this by showing the 20-day SMAs of new highs for each index. The 20-day SMAs of Mid-cap New Highs (!NEWHIMID) and Small-cap New Highs (!NEWHISML) hit their highest levels of the year this week. New highs are the strongest of the year and this is positive for mid-caps and small-caps.

Index High-Low Lines Rising
There is no change in the Sector Breadth Model: ten of eleven sectors are net bullish and 31 of 33 indicators are on active bullish signals. The Energy sector is the only sector that is net bearish with two of the three indicators on active bearish signals. Two of the top six sectors have been net bullish since early February (Technology and Healthcare). Five of the top six sectors have been net bullish since early September (add, Finance, Consumer Discretionary and Industrials). Communication Services, which is also part of the big six, has only 23 stocks and this causes more whipsaws in the breadth indicators. It has been net bullish since October 22nd.

The number of new highs within small and mid caps is still below the levels seen in 2017 and early 2018, but this is a good start.
Sector Breadth Model Stays Strong
As with any trend-following indicator, the High-Low Lines lag a bit and often turn after the index has turned. The turns in the High-Low Line will not foreshadow a turn in the index, but they can catch some pretty good moves and filter out noise. The S&P 500 High-Low Line turned up in mid August and the S&P 400 MidCap High-Low Line turned up on September 4th. These turns caught a nice two month advance the S&P 500 and S&P 400 MidCap Index. The S&P 600 SmallCap High-Low Line joined the party in mid October. The immediate trend is up as long as two of the three hold above their 10-day EMAs.

Key Sector High-Low Lines Rising
The next chart shows the High-Low Lines for the big six. All six High-Low Lines are rising and above their 20-day EMAs. The green text on the right shows just how long these High-Low Lines have been rising. The Technology, Finance and Industrials High-Low Lines have been rising since February. The Consumer Discretionary High-Low Line turned up in early September, while the Healthcare High-Low Line turned up on October 11th. The Communication Service High-Low Line was the last to turn up on October 25th. The bulls are clearly in control here. The trouble starts when 3 or more High-Low Lines turn down and break their 20-day EMAs.

Fed Balance Sheet Continues to Expand
Total assets on the Fed balance sheet [1] and the System Open Market Account (SOMA) [2] expanded again this week. The chart below shows Total Assets turning up in early September and rising sharply over the last 10 weeks. This is hockey stick sharp. The middle window shows SOMA increasing seven of the last ten weeks. Notice that the increases over the last four weeks were especially large. Technical analysts are not in the business of understanding why, even though narratives are interesting to ponder. It is what it is: more bullish for stocks than bearish.

In a separate, but related note, Charlie Bilello (@charliebilello) noted on twitter that all major central banks are easing right now. One can wonder why the Fed and these central banks are easing, but it does not seem like a good idea to fight the central banks. Below is Charlie’s list:
Fed: easing
ECB: easing
BOE: easing
BOJ: easing
Denmark: easing
Australia: easing
Brazil: easing
Russia: easing
China: easing
Korea: easing
Indonesia: easing
South Africa: easing
Turkey: easing
Mexico: easing
Chile: easing
Philippines: easing
Thailand: easing
Bottom Line: Bull Market Environment
The weight of the evidence is clearly bullish for stocks. The index and sector breadth models are firmly bullish, the High-Low Line lines for the main indexes and sectors are rising, the offensive sectors are leading and the Fed is accommodating. We are also seeing a shift back to momentum with the S&P 500 Momentum ETF (MTUM) up 5% the last six weeks and the S&P 500 Minimum Volatility ETF (USMV) up just 2%.
The breakout in the S&P 500 is relatively fresh, a mere three weeks old. Mid-caps and small-caps joined the breakout parade with higher highs in November. These are the first higher highs in IWM and MDY since early May. Don’t worry about a failed breakout if stocks pullback over the next 1-2 weeks. IWM and MDY surged seven to nine percent in October and they are entitled to a rest or pullback. Pullbacks in bull markets are opportunities, not threats.