Growth and High-Beta Start to Lead – Brazil and Emerging Markets Break Out (Subscribers)
Posted By
Arthur Hill, CMT
On
In
Archive |
No Comments
It has been a wild ride for the Russell 2000 Growth ETF (IWO) and Nasdaq 100 Next Gen ETF (QQQJ) over the last two weeks as they went from emerging leaders to overreaction laggards and back to leading. The lagging part occurred last Tuesday when stocks fell sharply during the day. This whipsaw action is looking more like short-term noise because these two are leading again with strong recoveries.
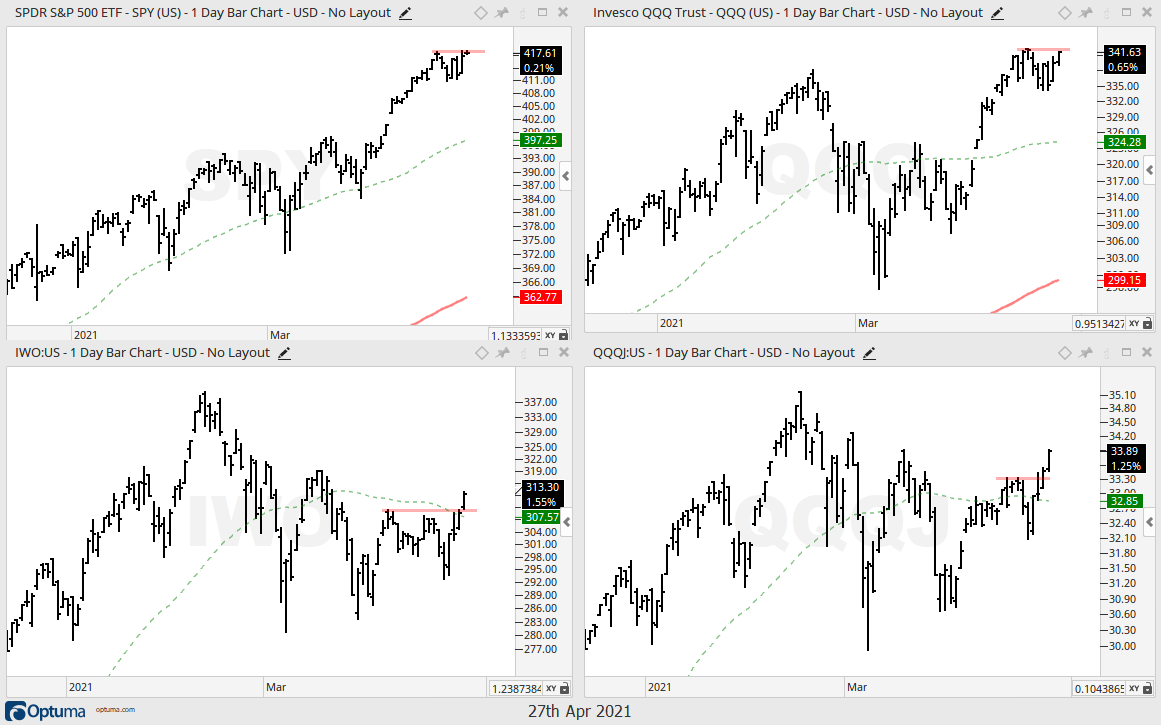
Benchmark Highs
I highlighted renewed relative strength in IWO and QQQJ in the weekend video near the 33 minute mark. Basically, the mid April highs were considered benchmark highs that we can use to compare chart performance. ETFs that exceeded these highs are leading those that did not exceed these highs. For example, IWO and QQQJ exceeded these highs, but IWM and QQQ did not. This provided a short-term sign that growth (IWO) and high beta (QQQJ) were outperforming.
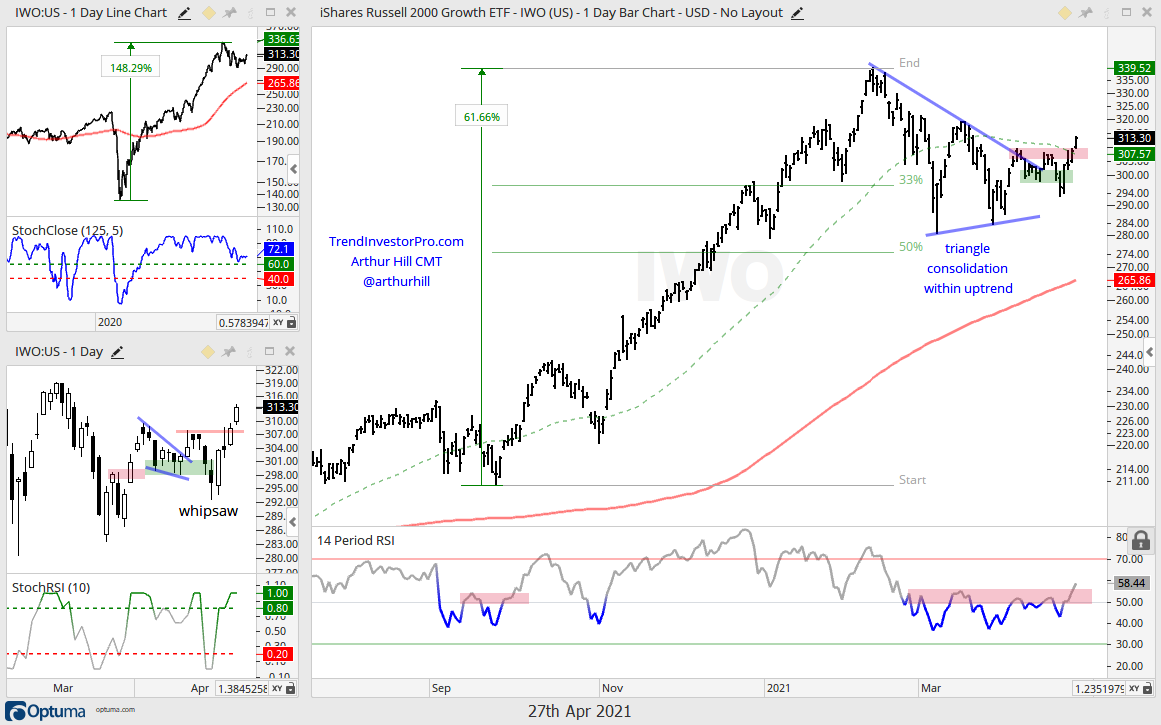
IWO and QQQJ Breakouts
The next chart shows IWO with a 60% advance to new highs and a triangle consolidation from mid February to April (bar chart). The ETF retraced around 50% of the prior advance at the early March low. Overall, the triangle represents a rest within the bigger uptrend or a bullish continuation pattern. IWO showed signs of breaking out in mid April, but fell back last week. The breakout is back on track with a surge above the 50-day SMA over the last few days. Also notice that RSI broke above its March highs.
The lower left window shows candlesticks with a pennant breakout, failure and snap back surge (whipsaw). In hindsight, which is 20/20, perhaps I was getting a little too short-term by drawing a six day pennant. In any case, I would like to point out a stop-loss technique that was covered in the article on exit strategies[1] (see the SOXX example around half way down). I use closing prices to trigger stops and then exit the next day. Instead of selling on the open, however, I like to place a stop just below the low of the day the stop triggered. This technique would have avoided the whipsaw in IWO, but not in KRE. Can’t win them all.
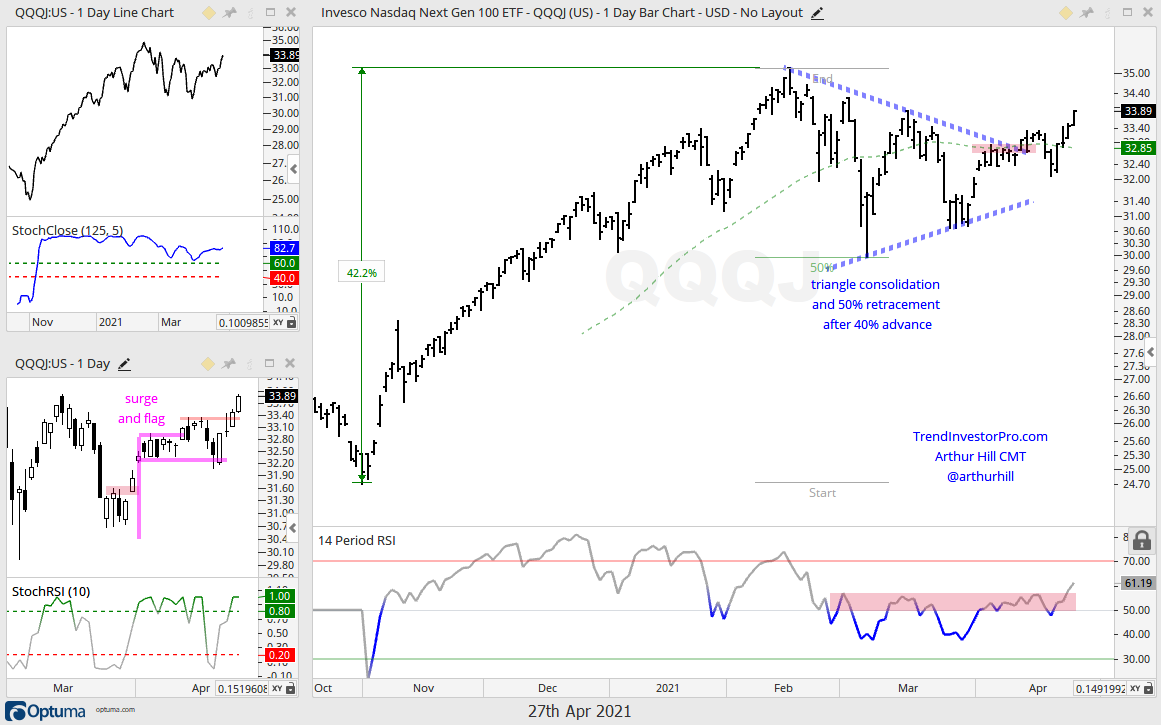
The next chart shows QQQJ with similar characteristics.
Korea, Brazil and Emerging Markets
I highlighted potential breakouts in the China Large-Cap ETF (FXI) and China A-Shares 300 ETF (ASHR) in the weekend video, but these breakouts are still looking shaky. It is worth noting that the Taiwan ETF (EWT) is much stronger and hit new highs throughout April. Taiwan also has a more transparent market.
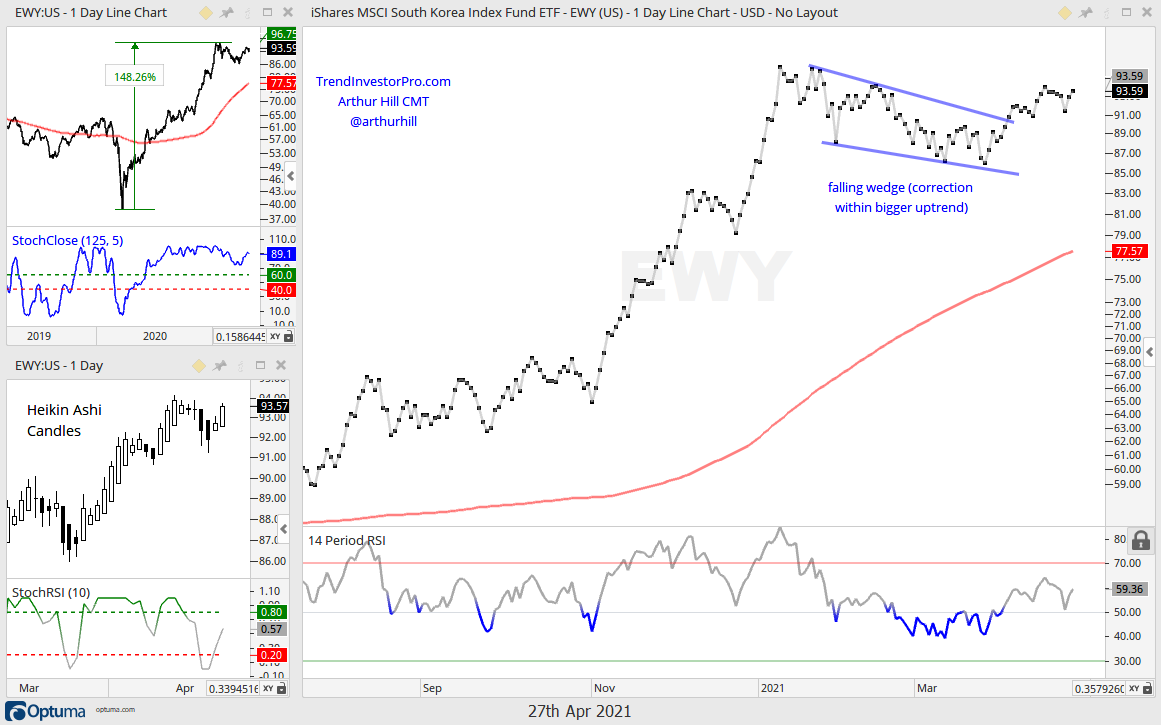
Elsewhere, note that the South Korea ETF (EWY), Brazil ETF (EWZ) and Core Emerging Markets ETF (IEMG) are stronger. The first chart shows EWY with a falling wedge and a breakout in early April. The breakout signals a continuation higher and targets a move to new highs in the coming weeks/months. Note that I am using a line-dot chart and Heikin-Ashi Candles because bars and normal candlesticks show too many gaps. This is because opening prices are reacting to trading that already took place in Asia.
The next chart shows IEMG with a falling wedge correction that retraced just over a third of the prior advance. IEMG broke the wedge line in early April and moved above the 50-day SMA on Friday. The candlestick chart shows a pennant breakout.
The next chart shows EWZ with a deeper correction that retraced 2/3 of the prior advance. Despite the deep correction, the retracement amount and return to the 200-day are still normal for corrections within bigger uptrends. EWZ broke out in early-mid April and is showing short-term leadership.