Follow Through with Strong Breadth, Yield Spreads Remain Narrow, Bonds Get a Bounce (Premium)
Posted By
Arthur Hill, CMT
On
In
Archive |
No Comments
Follow Through with Strong Breadth
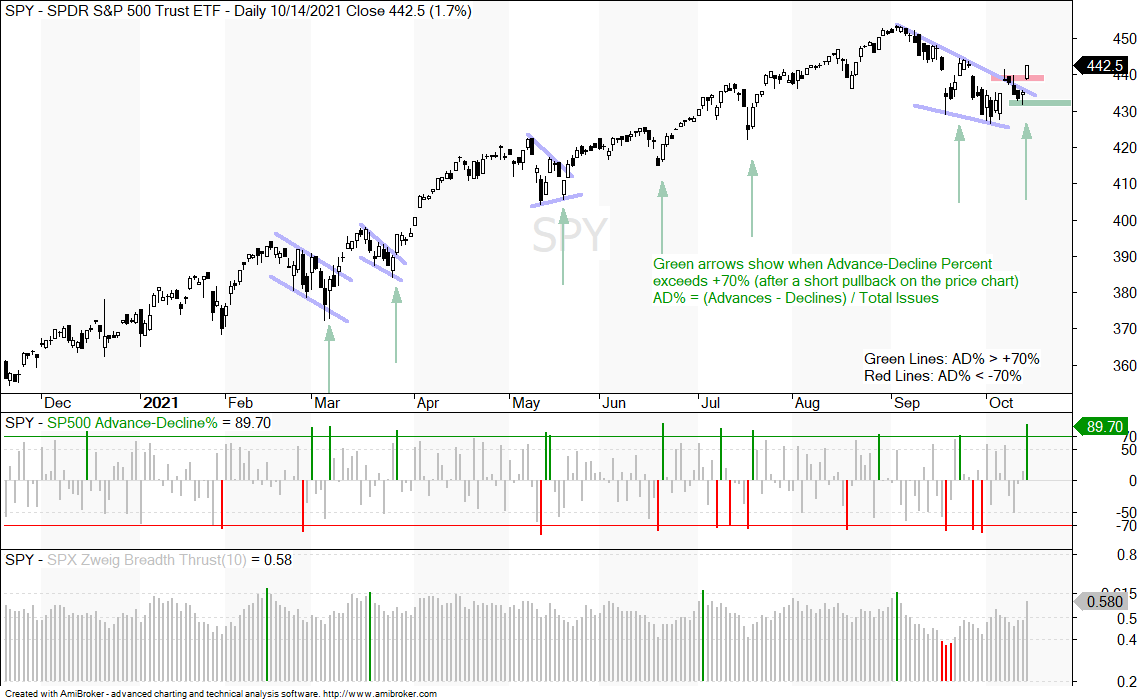
The S&P 500 SPDR (SPY) followed through on last week’s gap with a gap-surge on Thursday. In contrast to last week’s gap, SPY moved higher after the strong open on Thursday and formed a long white candlestick. The open is near the low end of the range and the close was near the high. This means we saw buying pressure extend after the open and remain into the close. Breadth was also exceptionally strong. The first indicator window shows Advance-Decline Percent surging to 89.70%, a level that shows broad participation. For reference, +80% means 90% of S&P 500 stocks advanced. 450 advancers less 50 decliners equals +400 net advances and +450/500 = .80 or +80%.
What now? The breakout, follow through and breadth surge suggest that the correction has ended and the bigger uptrend is resuming. Such a strong breakout should hold so I would base support on this week’s close. A close below 431 would show cold feet and warrant a re-evaluation. The bottom window shows the Zweig Breadth Thrust surging to .58 and a move above .615 is needed for a bullish thrust signal.
StockCharts Breadth Charts
The next two chart reiterates the Amibroker chart above showing Advance-Decline Percent for the S&P 500.
The second shows Advance-Decline Percent for the S&P 500, S&P MidCap 400, S&P SmallCap 600 and Nasdaq 100. Small-caps lagged as Advance-Decline Percent hit 67.7% and failed to clear the 80% threshold. I would not worry too much about this because AD Percent for the S&P MidCap 400 exceeded 80% and AD Percent for the Nasdaq 100 finished at 80%. All told, three of the four indexes showed broad upside participation on Thursday and this is bullish.
%Above 100-day SMA Breakout
The percentage of S&P 500 stocks above SMA indicators popped on Thursday with the percentage above the 100-day SMA exceeding its September high. These indicators fell from mid April to mid September and then popped on September 22nd and 23rd (blue shading on price line). The indicators fell back into early October and popped again this week. We have yet to see breakouts in the percentage of SPX stocks above their 200-day and 150-day, but the bottom window shows the percentage above the 100-day with a higher high (breakout).
Other Notes
The Composite Breadth Model (CBM) remains bullish and has been bullish since May 2020 (see Market Regime page[1] for charts covering the CBM, yield spreads and Fed balance sheet).
Investment grade and junk grade corporate bond spreads edged up the last three weeks, but remain at low levels overall (since July) and there are no signs of stress in the credit markets.
The Fed balance sheet expanded by another $16 billion to partially make up for the $41 billion contraction three weeks ago. The overall trajectory remains up since July 2020.
The 20+ Yr Treasury Bond ETF (TLT) got an oversold bounce within its long-term downtrend.
The Gold SPDR (GLD) extended its oversold bounce within a larger downtrend.
The Dollar Bullish ETF (UUP) is trading above its breakout zone and remains in an uptrend.
Oil hit another 52-week high and remains one of the strongest commodities.
TLT Gets Oversold Bounce to Support Break
The 20+ Yr Treasury Bond ETF (TLT) became quite oversold after a 6.7% decline in 13 days (bottom window). This decline reversed the counter-trend advance that retraced half of the prior decline and broke support in late September. This week’s three day surge is considered a short-term oversold bounce that could soon run into resistance from broken support in the 146 area (red shading). Overall, I remain bearish on Treasury bonds and bullish on Treasury yields.
Gold Extends Oversold Bounce within Downtrend
The Gold SPDR (GLD) got an oversold bounce in late September, stalled for a week and then surged again this week. The overall trend remains down and more is needed to reverse this downtrend. It is possible that GLD is forming a higher low from March to August and that the June-September decline is a big correction after the March-May advance. A break above the summer highs would fully reverse this downtrend and turn GLD bullish. I don’t see a setup in GLD right now because it is no longer oversold and nearing a resistance zone.
The red arrows show when the Momentum Composite hits +3 or higher (oversold), while the green arrows show when it hits +3 or higher (overbought). In general, I think overbought conditions are less reliable than oversold conditions when it comes to foreshadowing a short-term reversal. As the red arrows show, GLD became overbought in mid July and mid April, and stayed overbought as prices advanced. The blue ovals show overbought readings that foreshadowed short-term peaks.
Dollar Holds Range Breakout
The Dollar Bullish ETF (UUP) remains strong as it broke out of its 2021 range (blue) and held above this breakout. Long-term, the pattern looks like a massive double bottom. Medium-term, the Dollar was already in an uptrend when it moved into the upper half of the range in late June. UUP consolidated in the summer and then broke out to resume its uptrend. There is no setup on the chart. Just an uptrend.
Oil Hits Another New High
There is no change in oil as West Texas Intermediate extended on its channel breakout and hit another new high this week. Spot crude is up some 3% since mid August and one of the strongest commodities out there. There is no setup on this chart, just a strong and leading uptrend. The lower window shows the DB Energy ETF (DBE), which is around 92.3% oil complex and 7.6% natural gas. The price charts are pretty similar with consolidation breakouts in April and August, and a new high this week.