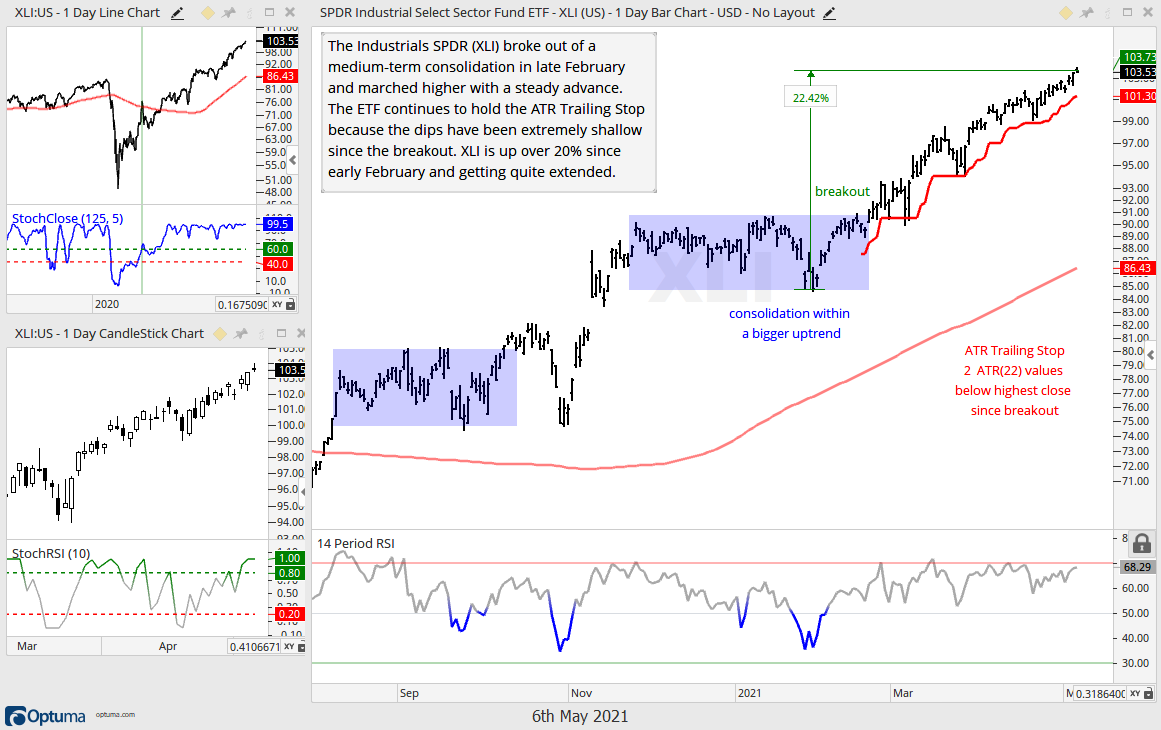
Old economy ETFs continue to lead. ETFs related to industrials, materials, metals, housing and finance hit new highs. These ETFs were already in uptrends and they were simply extending on their breakouts, which occurred in March or April. Even though they are leading and in strong uptrends, many are getting quite extended and ripe for a rest. This means they are in the trend-monitoring phase.
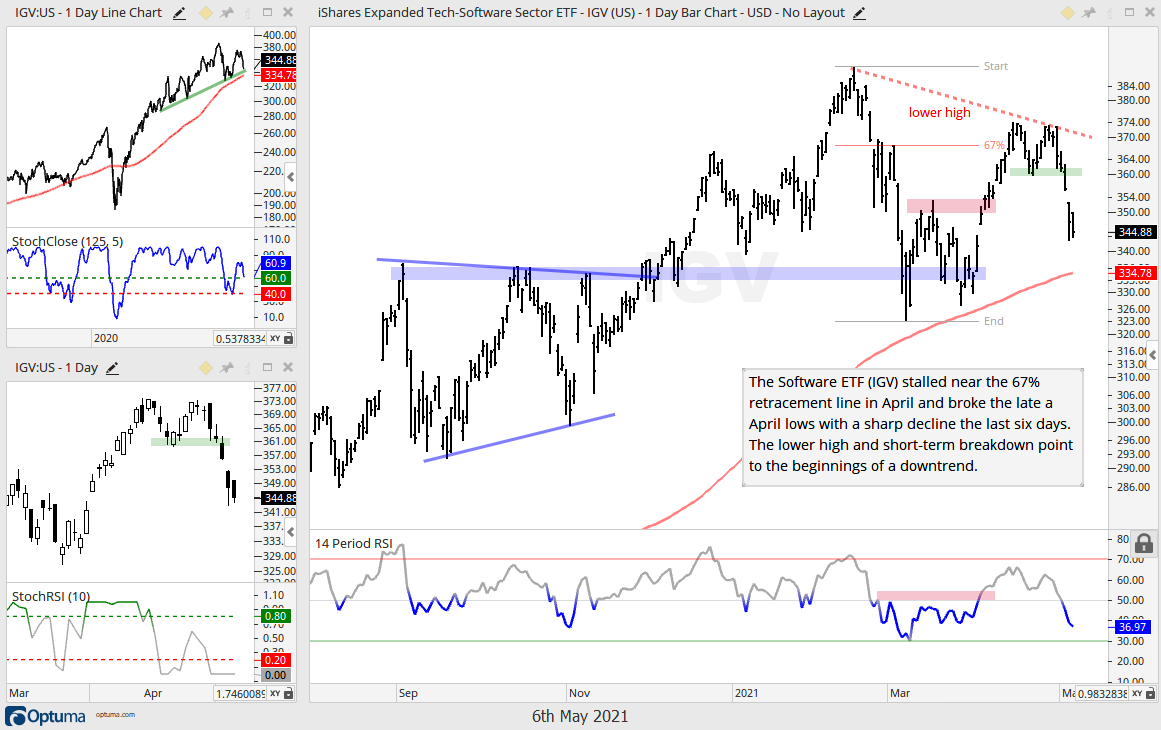
ETFs related to technology and high growth were hit hard the last six days. The Technology SPDR broke its late April low with a breakaway gap, the Semiconductor ETF failed to hold its early April breakout and the Software ETF formed a lower high, which means a downtrend could be starting. The message here is that high-growth and technology are out of favor.
There are no real setups this week (bullish continuation patterns). There are plenty of oversold conditions out there, but market conditions are not looking very good. The biggest sector in the S&P 500 is lagging and we are entering a seasonally week period (May-June)[1]. ETFs that are oversold right now are lagging and could remain oversold before a bullish continuation pattern takes shape. Now may be a good time to wait for the dust to settle and better setups to emerge.
You can learn more about my chart strategy in this article[2] covering the different timeframes, chart settings, StochClose, RSI and StochRSI.
New High this Week, Leading
XLF, XLI, XLB, ITB, IHF, DBA
The first two groups feature several old-school economy groups hitting new highs. These groups represent the polar opposites of crypto and NFTs (non-fungible tokens). The finance sector is in the mix along with industrials, materials, housing, copper, metals & mining, uranium and steel. There are no setups on these charts right now, just strong uptrends and new highs. At this stage, they are in the trend-monitoring phase, which means it is time to monitor and consider an exit strategy. Longer-term investors can consider a bigger trend change, such as a bearish StochClose signal, major support break or break below the 200-day. Shorter-term traders can consider profit targets, an ATR Trailing Stop or a combination of the two.
Metals ETFs Hitting New Highs
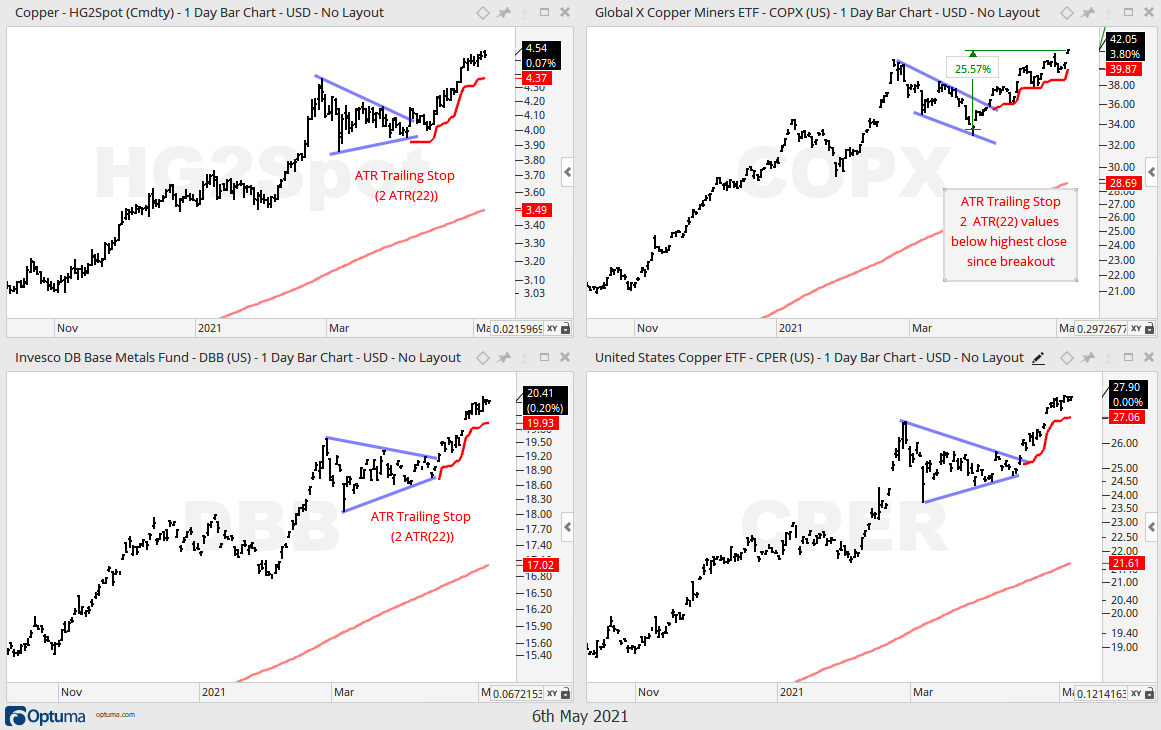
COPX, CPER, DBB, XME, URA, SLX
ETFs in this next group are dominated by industrial metals and all are hitting new highs. The Steel ETF (SLX) is up over 40% since early February and up over 20% since late March. Trend and momentum are strong, but the ETF is very extended. The copper related ETFs (Spot Copper, COPX, CPER, DBB) broke out in early-mid April and extended higher the last four weeks. The chart below shows these four with breakouts and the ATR Trailing Stop for reference. COPX formed a falling channel, while the other three formed triangles. All are bullish continuation patterns that provided a setup within the bigger uptrend.
You can learn more the StochClose indicator and strategies in this post.[3]
New High late April, Short Pullback
XLV, IHI
You can learn more about ATR Trailing stops in this post[4], which includes a video and charting option for everyone.
New High in April, Exhaustion or Breakaway Gap Down
XLC, XLY, IPAY, FIVG, IHI
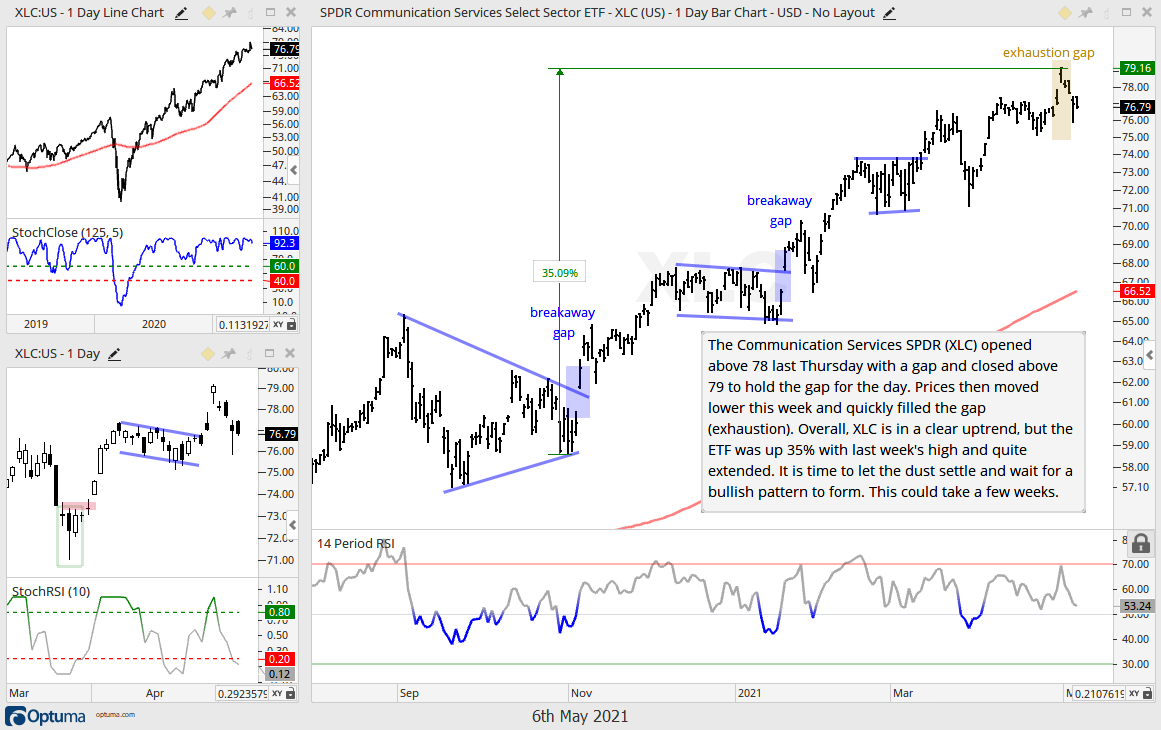
ETFs in this next group are in uptrends overall and leading with new highs in April. However, the Communication Services SPDR (XLC) sports and exhaustion gap and the others formed breakaway gaps on Tuesday. The exhaustion gap occurs when prices gaps higher within an extended up trend and price then quickly turn to fill the gap. This failure shows uptrend exhaustion that could foreshadow a correction. A breakaway gap occurs near a high and marks an acceleration to the downside. Prices opened below the prior close (gap) and continued lower after this gap. A breakaway gap shows strong selling pressure that can also signal the start of a correction.
Triangle Breakout in late April
IJR, IWM, KRE, KBE, BETZ
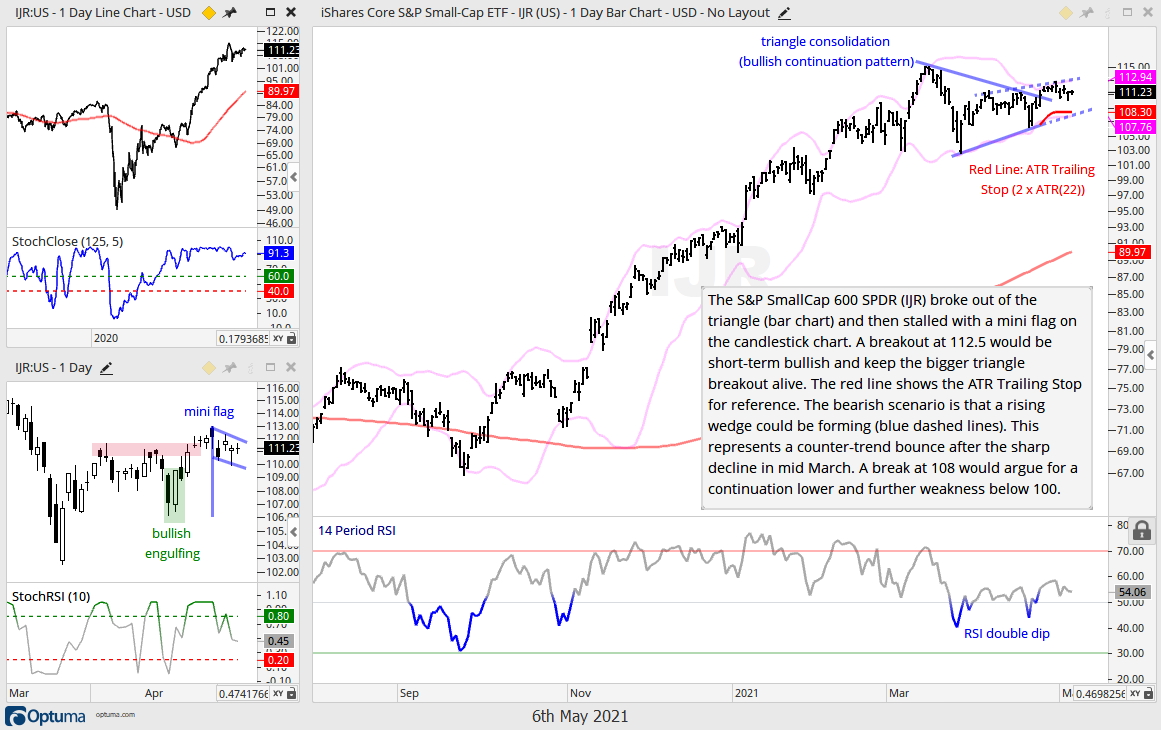
The Regional Bank ETF (KRE) and Bank SPDR (KBE) broke out of triangle patterns last week and these breakouts are largely holding, even though follow through was muted. Similarly, the S&P SmallCap 600 SPDR (IJR) and Russell 2000 ETF (IWM) have triangle breakouts working. This is not a coincidence because financial services is the biggest sector in IJR (25.5%) and IWM (23.6%). KRE and KBE are stronger than IJR and IWM because they moved higher the last three days. IJR is stronger than IWM because it stalled the last four days (IWM fell).
Above March High, Pennant Breakout
GLD, SLV
Wedge Breakout, Strong Follow Through
USO, XLE, FCG
Lagging and/or in Downtrends
ETFs from here on down are lagging and/or in downtrends. Some are consolidating above their 200-day SMAs (MJ, YOLO), some are flirting with their 200-day SMAs (IBB) and some broke their 200-day SMAs (PBW, ICLN, XBI). The tech-related ETFs formed lower highs from February to April and broke their mid April lows with sharp declines this week. The are above their 200-day SMAs, but lagging and lower highs could signal the start of a downtrend.
Lagging in April, Short-term Breakdown
SOXX
Short-term Break Down
QQQ, XLK
Failed Breakouts
QQQJ, IWO
Above Rising 200-day, Consolidation since mid February
MJ, YOLO
Peaked below February High, Broke Short-term Support
IGV, FDN, FINX, SKYY, CIBR, ROBO, FAN, HERO
The tech-related ETFs have similar chart characteristics (plus ROBO, FAN and HERO). They all fell sharply from mid February to early March and bounced with moves above their mid March highs. These moves did not come close to the mid February highs and these ETFs ended up forming lower highs as they broke their late April lows with sharp declines this week. These breaks signal a continuation of the Feb-Mar declines and target a test of the 200-day SMAs, which are all still rising.