There are still plenty of short-term setups out there. These include one to three week pennants, flags and falling wedges. There were even some short-term breakout attempts in late May and early June. Several of these breakouts are under pressure as prices fell back. A short-term consolidation within an uptrend is typically a bullish continuation pattern, but many of these ETFs are up substantially over the last few months and these patterns are forming within mature advances. Throw in some summer doldrums and we could see some choppy price action that would result in whipsaws for short-term traders. The good news is that failed flags and pennants do not affect the longer-term uptrends.
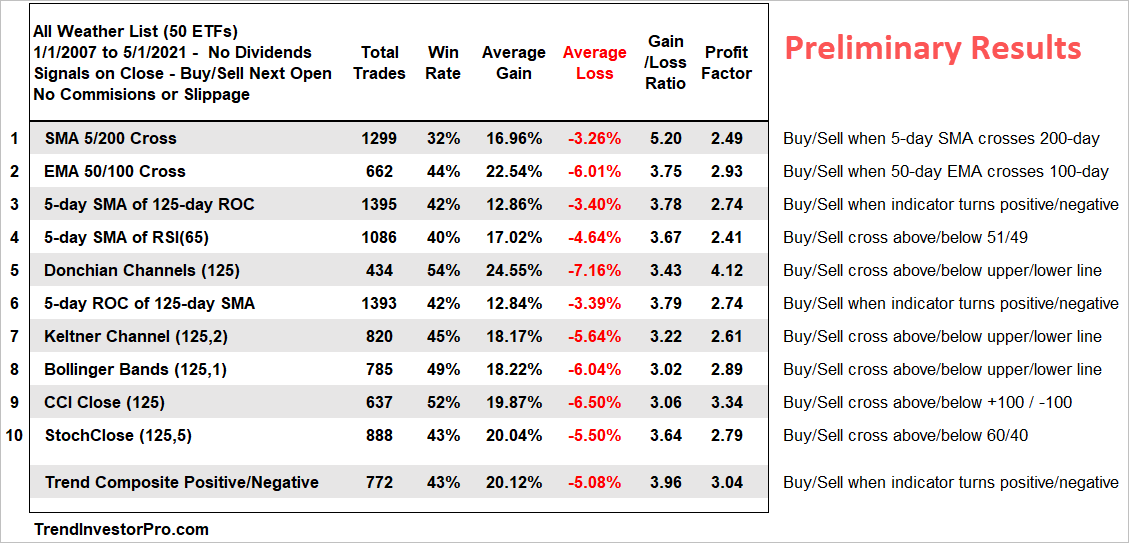
The trend indicator shoot out is taking longer than expected because I need to make sure my numbers are right. Look for this report and video on Tuesday. The table below shows preliminary results when testing 10 trend-following indicators and the Trend Composite. The CCI Close signals are taking the cake! The Donchian Channel performed the best, but had the fewest signals, by far.
Steady Uptrends in the Middle of the Channel
SPY, RSP
The S&P 500 SPDR (SPY) and S&P 500 EW ETF (RSP) remain in steady uptrends with rising channels. The green lines show a Linear Regression Channel. The middle line is a linear regression and the outer lines are 2 standard deviations above/below. Both SPY and RSP are in the middle of these channels. The overall trend is clearly up and they recently bounced from the lower line and rising 50-day SMA. This means the short-term setups passed and they are simply in the middle of their uptrends. These uptrends are more of a grind higher – in contrast to a surge, consolidate and repeat sequence. This kind of grind translates into short-term choppiness that can increase the chances of whipsaw for short-term traders.
Leading, Strong and Extended
XLRE, IYR, REZ, XLE, XES, XOP, FCG
REITs continue to lead with seriously strong moves over the last four weeks. They are all in uptrends, but getting quite extended as RSI exceeded 78 for the Real Estate SPDR (XLRE). The yellow lines on the chart show RSI exceeding 78 on April 21st and June 9th. Normally, I consider 80 to be overbought, but XLRE has relatively low volatility. Note that 78.76 is the highest RSI(14) period reading ever for XLRE, which started trading in June 2015.
The energy-related ETFs are also leading with new highs here in early June. They are also quite extended after big moves since late April. XES, XOP and FCG are up more than 30% the last seven weeks. Overextended is not bearish, it just means that short-term traders are late to the party and we could see a consolidation or pullback.
Consolidation Breakouts, New Highs, Short-term Extended
CARZ, DRIV, IDRV
The three auto ETFs surged to new highs in early June and are leading the broader market. CARZ is the strongest of the three and remains my main focus. The Global Auto ETF (CARZ) was on our radar as it tested support in the 54 area and reversed the downswing within the larger consolidation on May 21st. The bar chart captures the large consolidation and breakout, while the candlestick chart captures the downswing reversal.
Entry is a very important part of the trading/investing puzzle. A good entry, such as the downswing reversal on the candlestick chart gives us more leeway with our stops or exit strategy. The consolidation breakout is still bullish longer term, but CARZ could pull back into the consolidation at some point. I would not consider that a failed breakout. In contrast, such a pullback would set up the next opportunity.
Flag/Pennant Breakouts Looking Vulnerable
XLF, XLI, XLP, XLB, XME, MOO
There are several ETFs in steady uptrends and they recently formed short-term flags or pennants. Technically, these are short-term bullish continuation patterns, but they could fail because these ETFs are quite extended. Anecdotally, short-term flags and pennants seem to work best after the first one or two legs higher. The odds of success decrease as the advance matures.
XLF, XLI, XLB, XME and MOO have largely held above their 50-day SMAs since early February (four months). XLF is up 30%, XLI and XLB are up 22%, XME is up 45%, XLP is up 10% and MOO is up 18%. These are big moves without a decent corrective period and this increases the chances for choppy price action, which in turn increases the odds for failed breakouts.
The chart below shows XLF with an initial 24% surge in November, a pennant in December and a breakout. XLF then formed a small falling wedge that retraced 33% and broke out in early February. This makes for two successes. Another pennant formed in late February with a breakout in early March. There was a hard throwback after this breakout, but the pennant low held and prices move to new highs in May.
This brings us to the current pennant and breakout, which is already under threat with a pullback this week. Keep in mind that pennants and flags are short-term in nature. A failed pennant and break below the pennant lows would not be enough to reverse the bigger uptrend. XLF is, however, up 66% since late October and entitled to a correction. Corrections evolve as trading ranges or pullbacks.
You can learn more about my chart strategy in this article[1] covering the different timeframes, chart settings, StochClose, RSI and StochRSI.
Upswing within Widening Uptrend
QQQ, XLK, SOXX, IPAY
ETFs in this group hit new highs in April, pulled back into May and reversed these downswings with breakouts around May 20th. This puts them in the trend or position monitoring phase. The first chart shows QQQ reversing in the 50-67 percent retracement zone and breaking out with a surge above 328. This breakout move extended the last few weeks and the ATR Trailing Stop rose to 328.39 (call it 328). This level jibes with last week’s low so a close below 328 would negate the breakout.
Seeing What is Really There
Technical analysis can be very subjective. In fact, a chartist could decide to be bearish and then look for supporting bearish arguments. The same is true on the bullish side. The constant battle is to see what is really there, not what you want to see or what you think you see (h/t David Fuller RIP).
The Semiconductor ETF (SOXX) provides a great case in point. I could easily find a bearish argument on this chart by saying that the big consolidation since late January is a large topping process (red arcs). Momentum is waning because RSI formed lower lows and lower highs since January. A break below the March-May lows would confirm this pattern and target a decline to the 300 area.
Anything is possible, but I default to the current market regime and overall trend for my bias. We are in a bull market, SOXX hit a new high in early April and the ETF is less than 5% from this high. Price is above the rising 200-day and the 50-day is well above the 200-day. Momentum is waning because SOXX largely consolidated the last five months. Also keep in mind that SOXX was up over 50% from late September to mid February. The ETF is entitled to a rest (correction) after such a move. A consolidation within a bigger uptrend is more likely a bullish continuation pattern than a reversal.
Ascending Triangles, Breakouts
FIVG, ITA, XAR, XRT
There are also a few Ascending Triangles and breakouts working. The example below shows the Next Gen Connectivity ETF (FIVG) with equal highs and a higher low forming an Ascending Triangle. This is a big bullish continuation pattern and the breakout signals a continuation higher. As with most big bullish continuation patterns, I am looking to time the downswing reversal within the pattern to get a jump on the bigger breakout. The candlestick chart shows FIVG breaking out on May 20th and the ATR Trailing Stop rising along with price the last few weeks. This stop is for traders. Longer-term investors should watch price action going forward and remain bullish as long as the long-term trend is up.
Triangle Breakout
IJR, KRE
The Regional Bank ETF (KRE) broke out of its triangle in late April and continues to dilly-dally just above the breakout zone. Failure to follow through seems negative, but the bigger trend is up and the breakout is still holding. Thus, the cup is half full as long as 68 holds on a closing basis. While a break below 68 would be negative, it would not reverse the bigger uptrend and just lead to the next bullish setup. KRE is also up big (100+ percent) from late September to mid March and may need time to digest this big gain. The dashed lines show the possibility of a bigger falling channel, should the triangle breakout fail. Note that this is HIGHLY subjective!
You can learn more about ATR Trailing stops in this post[2], which includes a video and charting option for everyone.
Falling Wedge Breakout, Stalling
JETS
There is no change with the Airline ETF (JETS). The ETF hit a new high, corrected with a falling wedge that retraced 50-67 percent and broke out in mid May. The breakout is holding, but we have yet to see follow through. The green zone marks support from the post breakout low and a close below 25.70 would warrant a re-evaluation.
You can learn more the StochClose indicator and strategies in this post.[3]
Short-term Flag, Pennant, Wedge
COPX, CPER, DBB, SLX, DBA
ETFs in this group are similar to XLI and XLF. The long-term trends are up and short-term bullish continuation patterns formed (flags, pennants, wedges). They popped in late May, but fell back into their short-term corrective patterns here in June. The chart below shows Spot Copper ($COPPER), the DB Base Metals ETF (DBB), the Copper Miners ETF (COPX) and the Copper ETF (CPER). These four are highly correlated and move in the same direction. RSI dipped into oversold territory as these short-term pullbacks unfolded. Watch for breakouts and/or a StochRSI pop above .80 to signal a continuation higher. Keep in mind that we could be entering a lull in the market and the risk of whipsaw remains above average for short-term traders.
The DB Agriculture ETF (DBA) broke out in late May and continued sharply higher.
Oversold Bounce or Setup
XLV, XLU, IHF, IHI
The Healthcare SPDR (XLV) became short-term oversold as RSI dipped into the 30-50 zone last week and the ETF popped this week with StochRSI surging above .80. There are three StochRSI pops since May, but this is the first one since RSI dipped into the oversold zone. Oversold is the first condition to look for and the StochRSI pop signals a short momentum burst that could end the pullback. A close below 121 would call for a re-evaluation.
The Medical Devices ETF (IHI) is also at an interesting juncture with a falling wedge taking shape since May. The long-term trend is up and a falling wedge that retraces 50-67 percent of the prior advance is typical for corrections within bigger uptrends. On the candlestick chart, I am focused on the swing within this wedge and a breakout at 341 would reverse this downswing. Also watch for a StochRSI pop.
The Utilities SPDR (XLU) is setting up bullish. The ETF hit a new high with a 16% advance and then retraced around a third with a falling channel pullback (bar chart). A breakout at 66 would reverse this downswing and signal a resumption of the bigger uptrend. The candlestick chart shows a triangle forming and a StochRSI pop on Wednesday.
Upswing within Bigger Triangle
IGV, SMH, FDN, CIBR, BETZ
ETFs in this group are in long-term uptrends, but they have been consolidating for a few months and have yet to exceed their April highs, much less their February highs. These five have big triangle consolidations working, which are big bullish continuation patterns. The swings within these consolidations turned up with breakouts on May 20th and prices extended higher the last few weeks.
The chart below shows the Software ETF (IGV) with a big triangle on the bar chart and a short-term breakout on the candlestick chart. Price is near the upper trendline on the bar chart and IGV is up around 10% since mid May. While a triangle breakout would be bullish, the reward to risk ratio is not good because the triangle low if far away. Trading the swing within the bigger pattern provided a better reward to risk ratio. This swing is now mature and possible resistance is nigh. The red line marks the ATR Trailing Stop for reference. Also watch last week’s low.
Surging off Support
IBB
The Biotech ETF (IBB) is the best performing ETF over the last five trading days (+6.24%). Biogen (BIIB) drove most of these gains with a 51% surge the last five days. BIIB now accounts for around 5% of the ETF. On the price chart, IBB battled broken support, the 67% rertracement and 200-day SMA from early March to mid May. This zone eventually held and this week’s surge solidifies support. More importantly, it signals an end to the corrective period and a resumption of the bigger uptrend. The line chart in the upper left captures the long-term picture (falling wedge breakout).