Tech and Healthcare led the market higher over the last eight weeks and these two groups are still holding up, as are their related ETFs. Despite leading, note they fell short of their February highs and could still be vulnerable to broad market weakness. Correlations tend to rise in bear market downturns. Some of the lagging groups are already breaking down, such as industrials and finance, and the SPY is also breaking down. At best, we could see a pullback after the big bounce off the March lows. At worst, these breakdowns signal a continuation of the bigger downtrends and new lows could be ahead.
Profit Target Strategy with StochClose
Note that I found a discrepancy with the trade executions and re-ran the numbers. Basically, new trades were being entered on the same day exits were triggered when profit targets were hit. There should have been a one day delay for new trades. Results are not as good, but still ok (article here)[1].
This strategy did NOT use a bull market filter (5-day SMA of S&P 500 above/below 200-day). It did not consider rising wedges, retracements and bear market bounces because I cannot code these situations. We are in a bear market environment right now, in my humble opinion, and negative events are more likely when the S&P 500 is below its 200-day SMA. Moreover, most stocks and stock-related ETFs will follow the S&P 500 and correlations tend to rise when the S&P 500 moves lower. Keep in mind that there are 40 stock-related ETFs involved in this strategy and it took a hit in 2008.
Update for SPY First
I updated the big three yesterday with a video[2] and it looks like the S&P 500 SPDR is breaking down. A bearish engulfing formed below the 200-day SMA and near the 61.8% retracement. SPY then followed through with a sharp decline on Wednesday. RSI moved below 50 for the first time since April 7th, StochRSI plunged below .20 for the first time since late February and S&P 500 %Above 20-day EMA (!GT20SPX) moved to 30.8%, its lowest level since April 3rd. Yesterday’s Optuma chart showed 20-day High-Low Percent and this indicator plunged below -10% for a bearish signal on Wednesday.
Top 20 ETFs Ranked by StochClose
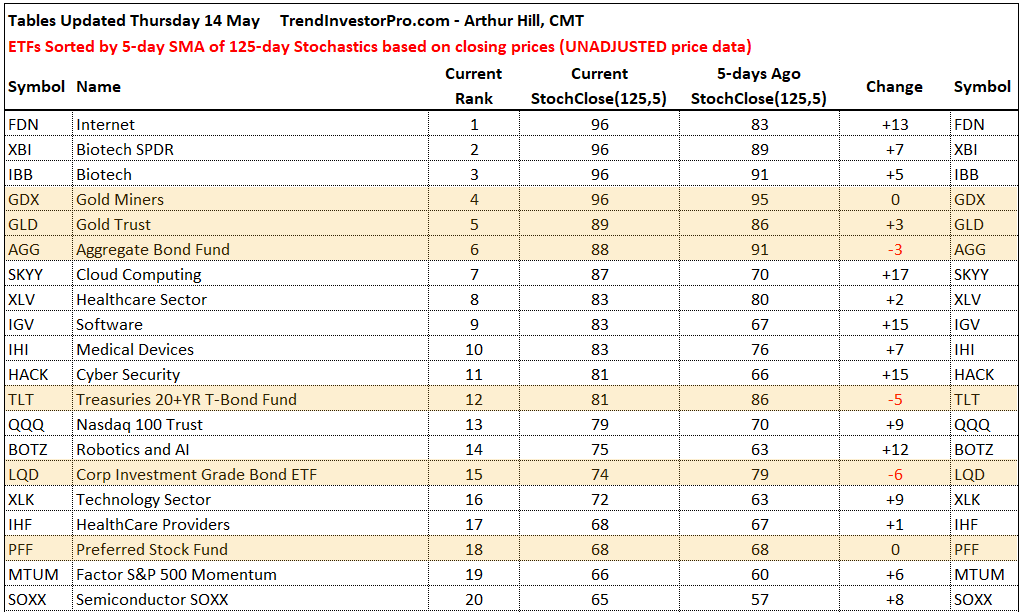
The table below shows the top 20 ETFs ranked by the 5-day SMA of the close-only Stochastic (StochClose). Smoothing with a 5-day SMA creates some lag and this is why we are still seeing big positive changes in several tech ETFs (FDN, SKYY, IGV, HACK, BOTZ). Tech, Healthcare, bonds and gold continue to dominate the top twenty list. In fact, six of the twenty ETFs are what I consider as stock alternatives (yellow shading). Tech-related ETFs are powering the market and loss of tech leadership would seriously weigh. Note that XLI, XLF, XLE, IJR, KRE, KBE, KIE and XAR have StochClose values below 40, which points to a clear downtrend and relative weakness.
Several Key Groups are Lagging
The image below shows a scatter plot for the 60 core ETFs with StochClose on the y-axis and RSI(14) on the x-axis. The green box shows ETFs with a StochClose above 60 (clear uptrend) and RSI(14) above 50 (yet to break down). The Technology and Healthcare ETFs reside here as well as the 20+ Yr Treasury Bond ETF, Gold SPDR and US Dollar Index.
The red box shows ETFs with a StochClose below 40 and RSI below 50. These ETFs are in downtrends and already show signs of short-term breakdowns (RSI below 50). Banks, industrials and energy related ETFs fit here and they are the weakest overall. Just above the red box, we can see the S&P 500 EW ETF (RSP), S&P MidCap 400 SPDR (MDY) and Russell 2000 ETF (IWM). StochClose is below 50 and RSI is below 50. These three also broke down this week.
Equal-weights, Mids and Smalls Already Breaking Down
The next chart shows RSP, MDY and IJR breaking down with sharp declines the last two days. I am only showing a six month chart because price action prior to 2020 is largely irrelevant. The big breakdown and rebound occurred in 2020 and this is the only price action we need to see. RSP and MDY got above their 50% retracement lines, but IJR did not (small-caps lagging). All three bounced last week and quickly gave it all back with breaks below the prior low this week. Oh, an all three are well below their falling 200-day SMAs.
Leaders - At or Near New Highs
TLT, GLD, GDX, FDN, IBB, XBI
Technically, ETFs that hit new highs this week are the leaders (FDN, IBB and XBI). However, their charts are not the stuff of stable and consistent uptrends. They are volatile beasts and this means they carry added risk. The chart below shows IBB breaking out to a new high with a 40+ percent advance. There was a four day pullback in early May and another push to new highs. It is still quite extended though and chartists might consider waiting for a pullback. The broken resistance zone turns first support in the 122-125 area and RSI support would be in the 40-50 area.
In contrast to IBB, the 20+ Yr Treasury Bond ETF and the Gold SPDR have bullish setups working on the price charts. GLD surged some 18% and then formed a pennant, which is a bullish continuation pattern. RSI also firmed in the 40-50 zone, which signals a mild oversold condition that could pave the way for a bounce.
TLT went wild in March and then chopped around the last seven weeks. Overall, it looks like a surge and consolidation, which makes this a bullish setup akin to a flag. TLT is near the low end of this consolidation and perhaps preparing for a bounce. RSI is also mildly oversold. I suspect that TLT went nowhere as stocks surged the last six weeks. TLT may find a bid again should stocks decline because it is the natural alternative.
ETFs in the second group led the bounce over the last seven to eight weeks and they are above their 200-day SMAs. Nevertheless, they all recorded 52-week lows in March and remain short of their 2020 highs. The Technology SPDR (XLK) represents this group well and speaks for the tech-related ETFs in this group. XLK surged from 70 to 95 in less than eight weeks (+35%). It was a massive move that fell short of a new high and an RSI(14) reading above 70. Again, how can RSI not become overbought after a 35% gain. This shows that upside moment was perhaps not as strong as it seemed. RSI remains above 50 for now, but we saw a StochRSI plunged below .20 for a bearish momentum thrust.
The bottom window shows XLK %Above 20-day EMA (!GT20XLK) with a line at 50%. The cup is half full when above 50% (more short-term uptrends) and half empty when below 50% (more short-term downtrends). This indicator just moved below 50%.
The next chart shows the Healthcare SPDR (XLV) holding above its rising 200-day with a pennant consolidation. This could be a bullish continuation pattern and an upside breakout would confirm. RSI remains above 50 so the momentum cup is half full and XLV %Above 20-day EMA (!GT20XLV) is above 50%. Things could quickly change though. A support break on the price chart, RSI break below 50 and %Above 20-day EMA move below 50% would be bearish.
~61.8% Retracement and above last Week's Low
MTUM, XLY, XLC, FINX, SOXX, PFF
The next group of ETFs retraced around 61.8% of their prior decline and did not break last week’s low (yet). Nevertheless, they have some pretty precarious looking charts. The first chart shows the Consumer Discretionary SPDR (XLY) failing to exceed its falling 200-day SMA twice as a rising wedge formed. The ETF broke the wedge line, but has yet to break short-term support and forge a lower low. I expect a breakdown because the bigger trend is down and XLY %Above 20-day EMA (!GT20XLY) is already below 30%.
The next chart shows the Semiconductor ETF (SOXX) with a long-term bearish configuration that is present on many charts. First, there is a big breakdown and 52-week low. Second, there is the counter-trend bounce that falls well short of the prior high. A “subjective” rising wedge formed with last week’s low marking first support. A support break and RSI move below 50 would complete the reversal and signal a continuation of the February-March decline.
~61.8% Retracement and Short-term Breakdown
XLB, XLU, XLRE, XLP, VIG, HYG
The defensive sectors led the market higher on the initial bounce from March 24th until April 9th, but weaken over the last four to five weeks. It is tempting to see falling flag/wedge type patterns and consider these as bullish continuation patterns. However, all three are in downtrends as they hit 52-week lows in March and remain below their falling 200-day SMAs. In addition, the Index Breadth Model is bearish and correlations tend to rise when the S&P 500 weakens. In other words, there are few, if any, places to hide. REITs look especially weak. This could be tied to relative weakness in the finance sector, of which it was a part of a few years ago.
~50% Retracement and above last Week's Low
IPAY, ITB, XHB, XRT, SLV
As noted with SOXX above, most of these bounces look the same. Some retraced more of the prior decline and some retraced less. The chart below shows the Home Construction ETF (ITB) with a bearish configuration (breakdown, ~50% retracement, rising wedge, below falling 200-day SMA, RSI failure to exceed 70). This is a classic counter-trend bounce with support marked at 34. A break here and RSI break below 50 would reverse the upswing.
The Silver ETF (SLV) is somewhat of a stock alternative. The precious metal part is helped by gold, but weakness in the broader stock market weights on the industrial metal side. The ETF broke out of a pennant and this breakout is actually holding. I would be careful and watch closely because the long-term trend is still down.
~50% Retracement and Short-term Breakdown
RSP, MDY, IJR, IWM, USMV, IYR
I showed charts for the first three at the beginning of this commentary and the chart for IWM yesterday. These ETFs retraced around 50% of the prior declines (average retracements). IWM is showing signs of a breakdown with a move below last week’s low, RSI move below 50, StochRSI plunge below .20 and S&P 600 %Above 20-day EMA (!GT20SML) plunge below 30%.
Shallow Retracement and above last Week's Low
XLE, XES, REMX, IEMG, EFA
The Oil & Gas Equipment & Services ETF (XES) fell off a cliff earlier this year and bounced with the rest of the market the last eight weeks. This bounce retraced less than a quarter of the prior decline and formed a bearish wedge.
Now we get to the weakest ETFs in the core list, and there are some key groups represented here. Finance, banks, insurance, industrials, defense and metals-mining. Hard to have a bull market with these groups breaking down. The charts below show shallow retracements and failed attempts to bounce last Friday. XLF, XLI and KRE broke below support and all three triggered bearish momentum thrusts. These breakdowns signal a continuation of the bigger downtrends and will weigh on the broader market.