ETF Ranking and Grouping – Staples and Utes Leading – Software and Biotech Look Vulnerable
Posted By
Arthur Hill, CMT
On
In
Archive |
No Comments
Today’s report will rank and group my core ETF universe from strong uptrends to clear downtrends. Most of these ETFs are stock ETFs, but I also include several bond-related ETFs and a few commodity ETFs in my universe.
The defensive groups continue to dominate with consumer staples, utilities and REITs leading the sectors. Within the industry groups, I am still seeing strong uptrends in ETFs related to homebuilders, insurance, aerospace-defense and solar.
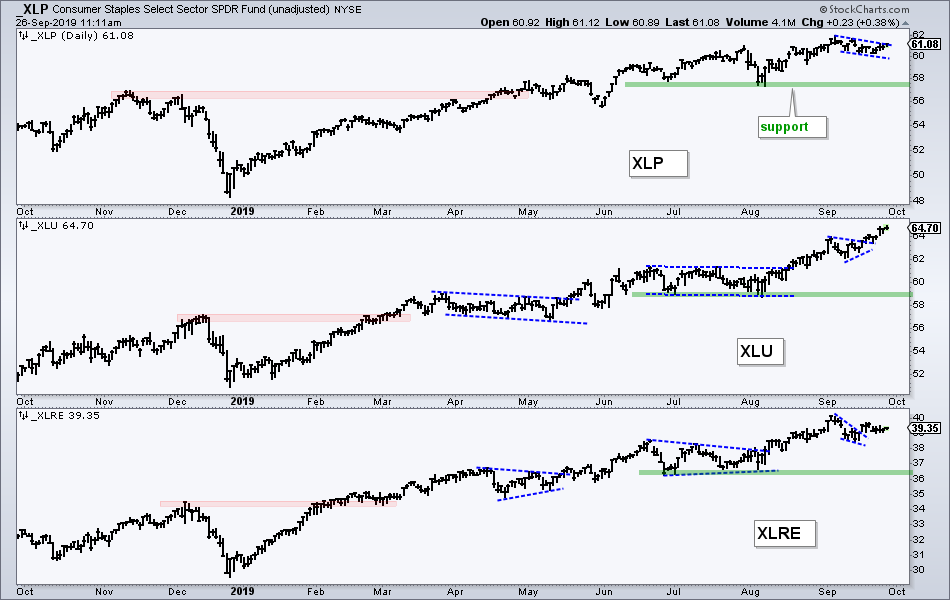
As far as the broader stock market is concerned, I continue to watch SPY, QQQ and XLK quite closely because they did not take out their July highs. XLU, XLP and XLRE recorded new highs in September. This means SPY, QQQ and XLK are lagging these three defensive sectors. Technology is still the largest sector and relative weakness in this behemoth is noteworthy. This was covered in Wednesday’s commentary (click here).
ETF Rankings and Groupings
There are six groups this week. Group 1 represents the strongest ETFs right now and those that are still in strong uptrends (XLU, XLP…). ETFs in Group 2 are still in uptrends, but they did not exceed their July highs (QQQ, XLK…). ETFs in Group 3 are correcting within uptrends (TLT, GLD…).
ETFs in Group 4 and 5 are the most vulnerable right now. ETFs in group 4 underperformed during the August-September bounce (IGV), while ETFs in group 5 are in downtrends and backing down from resistance (IWM,KRE). ETFs in group 6 are in downtrends and not on my radar. Note that IBB and XBI were demoted to this last group.
Note that I precede all my chart symbols with an underscore (_SPY) to chart unadjusted data, which is data without dividend adjustments. Dividend adjustments are good for seeing the total return picture, but I prefer unadjusted data for charting purposes. Dividend adjustments add the dividend back to the price and creates an upward skew. Looking for an example? Compare $SPX with SPY over a 20 year period.
Setting the Benchmark Levels
When it comes to stocks and equity-related ETFs, my goal is to trade long, trade only uptrends and trade the leaders. I am not looking to pick bottoms, and I certainly do not want to focus on ETFs in downtrends or those that are lagging by a wide margin.
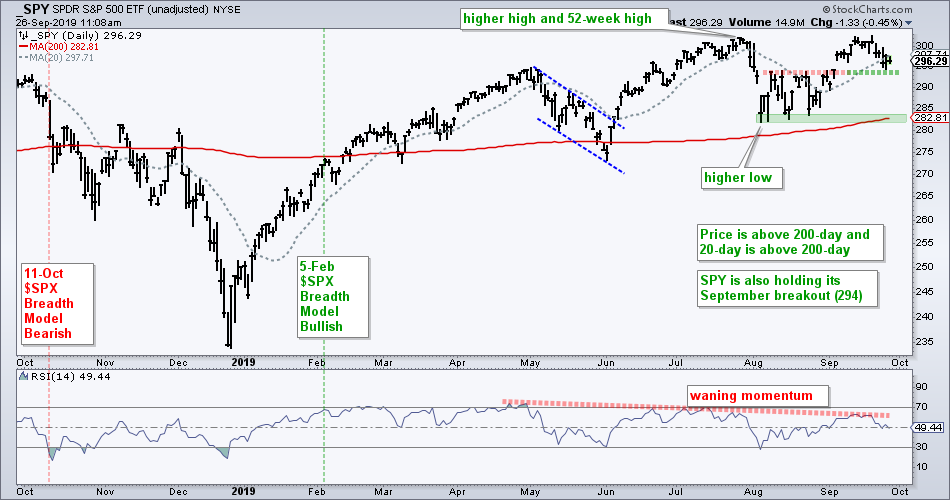
The S&P 500 SPDR (SPY) serves as my benchmark ETF to compare chart performance against other ETFs. There are two benchmark levels that I am using for comparison: the July high and the August low. The July high was higher than the April high (higher low) and a 52-week high. The August low was above the early June low (higher low) and marks a major support zone.
Here are the key questions to ask when looking at the ETF charts. First, did the ETF form a higher high from April to July? Second, did the stock/ETF exceed its July high in September? Third, did the ETF form a higher low from June to August? The ETF is a clear leader if you can answer yes to all three questions.
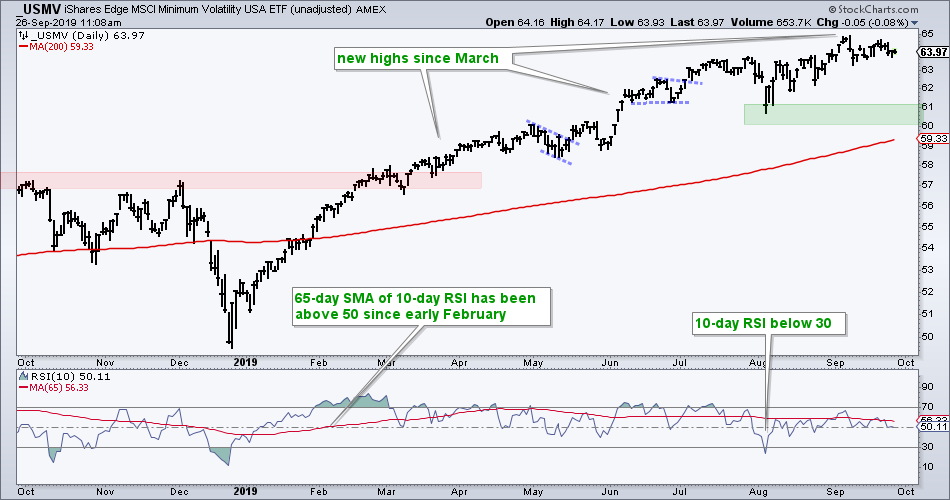
The S&P 500 Minimum Volatility ETF (USMV) is clearly a leader on the price chart. The ETF has been hitting new highs on a monthly basis since the March breakout. Most recently, the ETF hit a new high in early September. The August low is well above the early June low and price is well above the rising 200-day SMA.
The three defensive sectors are also firmly in the leadership group with the Utilities SPDR (XLU) breaking away from the Consumer Staples SPDR (XLP) and Real Estate SPDR (XLRE). XLU broke out of a small pennant and hit a new high this week. XLP has a bull flag working and a breakout at 61 would signal a continuation higher. XLRE broke out of a small wedge and stalled after the breakout.
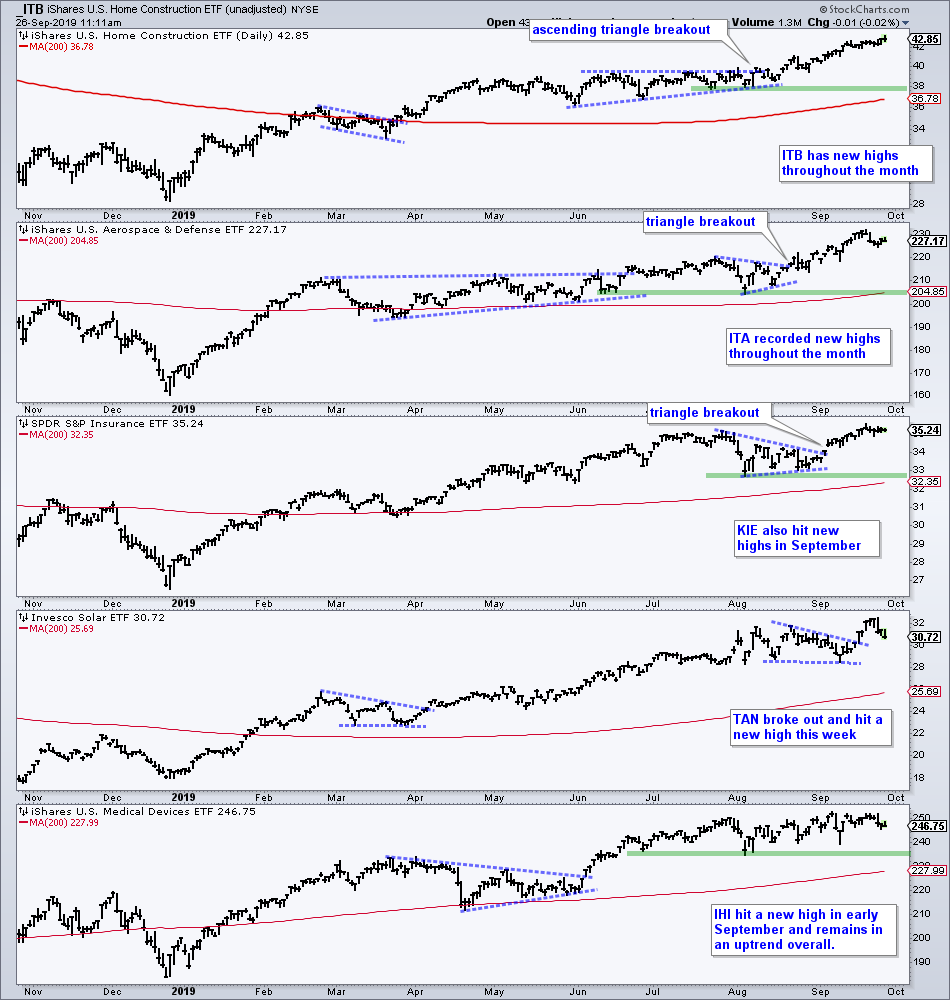
The Home Construction ETF (ITB), Aerospace & Defense ETF (ITA), Insurance ETF (KIE) and Solar Energy ETF (TAN) hit new highs in the second half of September and remain in strong uptrends. The Medical Devices ETF (IHI) hit a new high in early September and stalled, but remains a leader overall and in a clear uptrend.
Uptrends, but Still below July Highs
The next group of ETFs are in uptrends, but lagging the first group because they did not exceed their July highs. These ETFs are basically performing “in line” with SPY and have similar looking charts.
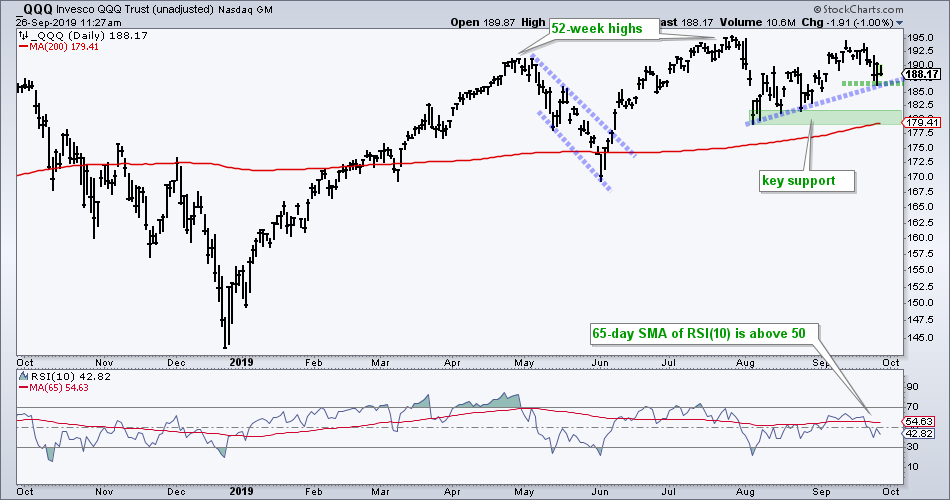
The chart below shows the Nasdaq 100 ETF (QQQ) in an uptrend overall, but falling just short of its July high. The swing since early August remains up with the trendline and Tuesday-Wednesday lows marking support at 186. A break here would be short-term negative and set up a big test of key support in the 179-181 area.
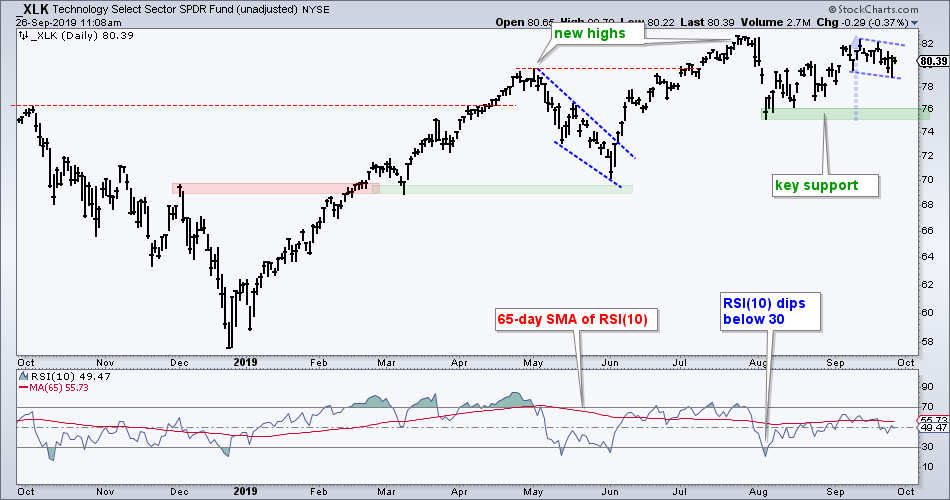
The Technology SPDR (XLK) is also in this performance group and could be forming a bull flag. Yes, we have to keep an open mind, especially when we are in a bull market environment and XLK is in an uptrend overall. Even though XLK has yet to exceed its July high, it is just 2.5% from this level and hardly weak. After an 8.5% advance from early August to mid September (blue line), the ETF consolidated with a small corrective pattern. A breakout at 82 would end this consolidation and signal a continuation higher.
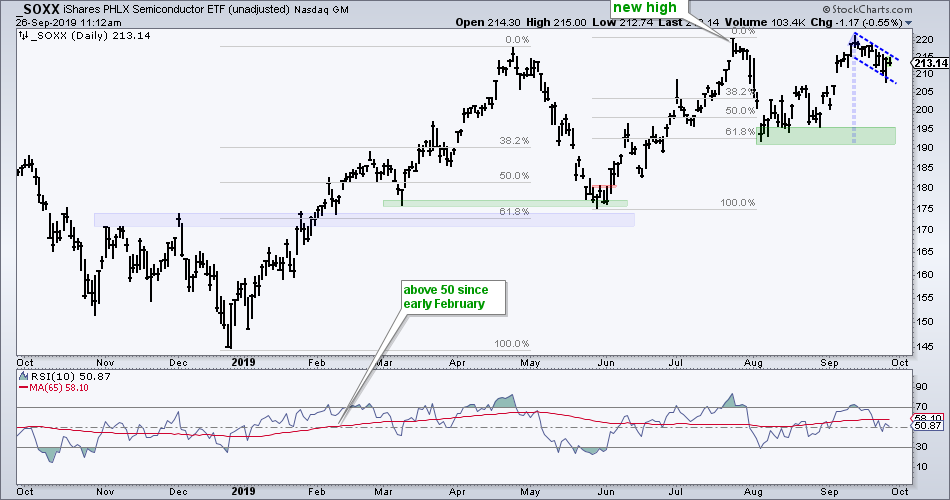
The Semiconductor ETF (SOXX) exceeded its July high intraday this month, but not on a closing basis. It too has a potential bull flag working with a 13% surge from early August to mid September and a pullback over the last nine days. A move above 217 would break flag resistance and signal a continuation of the prior advance. This would also pave the way for a new high and renewed leadership from this key group. Such a breakout would be quite positive for the broader market. But it ain’t happened yet.
Correcting within Uptrend
AGG, TLT, TIP, MUB, GLD, SLV
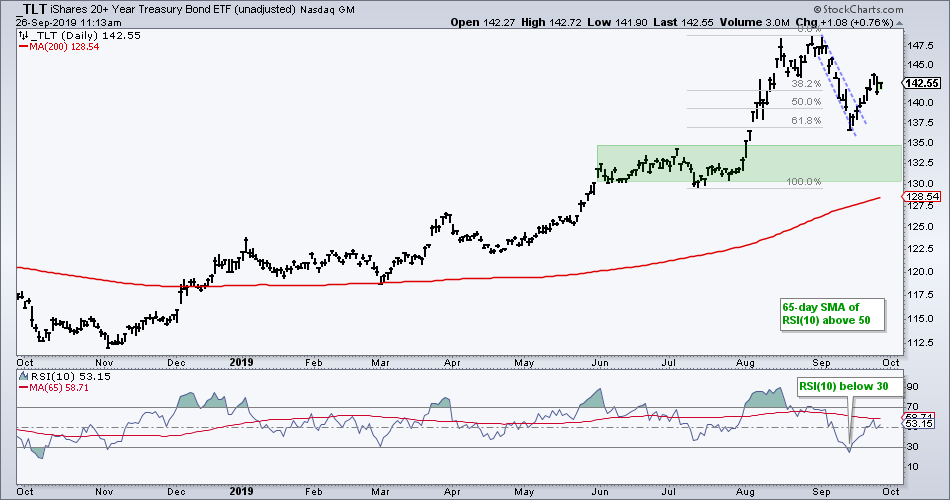
Hindsight is 20/20 and I missed the oversold bounce in the 20+ Yr Treasury Bond ETF (TLT). The blame? Thinking of possibilities (subjective) instead of considering the probabilities (objective). I was thinking TLT could correct back to the 130-135 area before getting a decent oversold bounce. Instead, I should have focused more on the trend and the short-term oversold conditions. The trend is clearly up and RSI(10) dipped below 30 for a classic mean-reversion setup in mid September. We can also throw in the 61.8% retracement and falling flag for good measure.
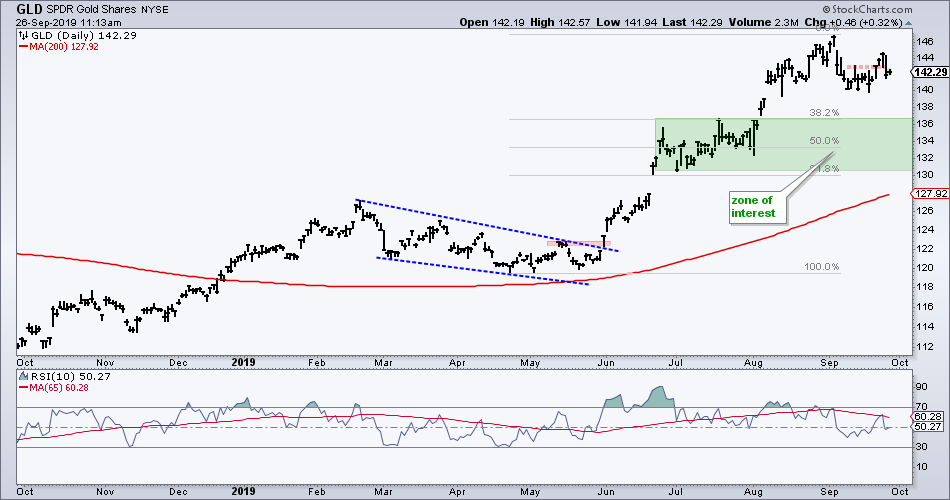
The Gold SPDR (GLD) also corrected with a dip in mid September, but RSI did not become oversold with a move below 30. This was a mild oversold conditions and not worthy of the mean-reversion signal. GLD broke short-term resistance with a bounce early this week, but fell right back below the breakout. This looks like a failed breakout and GLD could have further correcting to do.
Weak Bounces in August-September
IPAY, IGV, HACK, FINX, FDN
The next group of ETFs were leading in July, fell in August and did not get back up. They are still in uptrends overall, but recent weakness is a concern. Nevertheless, they are still at interesting junctions as they stall near their August lows. These ETFs are also tech related and should be watched for clues on XLK.
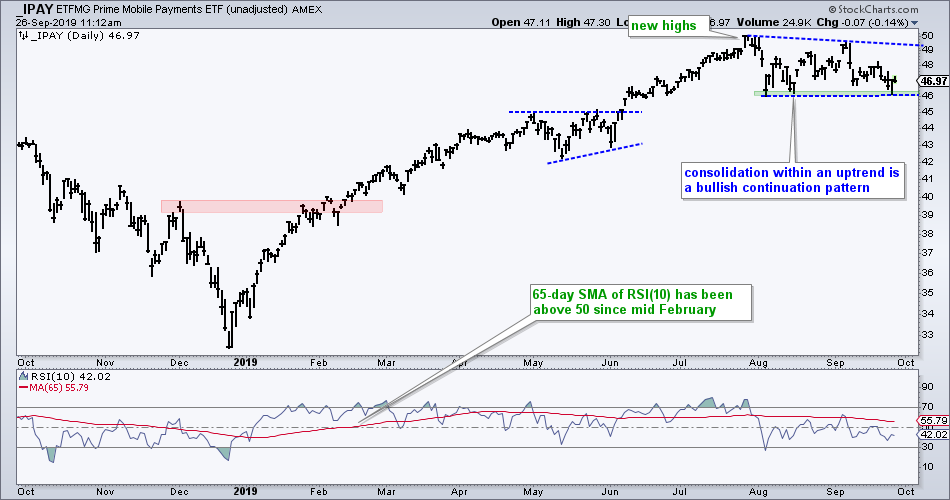
The first chart shows the Mobile Payments ETF (IPAY) hitting new highs throughout spring and summer, and then moving into a consolidation the last two months. A consolidation within an uptrend is typically a bullish continuation pattern and the ETF is testing support right now. A surge off support and breakout at 48 would provide the first sign of a bigger breakout in the 49.5 area.
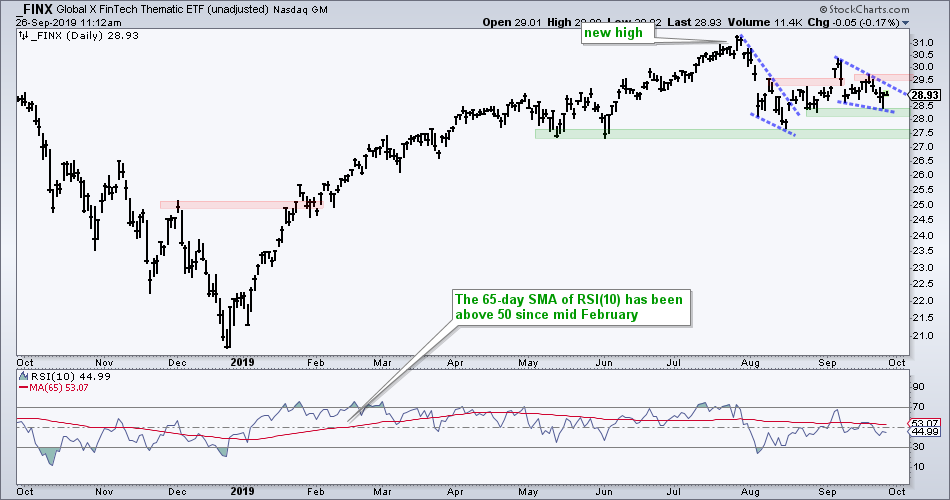
The FinTech ETF (FINX) is a little stronger than IPAY because it held above its August low. A second wedge is taking shape and a break above 29.7 would be bullish. The green zones mark first and second supports.
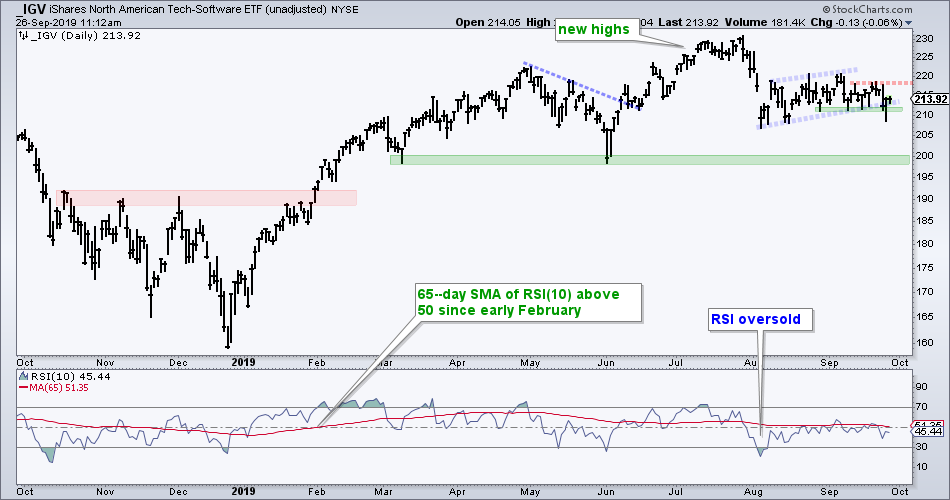
The Software ETF (IGV) remains in an uptrend overall and is testing short-term support this week. IGV was a leader in July and stumbled with the rest of the market in August. The bounce from the early August low was weak and this is a concern. A close below 210 would reverse the short-term uptrend and argue for a test of long-term support in the 198-200 area. As long as short-term support holds, chartists can watch 219 for an upside breakout.
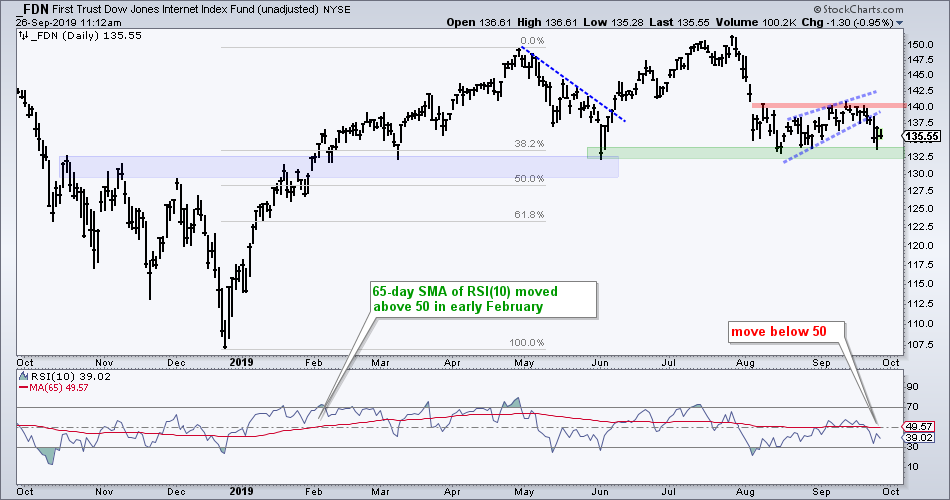
The Internet ETF (FDN) broke a wedge line over the last few days and tested support in the 132-133 area. When comparing performance to SPY, this is a mixed chart. FDN formed a higher high from April to July, but fell all the way back to its early June low in August. The bounce in August-September was not very strong and FDN broke the wedge line this week. A break above the mid September highs is needed to revive this one.
The Cyber Security ETF (HACK) looks like FDN. HACK fell back to the early June low and stalled the last seven weeks. The inability to bounce shows relative and absolute weakness, but support is still holding. The 65-day SMA of RSI(10) moved below 50 again. A breakout at 39 is needed to get this one back in bull gear.
Downtrends or Trading Ranges
MDY, IJR, IWM, XLI, XLF, KRE, KBE, REM
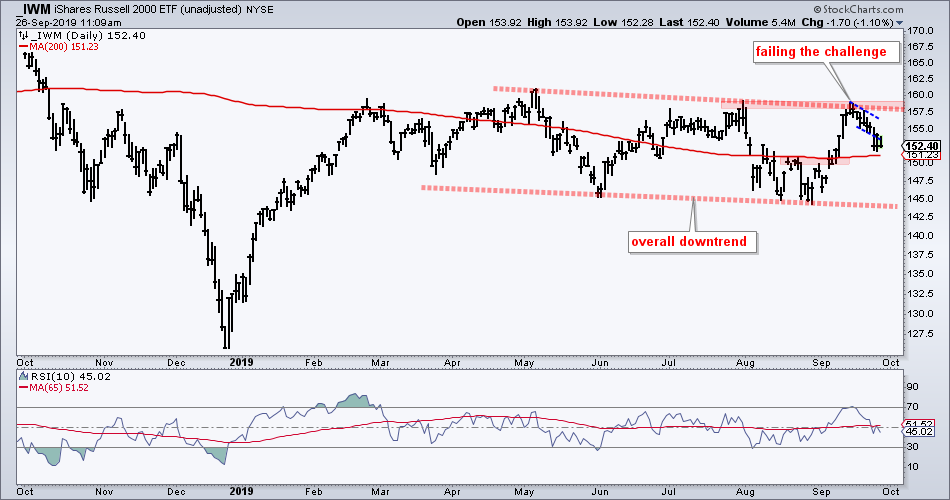
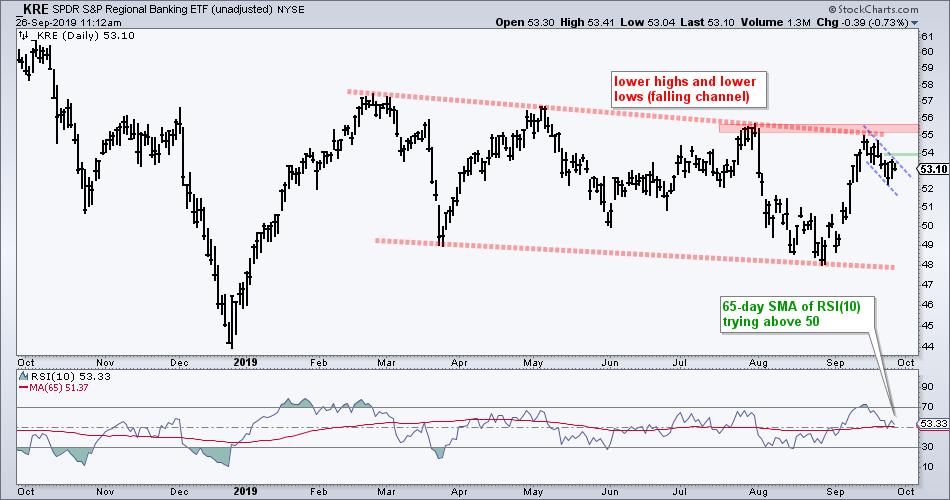
The Russell 2000 ETF (IWM) and Regional Bank ETF (KRE) are both in multi-month downtrends with recent pullbacks from resistance. It is dangerous to think bullish thoughts when the bigger trend is down. Write that on a post-it note! IWM had a bull flag working last week, but the ETF fell sharply on Tuesday and this flag is no more. The bigger downtrend is the dominant force at work here.
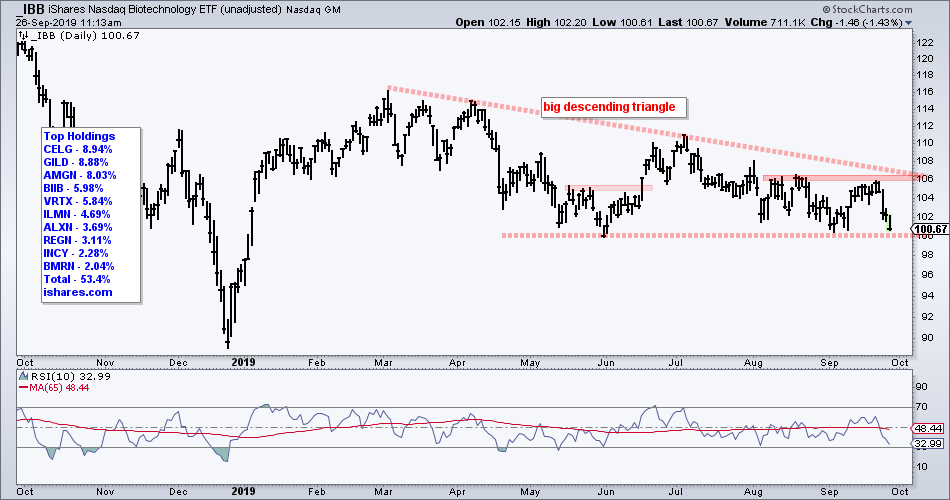
The Biotech ETF (IBB) and Biotech SPDR (XBI) went from firming at support last week to looking vulnerable this week. Forget about support and tell me what you see on the IBB chart. Objectively.
Objectively, the early July high fell WELL short of the March high (lower high). IBB was much weaker than SPY during this period. Objectively, IBB fell back to the early June low when SPY held well above this low in August. Objectively, SPY surged back to the July high in September and IBB did not even break its August high. Objectively, IBB is in a downtrend on the price chart and showing serious relative weakness.
Returning to the subjective, IBB has a large descending triangle forming. This is typically a bearish continuation pattern, but this pattern formed after the December-March advance. It could be a bearish reversal pattern of some sort now. The lower highs show weakening buying pressure on each bounce. The equal lows represent the last bastion of demand. A break below 100 would confirm the pattern and argue for a test of the December low. Ouch!