In broad terms, it is a tale of three markets. First, we have a few ETFs near new highs, in clear uptrends and leading. Second, we have ETFs that are above their 200-day SMAs with above average retracements (>61.8%). Despite relative strength, these ETFs remain below their February highs. Third, we have ETFs that are below their 200-day SMAs with below average retracements.
The chart above highlights this dichotomy. The Technology SPDR (XLK) is above its 61.8% retracement and rising 200-day SMA, while the Industrials SPDR (XLI) is below its 38.2% retracement line and well below its falling 200-day SMA. XLK accounts for 26.44% of the S&P 500 and XLI accounts for just 7.69%. XLK is more than three times the size. While relative weakness in Industrials is a concern, the S&P 500 is unphased because XLK weighs much more.
As the groupings below show, most ETFs are still in the category of normal counter-trend bounce. This means they retraced one to two thirds of the prior decline and are below their 200-day SMAs. Several others are in the category of above average bounces and one could argue that they are also in longer-term uptrends. The market is not firing on all cylinders, but a few big ones are firing bullish right now.
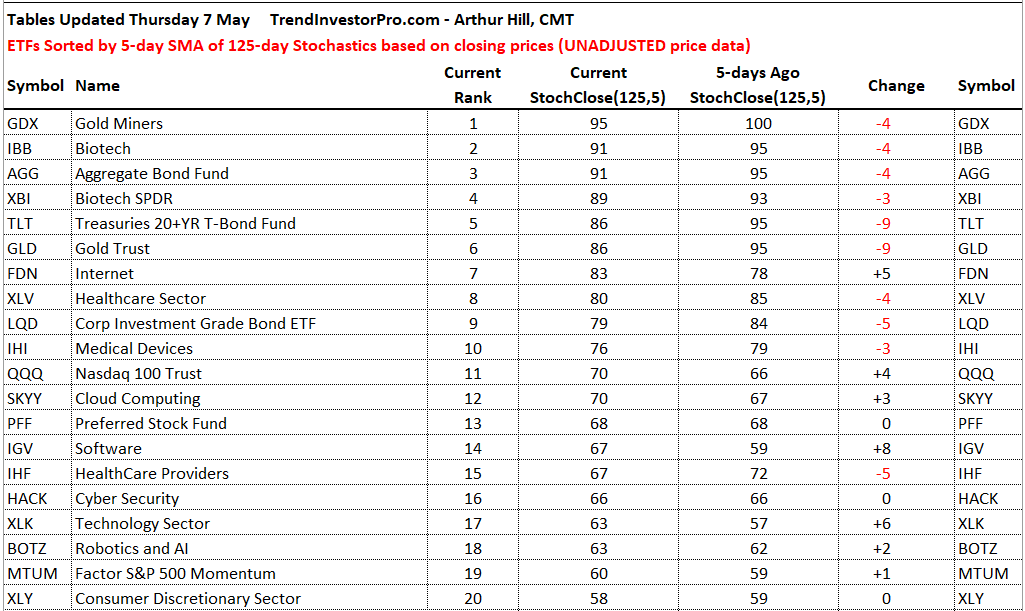
Top 20 ETFs Ranked by StochClose
We will start with an image showing the top 20 ETFs ranked by the 5-day SMA of the 125-day Stochastic based on closing prices (StochClose). Gold, bonds, healthcare and technology dominate the top 20. Bonds and gold are defensive issues that represent alternatives to stocks and currencies. Technology is the biggest sector (26.44% of S&P 500) and Healthcare is the second (15.57%). Together, these two account for over 40% of the S&P 500 and they are single handedly holding up the market.
Uptrends, Downtrends, Overbought and Oversold
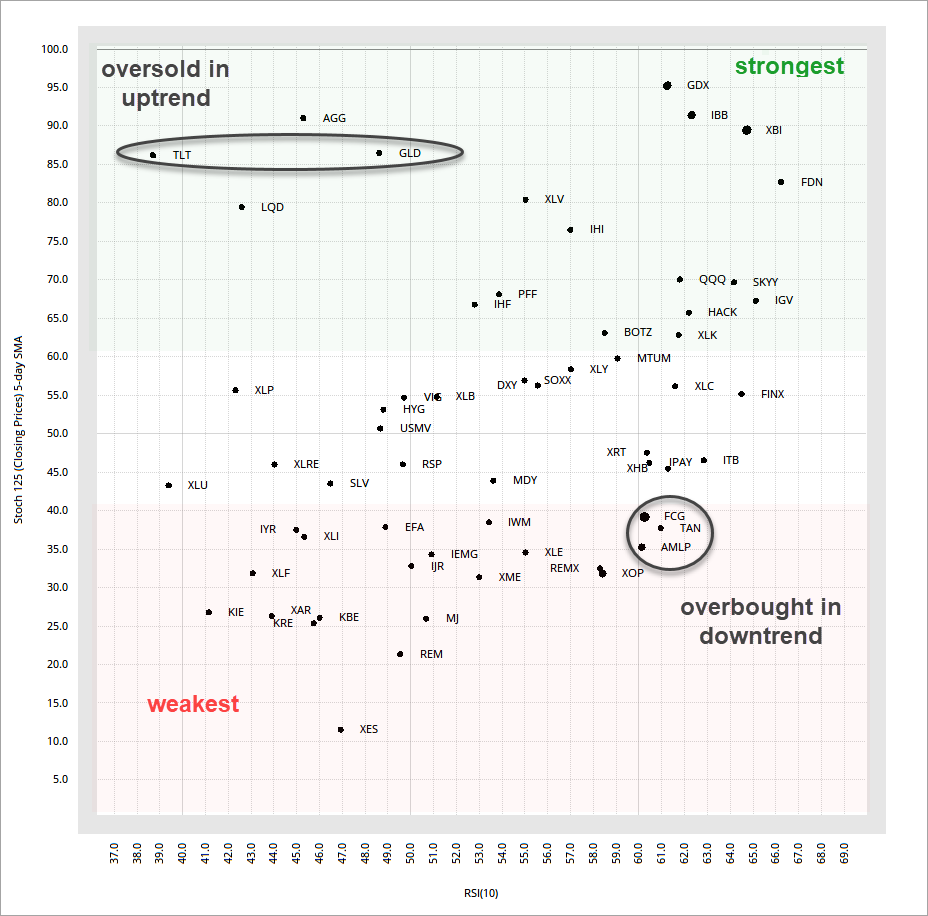
The next image is a scatter plot with StochClose on the y-axis and RSI(10) on the x-axis. Anything with StochClose above 60 is considered a leader and in an uptrend. We can see the bond ETFs, tech ETFs and healthcare ETFs dominating this group. Anything with StochClose below 40 is lagging and in a downtrend. Here we see small-caps (IWM and IJR), finance ETFs (XLF, KRE, KBE, KIE), the industrials ETFs (XLI and XAR), metals (XME and REMX) and all the energy ETFs.
RSI acts as a short-term rank and also marks ETFs that are somewhat overbought or oversold. For example, TLT is in a strong uptrend and RSI is at 38 (somewhat oversold). GLD is also in a strong uptrend and RSI is at 49. These two are in the upper left. We can also see several ETFs in downtrends (StochClose < 40) with low RSI readings (<50) in the lower left. These ETFs are lagging long-term and short-term. The ETFs in the lower right are in downtrends and somewhat overbought, which is not a good combination.
Charting Platform Update: This week’s charts are from StockCharts, but I will move to Optuma[1] charts next week. StockCharts is still a good platform, but more is needed if I want to up my game. I will still link charts to an appropriate SharpChart. There are several reasons behind the move to Optuma and these include: unadjusted data is the default, more flexibility with plot types for indicators, a broader database (FRED), scatter plots, ability to create custom breadth indicators and more.
Sector Performance Turns Mixed
The next image shows performance for the sector SPDRs over the last three weeks. XLE, XLK, XLC, XLY, XLV and XLB are leading and outperforming SPY. These six sectors and SPY are up over 2%. XLI is flat the last 15 days, XLF is down 1.5% and the other three are down more than 3%. Bonds, bond-proxies and XLP were hit over the last three weeks. Perhaps this is a sign of money moving out of safe-havens and into riskier assets. Nevertheless, the biggest concern here is relative weakness in XLI and XLF.
Leaders and Near New Highs
GDX, GLD, IBB, XBI
The Gold Miners ETF (GDX) is the only ETF in the core list to record a 52-week high this week so it gets top honors. The chart shows GDX breaking out of a flag on Monday and holding this breakout for the most part.
The next chart shows the Gold SPDR (GLD) hitting a new high in April and forming a pennant, which is a bullish continuation pattern. RSI is in the 40-50 zone and this represents a mild oversold condition. GLD is setting up bullish here.
Leading and Pulling Back
TLT, AGG
The 20+ Yr Treasury Bond ETF (TLT) and Aggregate Bond ETF (AGG) are considered leaders because they are above their rising 200-day SMAs. Note that some 40% of bonds in AGG are US Treasuries. TLT fell the last two weeks and plunged 1.61% on Wednesday. The ETF is mildly oversold as RSI dipped to 39 and could be setting up for an oversold bounce.
The next group of ETFs are dominated by Technology and Healthcare. These ETFs are in strong uptrends since mid March because they exceeded their 61.8% retracements and all but one (BOTZ) are above their 200-day SMAs. Despite huge moves the last seven weeks, none of these ETFs recorded a 52-week high in April or May.
The chart below shows QQQ moving above 210 on April 14th and then working its way higher with choppy price action. There were two 3+ percent declines the last three weeks, but the ETF immediately recovered after each decline and pushed higher. The immediate trend is up with price support marked at 210 and momentum (RSI) support marked at 50. The rest in this group will follow QQQ so watch the big Q’s for clues.
Above 61.8%, but Below 200-day
PFF, LQD
The Corporate Bond ETF (LQD) is in a strange situation on the chart and with the Fed. LQD surged back above the 200-day in April and then fell back the last few weeks as money moved out of corporate bonds. The ETF is now mildly oversold with RSI in the 40-50 zone. This is setting up for a possible mean-reversion bounce.
Above 50% Retracement
SPY, XLY, XLC, XLP, XLB, FINX, SOXX, VIG, HYG
The S&P 500 SPDR is still in the group with normal, but above average, retracements. These ETFs, except for SOXX, are below their 200-day SMAs as well. SPY retraced between one half and two thirds of the prior decline (similar to 38.2-61.8 percent). The advance slowed the last three weeks, but the trajectory is still up with this week’s low marking support at 280. RSI is bullish as long as it holds above 50 and SPX 20-day High-Low% is bullish until it breaks below -10%.
The Semiconductor ETF (SOXX) was leading the market a week ago, but fell sharply on Thursday-Friday and rebounded the last three days. The rebound provides a reaction low upon which to base first support. A price break below 220 and an RSI break below its prior lows would reverse the short-term uptrend. I left the rising wedge trendlines, but these are quite steep and subjective. They are just there to highlight the pattern and should not be considered KEY levels.
The next group of ETFs are above their 38% retracements now, but below their 50% retracements. In price action terms, they are not as strong as the ETFs in the above group. The first chart shows IWM surging above its 50% retracement with a pennant breakout last week and falling back sharply on Thursday-Friday. Perhaps this is a throwback to the breakout zone, which is holding for the most part. This week’s bounce established a short-term support zone to watch going forward. The immediate trend is up as long as IWM holds 122.
The Home Construction ETF (ITB) is closer to its 50% retracement and a little stronger than IWM. Drawing trendlines is a challenge, but there is also a possible rising wedge when using an internal trendline that cuts through the early April low. Regardless of the trendline, the 28-Apr gap and Monday low mark the first support zone. The trend is up until a break below 34.
Below 38.2% Retracement
IJR, XLE, MJ, FCG, XES, XOP, AMLP, XME, IEMG, EFA
The next group of ETFs are well below their falling 200-day SMAs and in clear downtrends. They bounced to varying degrees the last seven weeks, but their retracements were on the low end and they are all below the 38.2% retracement line now. The first chart shows the Metals & Mining SPDR (XME) with a breakdown decline in February-March and a rising wedge advance in March-May. XME popped with a surge above 20 and fell back the last four days. A pullback after such a pop is normal and this puts the ETF at a make or break level (support). The trend is up with support marked at 18.50 and we could see a bounce here.
Shallow Retracement and Weakness
XLF, XLI, IYR, KBE, KRE, KIE, REM, XAR
The bottom group is dominated by ETFs from the Finance and Industrials sectors. The first chart shows the Regional Bank ETF (KRE) surging to 40 last week and quickly falling back below 35 this week. This is basically a 20% surge and a 14% drop. I normally do not get this granular, but notice that KRE is right at the March trendline and 61.8% retracement. And, RSI is in the 40-50 zone. Even though it is one of the weakest ETFs, it is mildly oversold and in position for a possible bounce.
The next chart shows the Aerospace & Defense ETF (XAR) with one of the weakest bounces as it barely exceeded the 38% retracement. The ETF broke out of a pennant last week and gave it all back this week. Despite being one of the weakest, the ETF is at support and RSI is in the 40-50 zone. This may give way to a bounce.