Several key ETFs broke down last week and then recovered with big gap-surges on Monday. SPY was also seemingly on the verge of a breakdown, but snapped back with a gap and flag breakout. Today’s charts are littered with gaps and flag/pennant breakouts so we will focus on these. Even though SPY remains in a precarious spot (61.8% retracement and below 200-day), the flag breakouts keep the immediate uptrend alive and remain bullish until proven otherwise.
Plotting Strength and Weakness
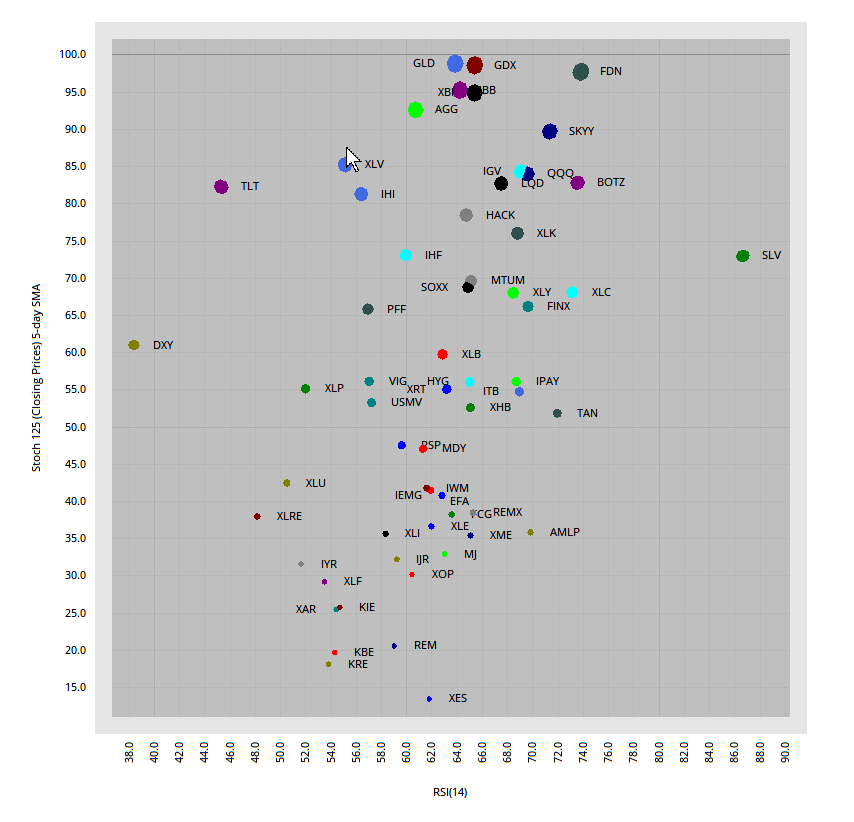
The scatter plot shows the 60 core ETFs with StochClose on the y-axis and RSI on the x-axis. ETFs with a StochClose above 60 are in uptrends and ETFs at the top are leading (GLD, GDX, FDN). The size of the dot relates to the StochClose values (bigger dots have higher values and smaller dots have lower values). Bonds and gold are also in the top half and leading.
The stock-related universe remains mixed. StochClose is above 60 for XLK (Technology), XLV (Healthcare) and several related ETFs. These are the equity ETF leaders with uptrends. On the flip side, StochClose is below 40 for several key groups, including the XLI (Industrials), XLF (Finance), KRE (banks), IJR (small-caps), Defense (XAR) and REITs (XLRE).
The 20+ Yr Treasury Bond ETF (TLT) and Silver ETF (SLV) are the two outliers. TLT is in an uptrend and RSI is mildly oversold (40-50 zone). SLV moved into an uptrend this week as StochClose exceeded 60, but RSI is short-term overbought (>80). Elsewhere, note that RSI(14) is above 70 for FDN, SKYY, XLC and BOTZ.
ETFs Ranked by StochClose
The image below shows the top 26 ETFs (ranked by StochClose). Gold, biotech, bonds and tech dominate the top 20. I chose 26 because SPY is number 26 and its StochClose value is at 59, which is just below the bullish threshold. A move above 60 would turn SPY bullish for the first time since late February.
SPY and the Flag Breakout
The next chart shows SPY with RSI and StochRSI. All eyes are on the flag breakouts seen on many ETFs, including SPY. SPY surged some 30% from March 23rd to April 29th and then consolidated for 12 days to form the flag. It looked like SPY was breaking down last week after a bearish engulfing below the 200-day SMA, but the ETF stabilized on Thursday-Friday and gapped higher on Monday. This gap-surge triggered a flag breakout.
The trend since the late March surge is up and the gap is holding. Thus, short-term price action is bullish. A close below 285 would fill the gap and throw cold water on the breakout. The low line of the flag is at 279 and a close below this level would break flag support. Indicator-wise, RSI is above 50 and bullish, while StochRSI surged above .80 for a momentum upthrust.
Flags and pennants are tricky, even in a “normal” market environment. Moreover, the current environment seems to favor mean-reversion trading over breakout trading. Mean-reversion trading involves buying the dips and selling the bounces. Breakout trading, on the other hand, involves buying the breakout and selling the breakdown. Mean-reversion strategies perform better in choppy markets, while breakout strategies perform better in trending markets.
At or Near New High and Leading
FDN, IBB, XBI, GDX, GLD
Powered by Amazon, Facebook and Netflix, the Internet ETF (FDN) is leading the market with a new high on Wednesday. The Biotech ETF (IBB) and Biotech SPDR (XBI) are also leading with new highs. There are no patterns at work in these three. They sport market leading uptrends and are quite extended after huge advances since March 23rd (37-52%). Last week’s lows mark first support, a break of which would signal the start of a pullback.
The Gold SPDR (GLD) and Gold Miners ETF (GDX) are also leading with new highs. GLD became mildly oversold in early May as a pennant formed. The ETF broke out of the pennant last week and forged a new high this week.
The next group of ETFs are leading as they forged new highs for the current advance, but remain short of 52-week highs. Note that these ETFs did not form flags in early May. Instead, they continued higher and continued to lead. QQQ, XLK and several tech-related ETFs feature in this leading group. The charts below show XLK and IGV with pullbacks last week and bounces this week. These bounces forged lows that mark first support. As with IBB above, RSI(14) has been above 50 since the second week of April and remains bullish. Look for a close below 50 to signal a downturn in momentum.
Above 200-day and Flag/Pennant Breakout
XLY, SOXX, IHF, AGG, LQD
Now we get to the flags with the next group. The first chart shows the Semiconductor ETF (SOXX) forming a pennant above the 200-day SMA and breaking out with a surge the last three days. As with many of these flag/pennant breakouts, the gap zone is the first area to watch for signs of weakness. A strong gap and breakout should hold and prices should continue higher. Failure to continue higher and a move below the gap zone would be negative. The May lows mark support based on demand points and a break here would signal a victory for supply.
In an interesting twist, the Aggregate Bond ETF (AGG) and Corporate Bond ETF (LQD) snuck into this group with flag breakouts. I guess Fed buying is helping. The chart below shows AGG pulling back last week and RSI hitting the mildly oversold zone (40-50). The ETF broke out of a small bull flag and RSI popped back above 50.
Above 200-day, but below Feb High
XLV, HACK, IHI, TLT
Some ETFs are leading and in uptrends, but they did not break out of their flag consolidations or did not forge a higher high this week. The first chart shows XLV with a pennant forming above the 200-day SMA. XLV attempted a breakout on Monday, but fell back into the pennant formation. Overall, XLV remains bullish as long as the pennant lows hold and RSI holds above 50. Notice how RSI has held above 50 since early April. This shows steady and bullish momentum.
The 20+ Yr Treasury Bond ETF (TLT) features in this group with a most irregular flag. I am not looking for picture perfect patterns. Instead, I am looking for patterns that capture the essence of the pattern. A bullish flag/pennant is a consolidation that forms after a sharp move higher. TLT surged from 140 to 170 and then consolidated so it fits the bill. The ETF attempted to turn up last week, but fell back on Monday as stocks surged. This week’s high established first resistance and a breakout here would be bullish. Also note that RSI is in the 40-50 zone, which is mildly oversold.
Below 200-day and Flag Breakout (or higher high)
SPY, XLB, ITB, XHB, XRT, VIG, HYG
The next group of ETFs sport flag breakouts, but they are still below their 200-day SMAs. The chart below shows the Home Construction ETF (ITB) with an uptrend since the late March surge and a higher high this week. Even though the rising wedge and 61.8% retracement level look ominous, the trend is up as long as the wedge rises. The gap zone marks first support and the mid May lows marks second support. A filling of the gap would be negative and a support break would fully reverse the upswing.
The High-Yield Bond ETF (HYG) also fits in this group with a breakout over the last three days. Again, I do not see a clear flag or pennant, but I do see a surge from March 23rd to April 9th and a pullback into mid May. A falling wedge of sorts formed and HYG clearly broke out with the move above the early May highs. This means junk bond yields fell and this is positive for the credit markets (and stocks). The gap zone and May lows are close together so I elected to mark support with the recent lows. A break here would be bearish.
Well Below 200-day and Flag Breakout
RSP, MDY, IJR, IWM, XLE, FCG
The next group of ETFs are lagging because they are below their 200-day SMAs and they did not exceed their 61.8% retracement lines. Nevertheless, they formed falling flags in May and broke out with surges the last three days. The gap zones mark first support to watch going forward. The first chart shows the S&P 500 EW ETF (RSP) breaking out and gap support at 92.
The second chart shows IWM with a rising wedge and apparent breakdown last week. This breakdown did not last long as the ETF firmed on Thursday-Friday and surged on Monday. It now looks like the bull flag breakout has overpowered the falling wedge break, for now at least. The last signal dominates and I am marking gap support at 125.
Well below 200-day and Flag without Breakout
USMV, XLP, XLU, XLRE, KIE, PFF
The next group of ETFs led the market from March 23rd until mid April and then turned lower. This group features some of the defensive names, such as XLP, XLU and XLRE. Money moved into some offensive names (tech-related ETFs) at the expense of these defensive names. The first chart shows the Consumer Staples SPDR (XLP) with a surge to the 200-day on April 17th and a decline the last four weeks. This decline looks like a bullish correction (falling wedge and 38% retracement). XLP attempted to break out on Monday, but fell back on Tuesday. Watch for follow through above 59 to secure a breakout. The second chart shows XLU with resistance near 58.
Weak Bounce Overall and Flag Breakout (or higher high)
The next group of ETFs are lagging overall because their bounces were below average and they remain WELL below their falling 200-day SMAs. The Industrials SPDR (XLI), Finance SPDR (XLF) and related industry group ETFs feature in this group. Today’s charts show RSI(14) and we can compare performance with this indicator. The XLV chart at the beginning showed RSI holding above 50 since April 6th. RSI for XLF and XLI, in contrast, has been above and below 50 several times since early April. XLV shows steady positive momentum, while XLI and XLF show erratic and weak momentum (meandering RSI).
The charts show gaps and flag breakouts that are bullish until proven otherwise. XLI broke above its early May high, but XLF has yet to take out this high and is lagging. Nevertheless, the gaps are holding and remain positive as long as they do. A close below the gap zone would negate these breakouts and put the rising wedges back in play.