After some volatility and big moves in March, April and May, trading has turned downright boring the last few weeks. Nevertheless, the majority of breakouts are holding and there are plenty of leaders. Tech, housing, retail, precious metals and Healthcare continue to lead. ETFs related to Finance and Energy continue to lag. Industrials and small-caps perked up this week and extended on their breakouts, which were looking rather feeble just last week.
ETF Ranking Table and Scatter Plot
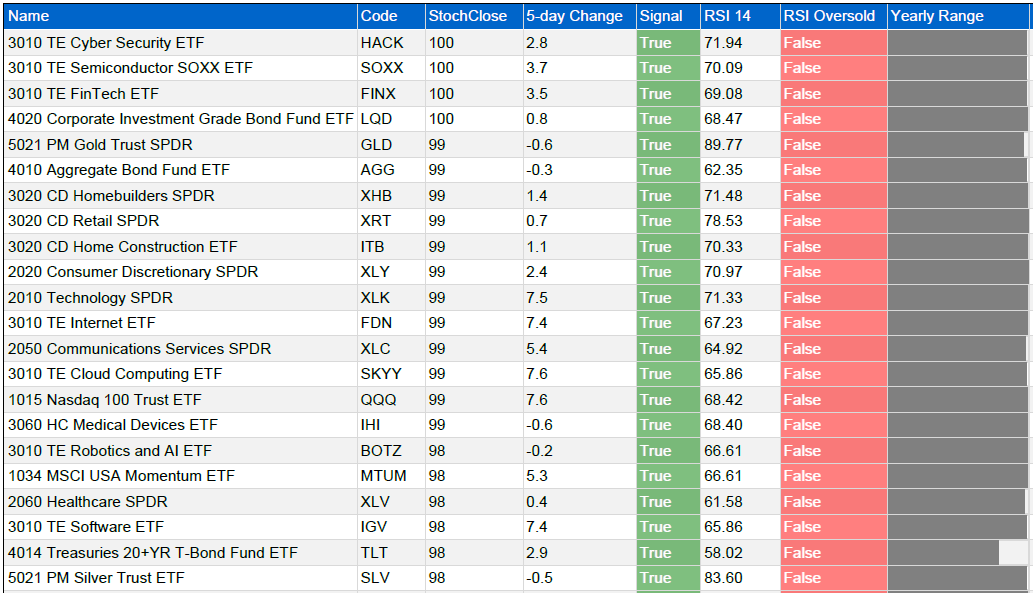
There is a new ranking table in town. I put the powers of Optuma to work and created a ranking table with the active StochClose signals. The columns on the table below and in the Ranking Table PDF above are as follows:
Name, which includes prefix for sorting
Code is the symbol
StochClose is the rounded value for StochClose (125,5)
5-day change is the absolute change in StochClose
Signal is the active signal, true for bullish and false for bearish
RSI 14 is the value for 14-day RSI
RSI Oversold shows green when RSI is between 30 and 50
Yearly Range shows current price level relative to 52-week range
The 22 ETFs in the screen shot below are in strong uptrends with StochClose values at 98 or higher. ETFs related to Technology, bonds, Consumer Discretionary, Healthcare and precious metals feature in this group. Notice that the Home Construction ETF (ITB), Retail SPDR (XRT) and Consumer Discretionary SPDR (XLY) are in the top ten. It seems that this sector can already taste the next stimulus check, which is in the proverbial mail.
See this article[1] to learn more about the StochClose indicator.
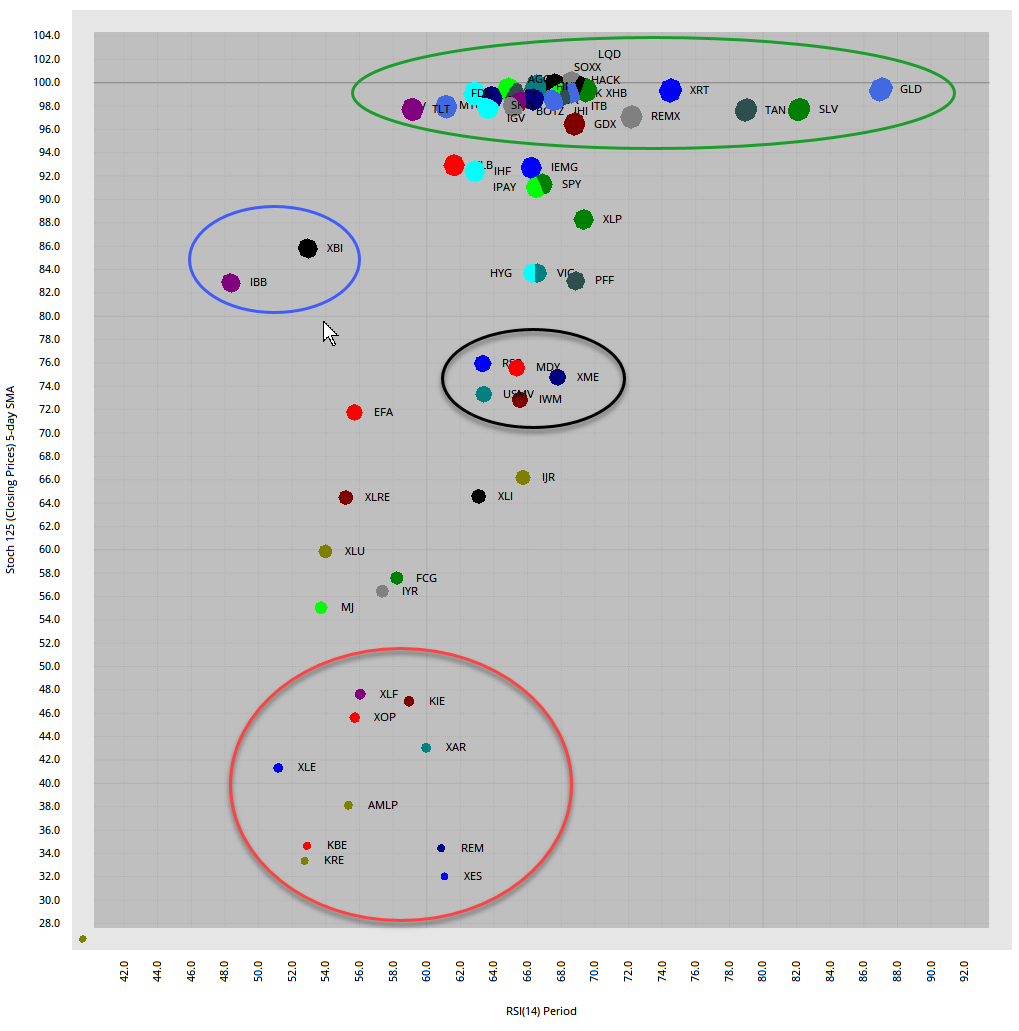
The next image is a scatter plot for the 60 core ETFs. StochClose (125,5) is on the y-axis and RSI(14) is on the x-axis. There is a big cluster above 95 (green oval) and these are the leaders, which are in the table above. IBB and XBI are still at interesting junctures because they are in the upper left. This means StochClose is strong (uptrend) and RSI is mildly oversold (~50). The black oval in the middle shows up and coming ETFs (RSP, MDY, IWM, XME). ETFs in the red oval are the laggards. Most of these are tied to the Finance and Energy sectors.
Changing of the Charts
Today’s charts look a little different because they were created in Optuma. Bear with me please. StockCharts is a fine charting platform, but falls short for my needs in a few areas. First, the default for data is to adjust for dividends and my preference is to not adjust for dividends[2]. Second, I have much more flexibility with the charts. I can create a custom indicator (StochClose) and I can control the scale range for RSI. Third, I can create tables, scatter plots and more using my core ETF list.
The charts are linked to an equivalent StockCharts chart.
Today’s ChartBook is also different because the ETFs are sorted and arranged according to their groupings. This is what I originally had in mind when I launched TrendInvestorPro, but did not have the tools to make this happen in a workable manner. Optuma makes it easy to sort and publish a chart list.
Consolidation Breakout and Big Surge
GLD, SLV, TAN, REMX
ETFs in the first group hit new highs with some serious surges. The first chart shows the Gold SPDR (GLD) with StochClose triggering bullish on March 26th and staying bullish. GLD bounced off support in early June, broke out in mid June and broke out of a smaller consolidation on July 20th. All told, the ETF is up over 20% since June 5th. The trend is up and strong, but GLD is quite extended as RSI(14) reached 87.
The next chart shows the Silver ETF (SLV) with a short-term breakout just before turning long-term bullish in mid May, which is when StochClose moved above 60 and SLV exceeded the 200-day. The ETF consolidated above the 200-day in June and broke out on June 30th. Silver is acting like gold on steroids with a 60% advance since mid June. It is also quite extended and ripe for a rest.
The next group is the biggest group with 12 ETFs and 11 hit new highs this past week. The 20+ Yr Treasury Bond ETF (TLT) did not hit a new high, but I am lumping it in this group because of the June breakout and continued strength. On the price chart, StochClose turned bullish in January and stayed bullish throughout the March madness. TLT then corrected into early June with a 50-67% retracement and broke out after a 4-day reversal. TLT remains strong and is very close to its April high, despite continued strength in stocks. Hmm….
This group includes a few tech-related names (HACK, SOXX, FINX), some consumer discretionary names (XRT, ITB, XHB), the Gold Miners ETF (GDX) and the Aggregate Bond ETF (AGG). What a motley crew. The first chart shows SOXX breaking out in early July and working its way to new highs the last few weeks. The green arrows mark the breakouts and the most recent breakout zone turns first support.
The charts for XRT, XHB and ITB look exactly the same. All three surged from late March to late May and then consolidated into June with triangle patterns. RSI(14) stabilized in the 40-50 zone as the ETFs consolidated. All three broke out of these patterns in early July and moved to new highs. In fact, all three are up 20+ percent since late June and getting extended. The signals worked great, but now is time to monitor price action and/or wait for the next setup.
Traders interested in trailing stops might consider the Chandelier Exit (20,2) for ITB and XRT. This is a trailing stop placed 3 ATR(20) values below the 20-day high. The stop rises as long as prices rise and triggers when prices fall by a certain threshold. The next chart shows GDX with a breakout and extension higher the last six weeks. This chart shows Chandelier Exit (20,3) because GDX is more volatile.
QQQ, XLK, XLC, SKYY, FDN, IGV, LQD
Consolidation Breakout this Week and New High
ETFs in this next group also recorded new highs, but did so with breakouts this week. They basically raced to new highs, consolidated for two to three weeks and broke out with surges the last four to five days. While a consolidation breakout is bullish, I have my reservations because these breakouts are occurring after big runs from late March to early July. One never knows how long or far a run will extend, but we have yet to see a “normal” pullback (25 to 50 percent retracement) and the odds of a failed breakout and corrective period are above average. Note that this is a subjective assessment. Objectively, the trends are up and the breakouts are bullish until proven otherwise. The breakout zone is the first level to watch for a breakout failure. The July lows mark key support, a break of which could herald a corrective period.
The first chart shows QQQ with a 60+ percent advance off the March low. QQQ was one of the first ETFs with a bullish StochClose signal (April 16) and one of the first to record a new high. It is still a leader and still in an uptrend, but also still quite frothy. The breakout is valid as long as 264 holds. Key support is set at 250.
The next chart shows the Software ETF (IGV) with a breakout, just barely. The breakout is holding as long as 295 holds. Key support is set at 277.
Consolidation or Pullback after New High
MTUM, XLV, IBB, XBI
The next charts are in the midst of short-term pullbacks (IBB, XBI) or short-term consolidations (MTUM, XLV). All four recorded new highs in July and are part of the leadership group. The first charts shows the Healthcare SPDR (XLV) moving above its 200-day in mid April and StochClose exceeding 60. XLV then consolidated for around two months, broke out in June (green arrow) and surged to a new high. The ETF stalled the last 2-3 weeks with a falling flag of sorts and a breakout would keep the upswing going. A pullback is also possible, but I would view a pullback that pushes RSI into the 40-50 zone as a potential opportunity.
The next chart shows the Biotech ETF (IBB) with a throwback and mean-reversion setup. First, IBB broke out in mid June and moved to new highs. The ETF then fell back to the breakout zone and this is known as a throwback. Classical technical analysis suggests that broken resistance turns into support, but this is largely a subjective assessment. Take it with a grain of salt and test for yourself. The throwback formed a small falling wedge and pushed RSI into the 40-50 zone, which marks a mild oversold condition. IBB perked up on Monday with a wedge breakout.
Consolidation Breakout in July and above June High
ETFs in this next group advanced from late March to late May, consolidated into June and broke out in early-mid July. These were the bullish signals and we are now in the monitoring phase. Price extended after the breakout as these ETFs exceeded their June highs. However, they remain short of 52-week highs and are lagging ETFs that already recorded 52-week highs.
The first chart shows SPY with a pennant in June and breakout in early July. Prices worked their way higher after the breakout with SPY hitting a new high for the move on Wednesday. The thin blue line is the Chandelier Exit (20,2), which can be used as a stop-loss for those interested in trailing a stop. This does not always work as good as the textbook examples. Note the flag breakout on May 18th and sharp decline below the Chandelier Exit on June 11th. Much of the gains were lost with this gap down. Personally, I prefer profit targets over trailing stops.
Small-caps perked up this week with the Russell 2000 ETF (IWM) gaining 4.6% in three days (vs 1.7% for SPY). Prior to this week’s move, IWM was dragging its feet and stalling just above the breakout zone. Overall, IWM consolidated in June and the Bollinger Bands narrowed with a squeeze. IWM broke above the upper band and this breakout is holding. The breakout zone marks first support to watch for a failed breakout. The June lows mark key support.
The next chart shows the Mobile Payments ETF (IPAY) with a breakout, stagger higher and pop over the last four days.
Consolidation Breakout and below June High
RSP, MDY, IJR, USMV, XLI, EFA
ETFs in this next group also have bullish breakouts working in early-mid July, but they are lagging because they have yet to exceed their June high. Nevertheless, the breakouts are still bullish and they are still holding. Failure to hold the breakout zones would signal a failed breakout. The June lows mark key support for the medium-term uptrend.
The first chart shows the S&P 500 EW ETF (RSP) with a breakout on July 15th and modest follow through the last few weeks. A move below 103 would negate the breakout and a close below the June lows would reverse the uptrend.
The Industrials SPDR (XLIalso caught a good bid the last few days and closed above its 200-day for the first time since early June. Overall, XLI formed a falling wedge as the Bollinger Bands narrowed and broke out on July 15th. Follow through has been modest, but the breakout is holding with first support set at 69. The June lows mark key support at 65.
Consolidation Breakout, Below June High, Stalling
XLU, XLRE, IYR
The bond alternative ETFs (high yielding) are lagging to a degree because they have yet to break their June highs. The Real Estate SPDR (XLRE) and REIT ETF (IYR) have Bollinger Band squeezes and breakouts working, but chartists should watch support closely. A move below the July lows would negate the breakouts and put the bears back in control.
XLU is a tough call because it is below its falling 200-day and below its June high. The swing since early July is up and the ETF is consolidating with a small pennant. A close below 58 would reverse this upswing and signal a failure at the 200-day. A break above the 200-day would be bullish and keep the upswing alive.
Below 200-day, but Holding Short-term Breakout
XLF, KBE, KRE, REM, KIE, XES, FCG, XAR
ETFs in this next group sport short-term breakouts, but their long-term trends remain down and they are lagging overall. Long-term downtrends and relative weakness suggest caution going forward. The first chart shows the Finance SPDR (XLF) failing at its falling 200-day in early June, falling below 23 into early July and breaking out of a falling wedge in mid July. There were lots of breakouts in mid July and this is one of the weakest follow through moves. In fact, XLF has simply stalled since the breakout. Despite uninspiring price action, the breakout is holding and bullish until proven otherwise. A move below 23 would negate the breakout and be bearish.
The Regional Bank ETF (KRE) is even further below its falling 200-day SMA and weaker overall. The ETF broke out of a small falling wedge and then fell back the last two weeks (falling flag). A breakout at 39 would keep the short-term upswing alive. A close below 36 would signal a failure and be bearish.
The Oil & Gas Equipment & Services ETF (XES) is one of the leading gainers this week with a 10+ percent move in three days. I missed this move, but I am not bothered because XES is seriously lagging and well below its falling 200-day SMA. There are stronger charts out there and I am not a bottom picker.
Below 200-day and Consolidating
XLE, XOP, AMLP, MJ
ETFs in this last group are the weakest because they did not break short-term resistance. There are also in long-term downtrends. The chart below shows the Energy SPDR (XLE) breaking above the upper line of a falling wedge and then moving sideways. The ETF did not exceed the resistance zone and forge a short-term higher high.