The next report will be on Wednesday, February 12th.
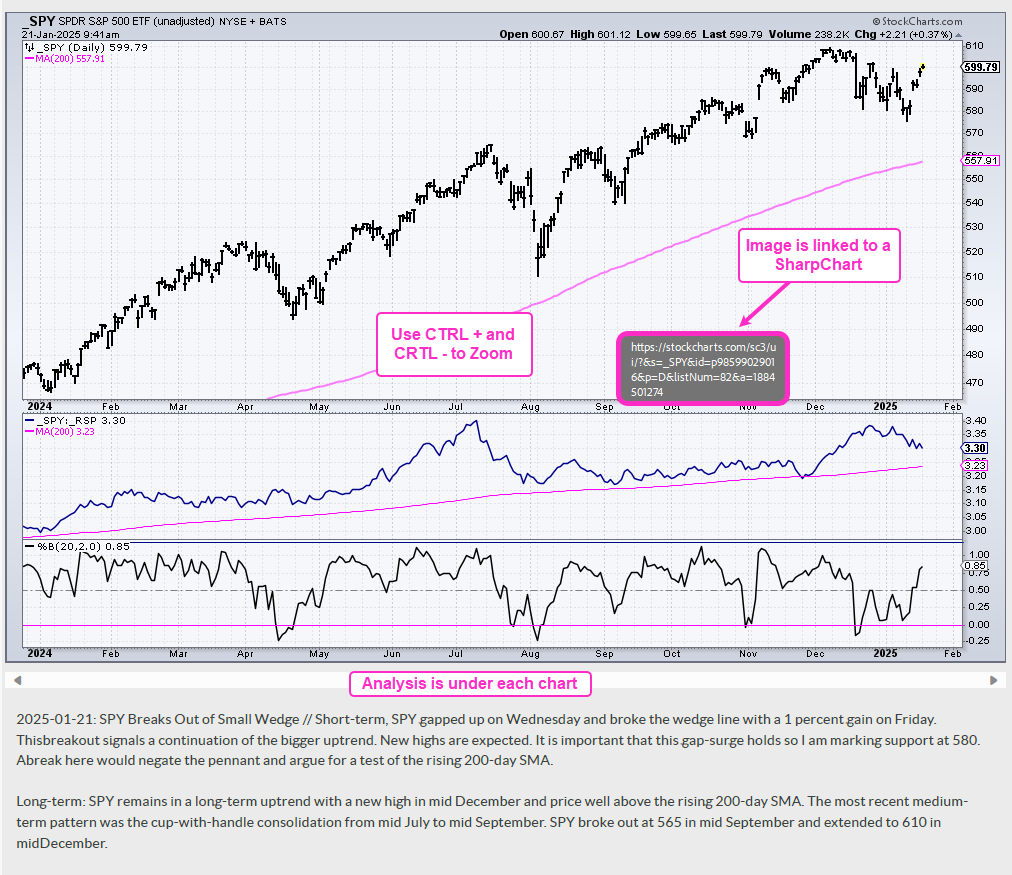
The weight of the evidence remains bullish for stocks (bull market). Large-caps (SPY, QQQ) are leading equal-weights, mid-caps and small-caps (RSP, MDY, IWM). QQQ is leading SPY because the former recorded a fresh 52-wk high last week. SPY is not far behind as a bullish cup-with-handle forms and the ETF challenges rim resistance. The S&P 500 EW ETF (RSP) formed a small consolidation above its breakout zone and a breakout would be positive for the broader market (small-caps and mid-caps)..
Several tech-related ETFs are leading the market. In particular, the Global AI & Tech ETF (AIQ), Cloud Computing ETF (SKYY), Cybersecurity ETF (CIBR), Communication Services SPDR (XLC), ARK Innovation ETF (ARKK) and ARK Fintech Innovation ETF (ARKF) hit new highs this month. The Mag7 ETF (MAGS) is lagging short-term, but leading long-term and forming a bullish triangle pattern. I am also seeing bullish setups in two blockchain ETFs (BLOK, DAPP).
The Industrials SPDR (XLI) fell back the last few weeks, but this decline looks like a bull flag and the ETF is attempting a breakout. Within the sector, I am seeing a bull flag in the Aerospace & Defense ETF (ITA) and an oversold condition in the Aerospace & Defense ETF (XAR). The two infrastructure ETFs are closely tied to the industrial sector and they have short-term bullish pullbacks working.
The Gold SPDR (GLD) continues to lead the market with a 10% gain year-to-date. GLD seems short-term overbought, but there is nothing we can do with this condition. The Bitcoin ETF (IBIT) is setting up with a triangle consolidation and I am watching the downswing within this pattern for the early signal.
- SPY Challenges Rim Resistance of Bullish Cup-with-handle
- QQQ Extends on Breakout and Hits New High
- S&P 500 EW ETF Forms Bullish Pennant after Breakout Surge
- S&P MidCap 400 SPDR Tests Wedge Breakout Zone with Smaller Wedge
- IJR and IWM Consolidate Around Breakout Zone
- Industrials SPDR Attempts Short-term Breakout after Pullback
- Utilities SPDR Holds Wedge Breakout and Establishes Support
- Mag7 ETF Consolidates within Long-term Uptrend
- Cloud ETF Forms Bullish Pennant Near 52-wk high
- Transformational Data ETF Holds Channel Breakout
- Digital Transformation ETF hits Bullish Setup Zone with Falling Wedge
- ITA Aerospace & Defense ETF Forms Bull Flag after New High
- XAR Aerospace & Defense ETF Falls back to Triangle Breakout Zone
- Infrastructure ETFs Break Out of Small Wedges
- Gold SPDR Hits New High to Extend Lead
- Bitcoin ETF Forms Bullish Triangle within Uptrend
If viewing the PDF in a browser, right click on charts to open in a new tab or window.
Use CRTL and the Plus or Minus keys (+ -) to zoom. 125% works best for me.
Send feedback to support(at)trendinvestorpro.com or use the contact form. [2]
Working with PDF Files
PDF reports based on ChartLists from StockCharts.com offer several advantages. First, each chart is linked to a live SharpChart, allowing readers to see open it, see the most recent price data and view the chart settings. Second, publishing reports as PDF files is much more efficient because it eliminates the need to copy/paste each chart and its corresponding analysis to a webpage. This allows more time for updates and analysis. Third, these comprehensive PDF reports allow users to see my ETF ChartList, Market Regime ChartList and Stock Setup ChartList.
There are three ways to open a PDF file. First, just click on the file link and it should automatically open in your browser. Most browsers can read PDF files without a plugin. Second, you can install the Adobe Acrobat plugin for your browser (Chrome, Firefox, Edge, Safari). I am running a Windows PC and the Acrobat plugin works great using Edge. This my preferred option. Third, you can download the PDF file to your computer and open it in Adobe Acrobat or your default app for PDF files.
The charts in this PDF report are linked to a SharpChart. If viewing through a browser or the Acrobat plugin, right click on the image to open the SharpChart in a new tab or window. If viewing in Adobe Acrobat outside of your browser, click on image to open the SharpChart in browser.
Users can easily control the zoom using CRTL + and CRLT – (plus/minus keys). Press and hold the CRTL key and then press the + key to zoom in (increase the magnification). Press and hold the CRTL key and press the – key to zoom out. 125% zoom works best for me. See comments section below for links.
The example below is a screen shot from the PDF.
Send feedback to support(at)trendinvestorpro.com or use the contact form. [2]