The next report will be on Tuesday, February 11th.
Biotechs are making a move so we start with analysis of three biotech ETFs. IBB was the first to break out. This week we are seeing catch-up breakouts in XBI and ARKG. We first featured IBB on January 23rd as a bullish wedge took shape. Attention then turns to two biotech stocks with long-term uptrends and bullish setups. This report closes with an old school industrial stock that is retesting its Bullish Setup Zone.
– IBB Extends on Wedge Breakout
– XBI Breaks Out of Wedge and Exceeds January High
– ARKG Breaks Out of Long Consolidation
– BNTX Holds Breakout Zone and Leads
– JAZZ Consolidates with Bullish Triangle
– FAST Sets up with Second Test of Bullish Setup Zone
– AAPL Holds Support with Short-term Breakout
If viewing the PDF in a browser, right click on charts to open in a new tab or window.
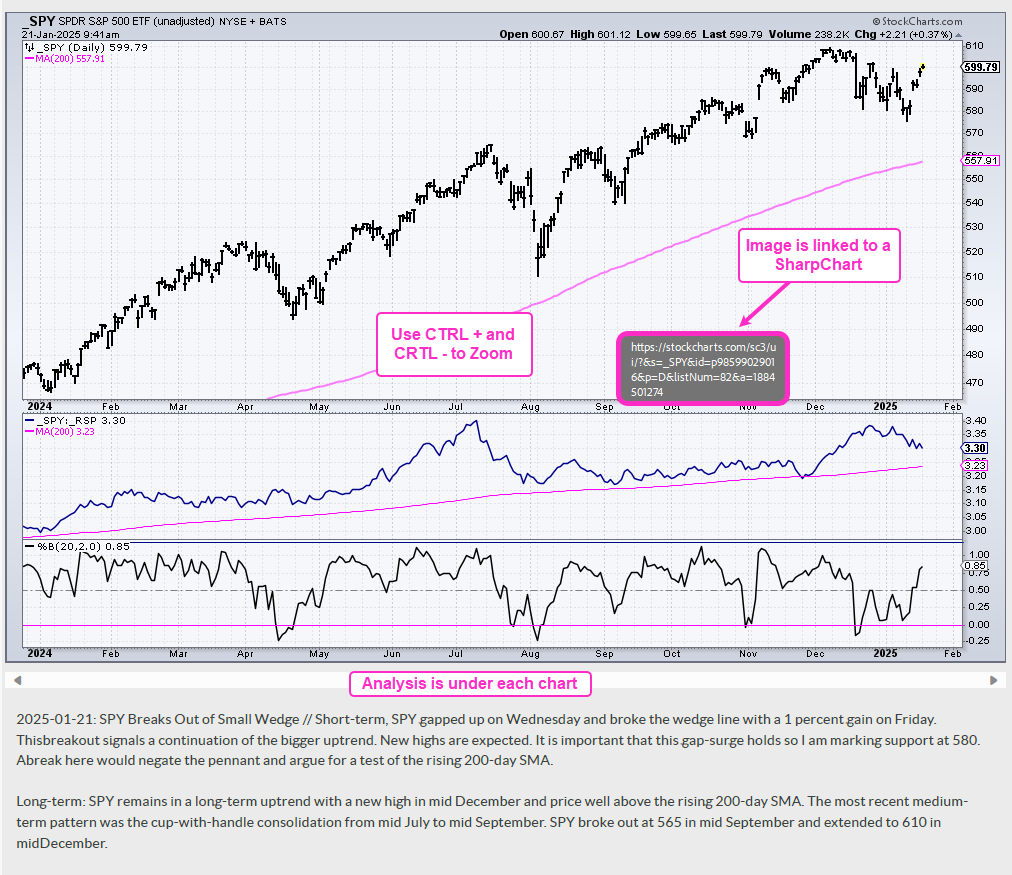
Use CRTL and the Plus or Minus keys (+ -) to zoom. 125% works best for me.
Send feedback to support(at)trendinvestorpro.com or use the contact form. [2]
Working with PDF Files
Why the shift to PDF? Working with ChartLists at StockCharts and PDF files is an effective and efficient manner to track and analyze a chart group (ETFs, stocks, Market Regime). It saves an enormous amount of “posting” time, which is the time required to copy/paste the text and charts for each section. With a ChartList, I simply print the charts and analysis to one PDF. This also serves as a good archive.
The charts in the PDF files are linked to a corresponding SharpChart at StockCharts. There are two ways to open the PDF file: through your browser or through an application like Adobe Acrobat. When viewing the PDF through your browser, the best way to open a chart is to right click on the image and choose open in new tab/window. When viewing the PDF through Acrobat, you can open a chart in your default browser by simply clicking on the image.
The example below is a screen shot from the PDF.
Send feedback to support(at)trendinvestorpro.com or use the contact form. [2]