Warning Signs vs Weight of the Evidence, Oversold Double Dip, Leading Tech, SMH Holds Triangle Breakout
Posted By
Arthur Hill, CMT
On
In
Archive |
No Comments
The next report and video will be on Friday, January 3rd.
There are warning signs flashing, but it is important to keep perspective and have a framework for analysis. My basic framework starts with the weight of the evidence for the broad market environment (bull market or bear market). Even though the long-term breadth indicators deteriorated into December, they have yet to trigger bearish and the weight of the evidence remains bullish. Similarly, SPY and QQQ are in long-term uptrends and yield spreads do not show stress in the credit markets.
The warning signs include the break down in the Home Construction ETF (ITB), relative weakness in the Semiconductor ETF (SOXX) and the recent breakout in the 10-yr Treasury Yield. These were highlighted here[1]. We also had frothy conditions in some high beta groups after big run ups into early December. Housing, semiconductors and Treasury yields remain a concern, but the high-flying groups pulled back in the second half of December.
At this point, market weakness in December is viewed as a corrective phase within a bigger bullish environment. This will be the case as long as the weight of the evidence remains bullish for stocks. All corrections begin with a pullback and all bear markets begin with a correction. However, not all pullbacks turn into extended corrections and not all corrections turn into bear markets. The market experienced a pullback in December, but it was not enough to change the weight of the evidence.
Long-term Breadth Remains Bullish
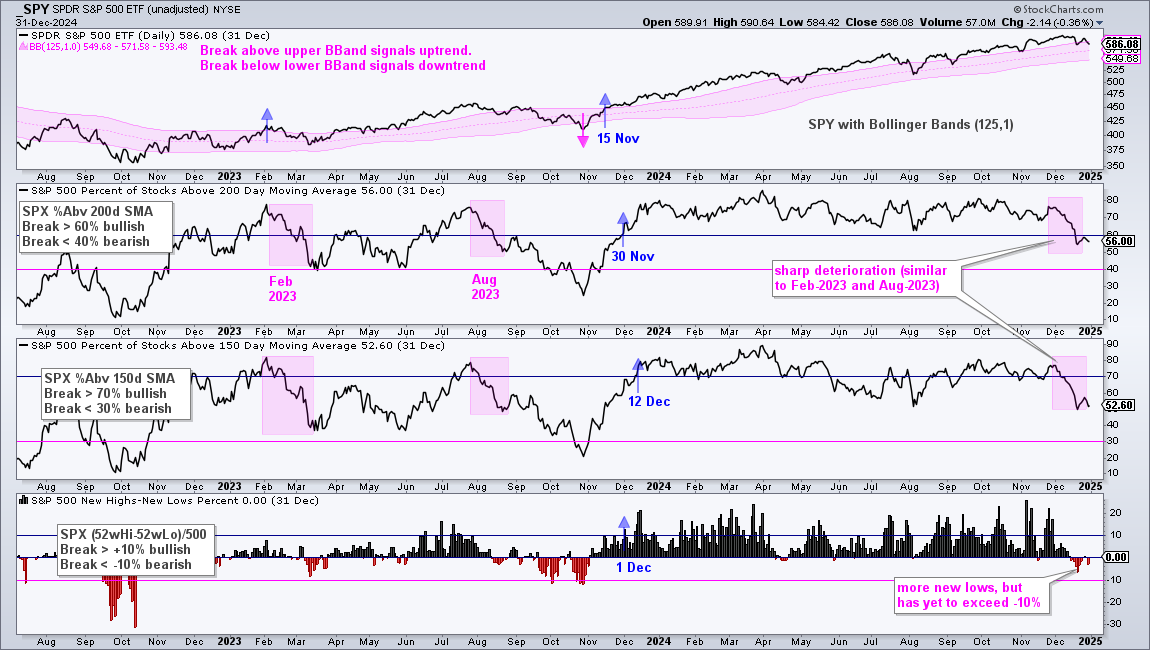
The first chart shows SPY with a long-term trend indicator (Bollinger Bands (125,1)) and three breadth indicators. First, the long-term trend turned up with the Bollinger Band breakout on November 15th (blue arrow). SPY dipped below the upper band in December, but remains in a long-term uptrend until a break below the lower band. The middle indicator windows show S&P 500 Percent Above 200-day SMA ($SPXA200R) turning bullish with a move above 60% on November 30th (blue arrow) and S&P 500 Percent Above 150-day SMA ($SPXA150R) turning bullish with a move above 70% on December 12th.
SPX %Above 200-day and SPX %Above 150-day remain in bull mode until they cross below their bearish thresholds (40% and 30% respectively). Both indicators fell below 60% in December as breadth deteriorated. With the indicators still in bull mode, I will treat recent weakness as a correction within a bullish environment. The bottom window shows S&P 500 High-Low% ($SPXHLP) turning bullish on December 1st with a move above +10%. The indicator turned negative in the second half of December as new lows outnumbered new highs. This also shows deterioration under the surface, but the indicator remains net bullish until a cross below -10%.
Oversold Double Dip
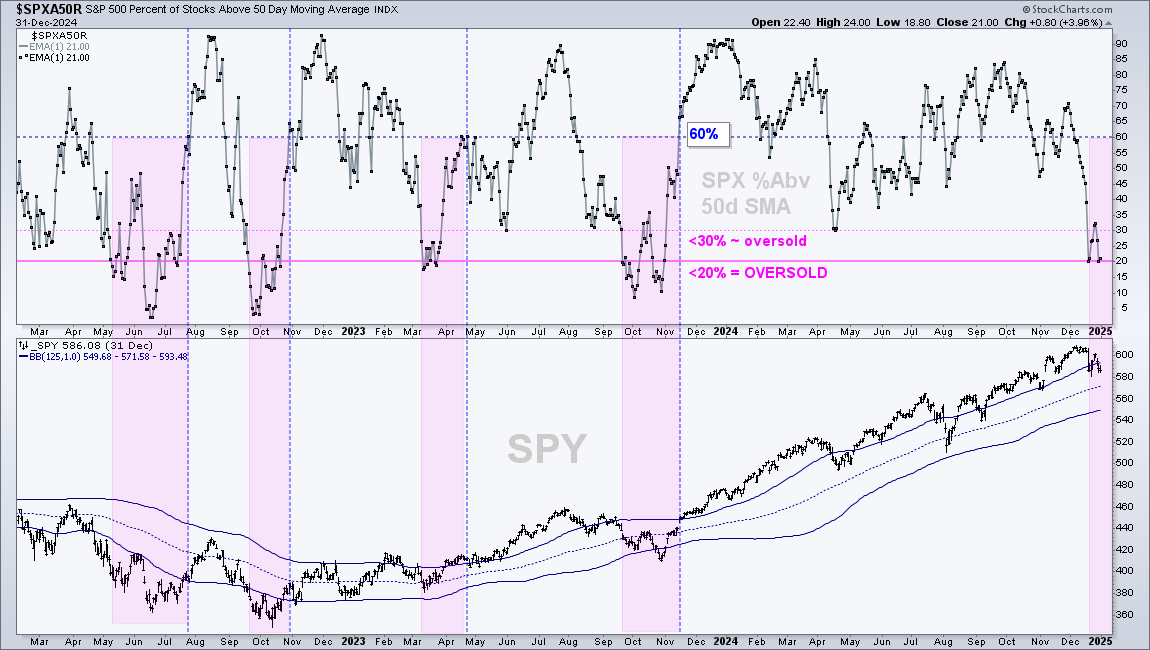
The next chart shows S&P 500 Percent Above 50-day SMA ($SPXA50R) in the upper window and SPY in the lower window. This short-term breadth indicator becomes moderately oversold with a dip below 30% and truly OVERSOLD with a dip below 20% (pink shading). A subsequent surge above 60% shows a meaningful rebound (blue lines). This indicator is currently oversold as it fell to its lowest level since October 2023. This is the second dip into oversold territory in as many weeks.
This plunge below 20% shows a sharp deterioration in breadth and presents traders with a double-edged sword. The plunge and low reading reflect broad weakness within the S&P 500. The most since October 2023. Such moves can destabilize the market and lead to an extended correction or more (September 2023 and 2022). On the other side, the weight of the long-term evidence is still bullish and this could be a pullback within a bigger bullish environment. At this stage, the bulls need to prove themselves short-term so we need to see a meaningful rebound with a surge above 60%. The blue dashed lines show prior rebounds.
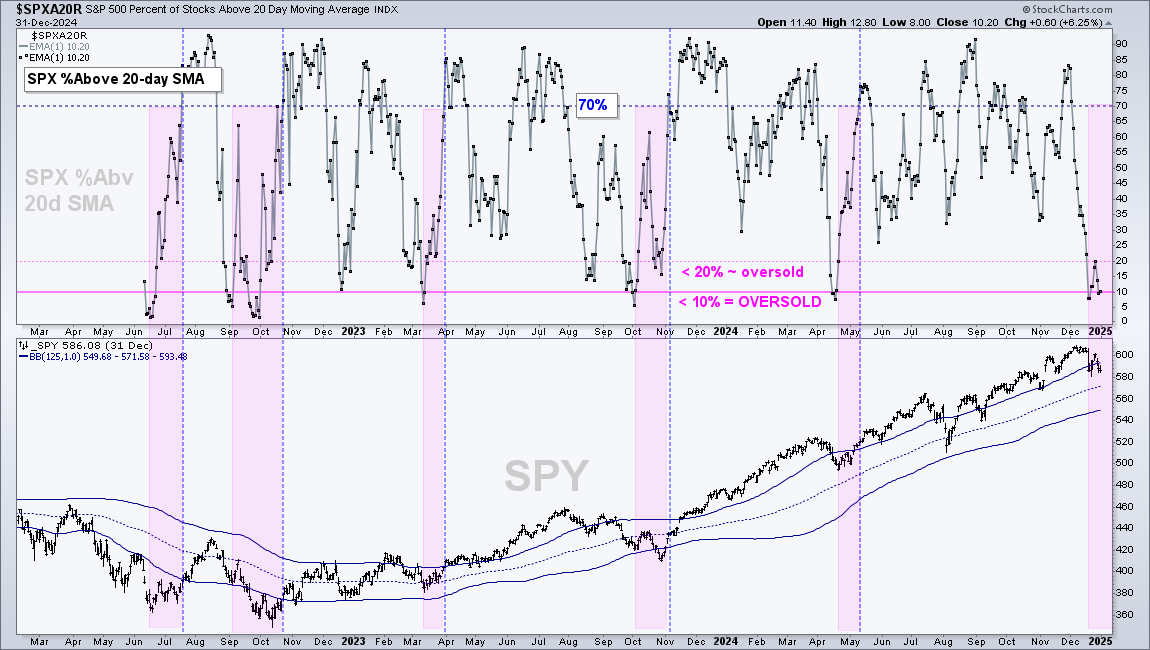
The next chart shows S&P 500 Percent Above 20-day SMA ($SPXA20R) with the moderately oversold level at 20%, the true OVERSOLD level at 10% and the meaningful bounce level at 70%. This indicator is more sensitive because the 20-day SMA is much shorter than the 50-day SMA. I set my key levels wider to reduce whipsaws. This indicator is also oversold and remaining oversold (pink shading). A surge above 70% would show a meaningful increase (thrust) in upside participation.
SPY and QQQ Testing 50-day SMAs
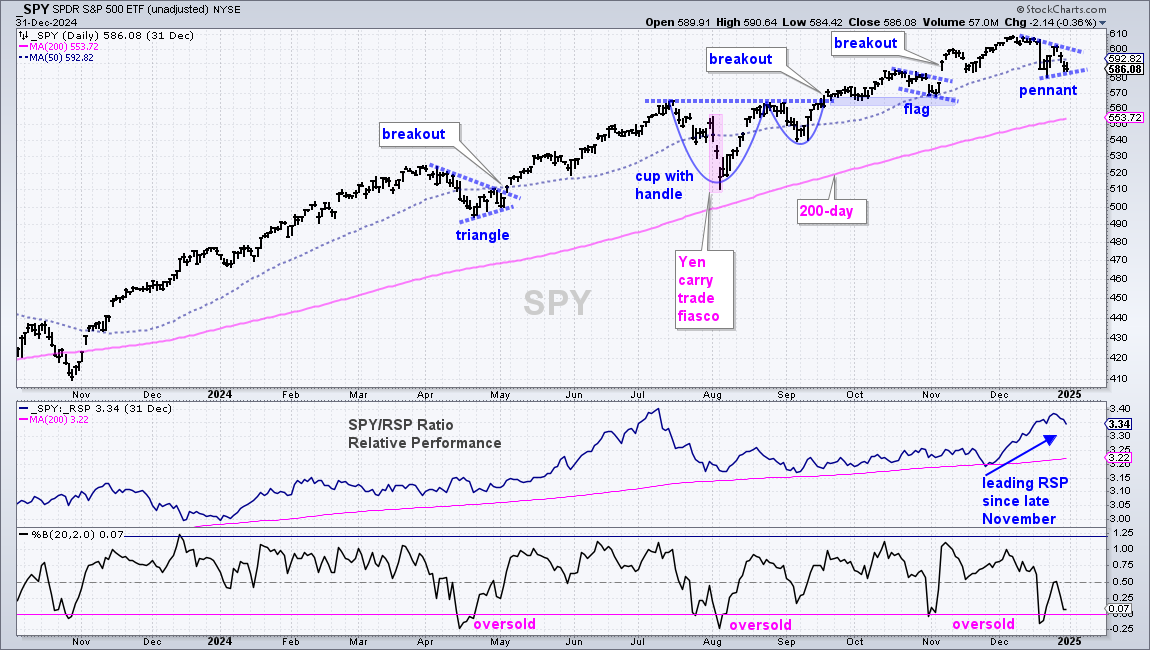
SPY remains in a long-term uptrend with a possible pennant forming the last few weeks. First, SPY hit a new high in early December and is well above the rising 200-day SMA. The cup-with-handle in summer was the most recent “large” pattern and SPY confirmed this pattern with a breakout on September 19th. SPY then worked its way higher the last three months.
Short-term, I see a setup because SPY became oversold as %B (20,2) dipped below 0 in mid December. This means the close was below the lower Bollinger Band (20,2). SPY also closed below the 50-day SMA, which means there was a pullback or consolidation. A pullback or consolidation within a bigger uptrend is an opportunity to partake in the uptrend. On the price chart, SPY could be forming a pennant which is a bullish continuation pattern. A breakout at 605 would open the door to new highs.
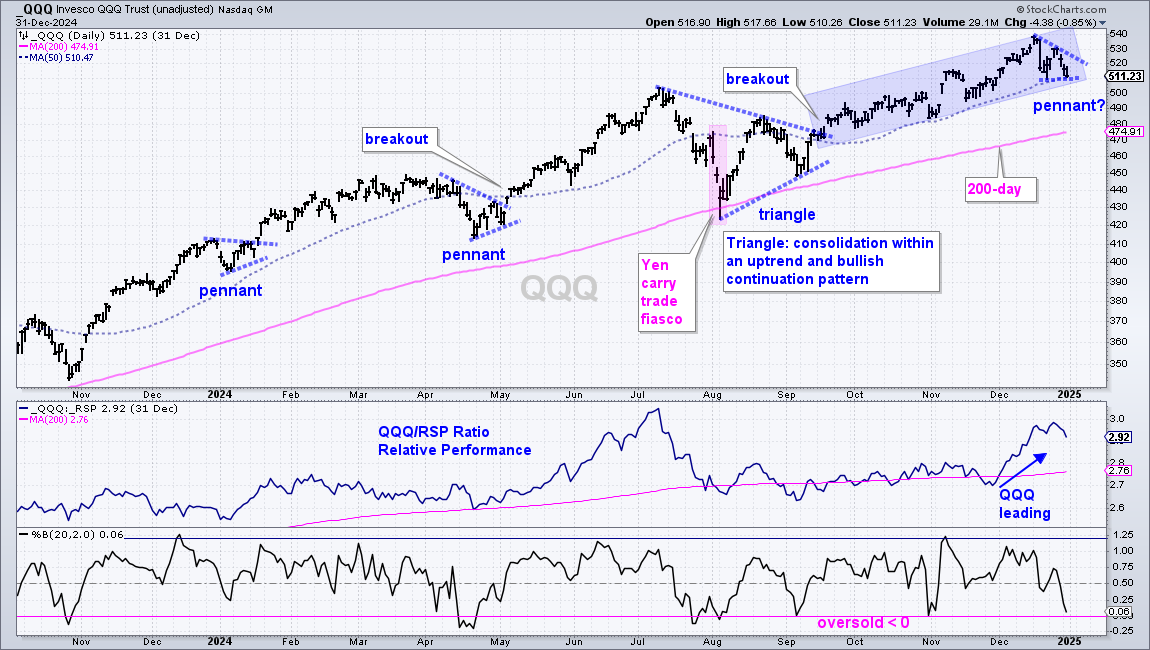
The next chart shows QQQ within a long-term uptrend. The ETF hit a new high in mid December and remains well above the rising 200-day SMA. The summer triangle was the most recent “long-term” pattern. QQQ broke out in the second half of September and worked its way higher the last three months (blue shading). Short-term, the ETF fell back to the 50-day SMA and a pennant could be forming. Also notice that %B (bottom window) is almost oversold. Thus, QQQ has a short-term setup in the works because the pennant is a short-term continuation pattern, price is near the 50-day SMA and %B is near oversold levels.
MAG7, Tech and CIBR Lead
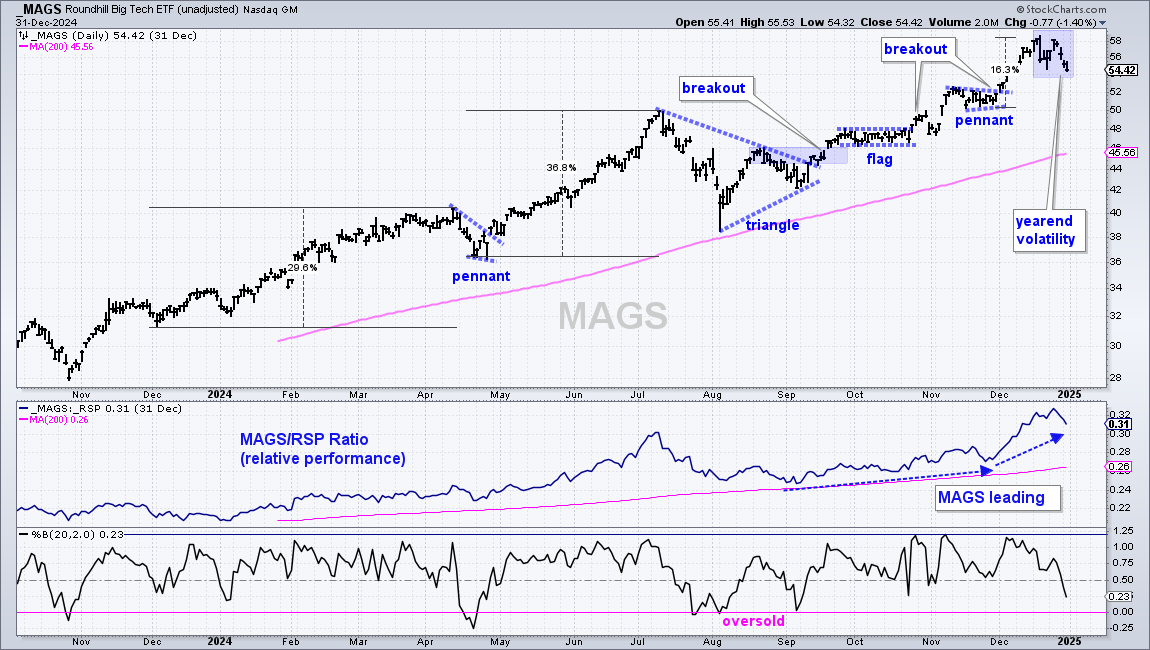
The Mag7 ETF (MAGS) remains one of the strongest ETFs and the Technology SPDR (XLK) is also leading the market. The first chart shows MAGS with a triangle breakout, a flag breakout in late October and a pennant breakout in early December. MAGS led the market from September to November and accelerated higher in the first half of December (+16%). Trading turned volatile in the second half of December with two sharp declines, but I consider this normal volatility after a big move. I do not see a setup on this chart, just a leading uptrend.
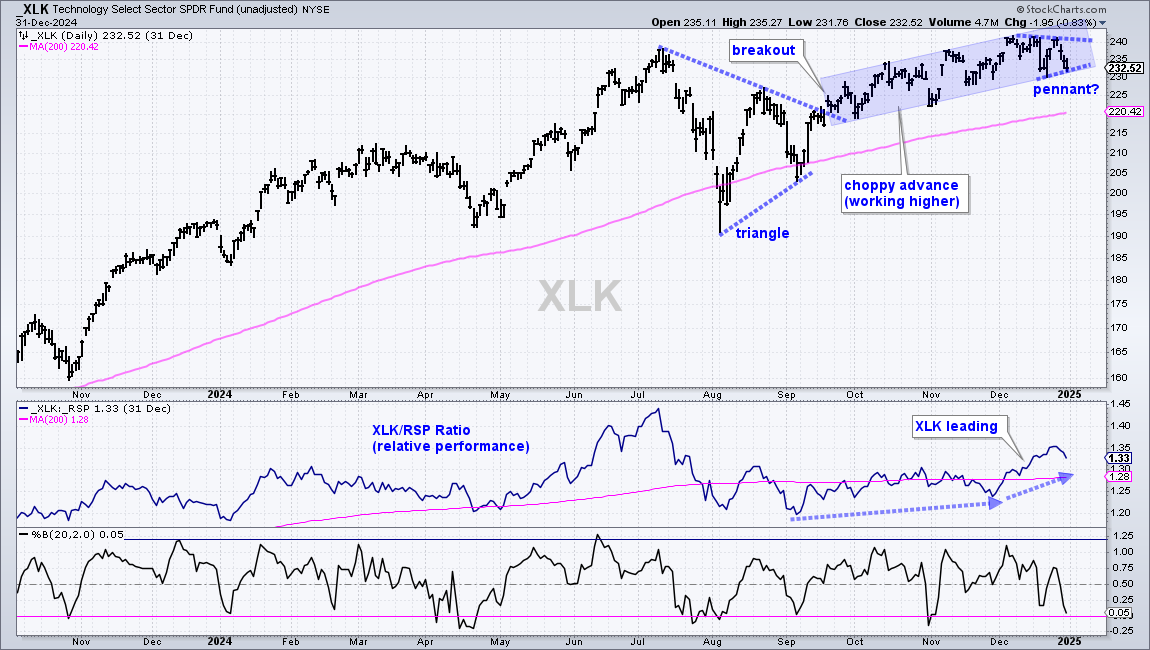
The next chart shows XLK with a triangle breakout in mid September and a choppy advance since this breakout (blue shading). As with QQQ above, XLK could be forming a pennant within this uptrend. %B is also near oversold levels.
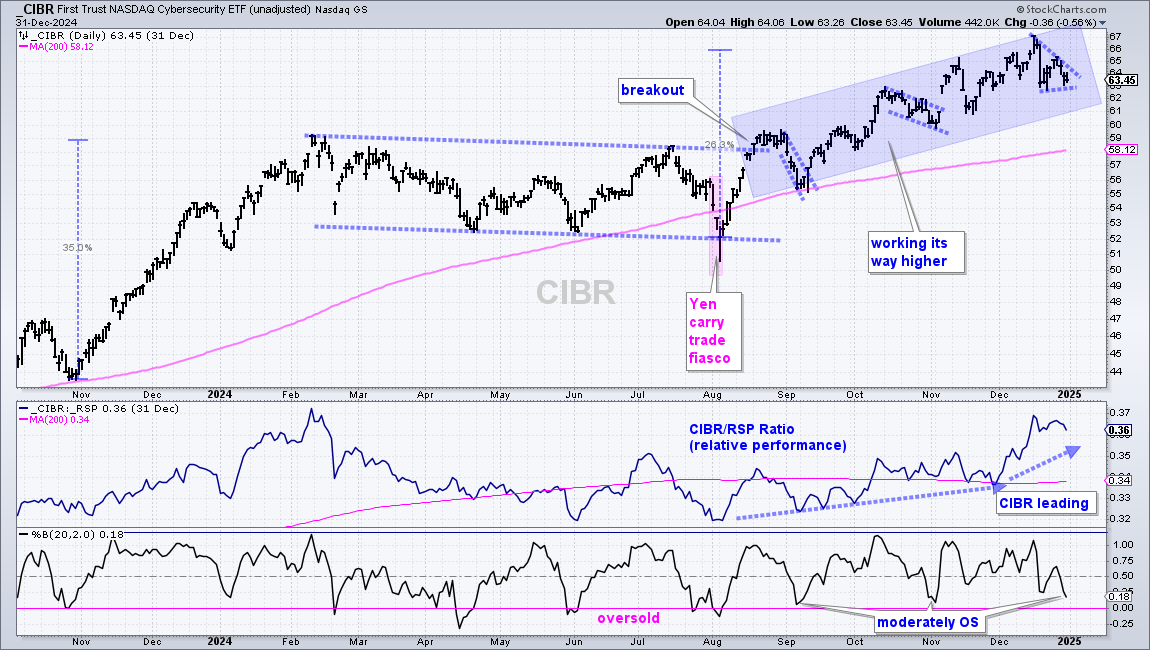
The next chart shows the Cybersecurity ETF (CIBR) with a breakout in mid August and a choppy advance since this breakout (blue shading). There were three pullbacks and moderately oversold readings along the way as %B dipped below .25 (Sept, Nov and Dec). A true oversold reading occurs with a dip below 0. Sometimes the pullbacks are relatively shallow and we do not get a true oversold reading. CIBR is moderately oversold with %B at .18 and a possible pennant is forming. A breakout at 65.5 would open the door to new highs.
IGV, FINX, SKYY Correct after Becoming Frothy
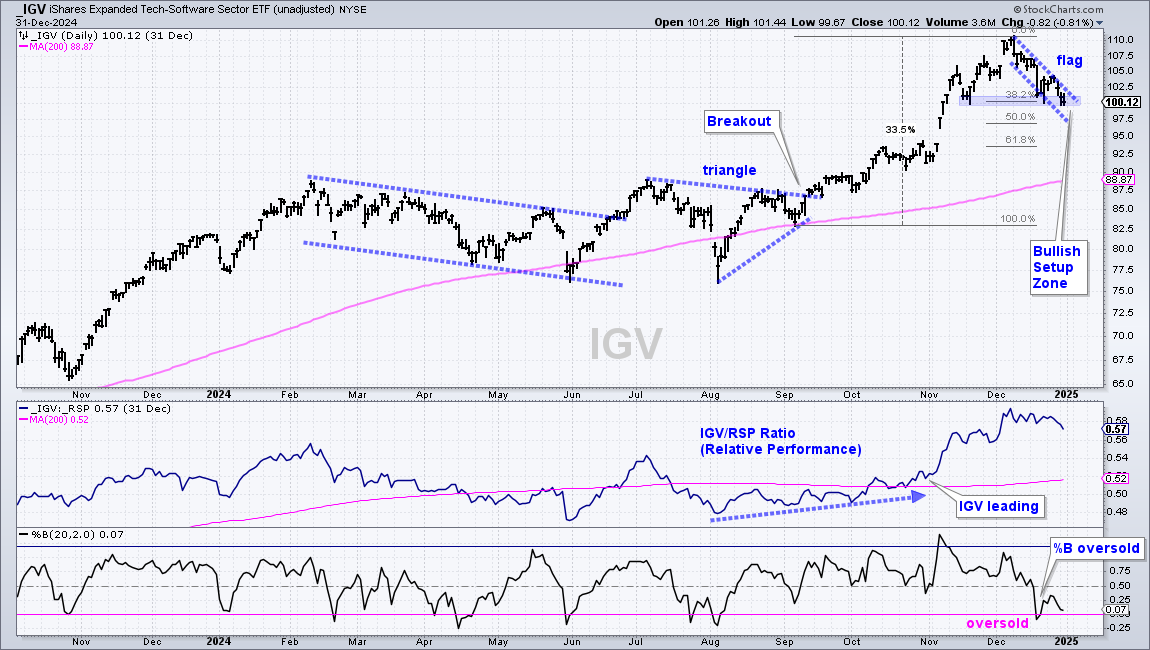
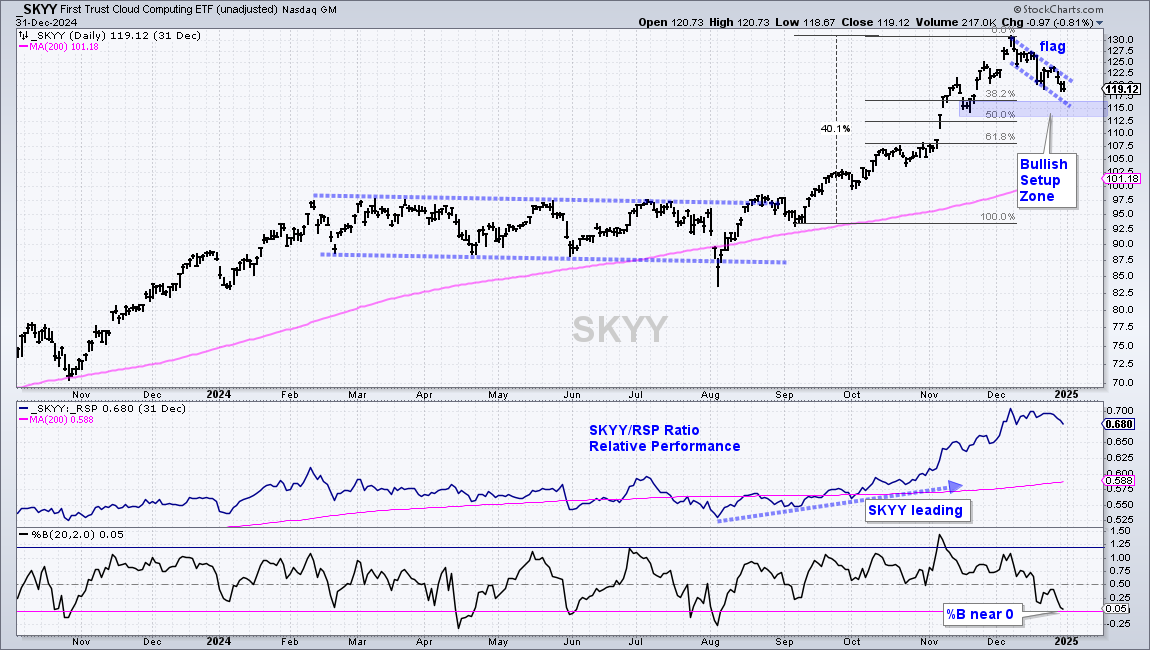
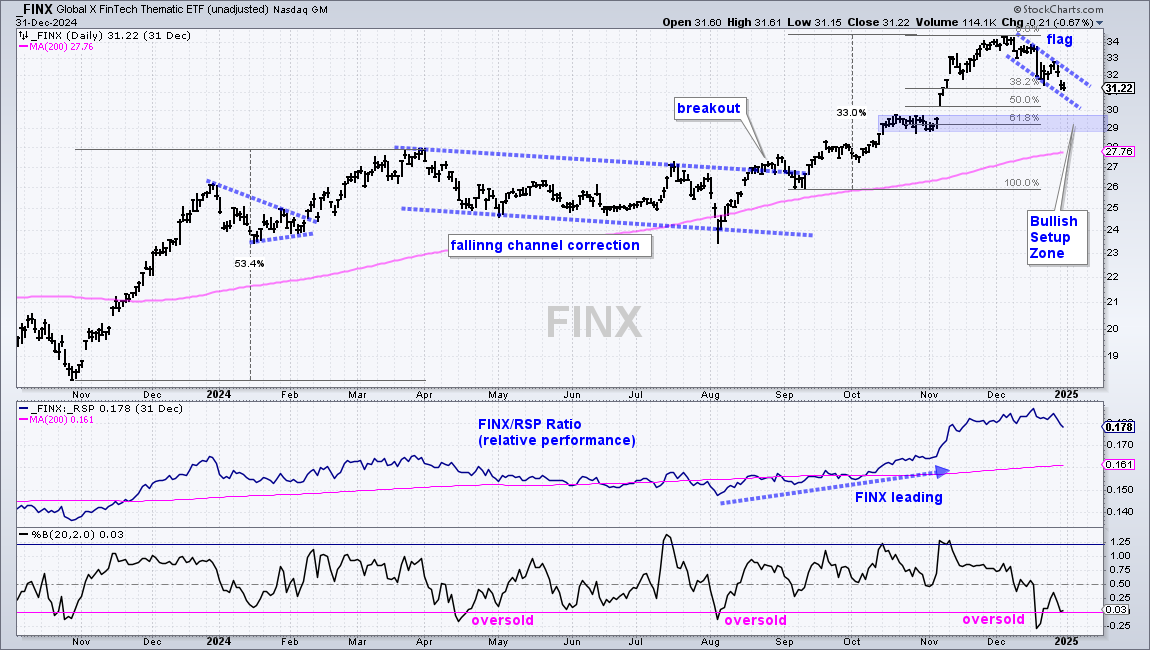
Some high-beta areas of the market experienced bubble-like price moves from early September to early December. For example, the FinTech ETF (FINX) and the Software ETF (IGV) surged some 33%, while the Cloud Computing ETF (SKYY) gained 40%. All three were up over 15% in November alone. The big moves from early September to early December and acceleration higher in November created a frothy situation. These ETFs were very overbought in early December and ripe for pullbacks. Which they got.
The first chart shows IGV with a 33% advance and a falling flag pullback the last few weeks. IGV also hit a Bullish Setup Zone and %B became oversold. A Bullish Setup Zone is an area marked by support and key retracements. This is an area to watch for firming and a possible reversal after a pullback. An oversold condition provides more emphasis and increases the chance for a bounce. The flag is a short-term bullish continuation pattern and a breakout would reverse the short-term slide.
The second chart shows SKYY with a 40% advance into early December and a 10% decline into yearend. A falling flag is taking shape and %B is near 0 (oversold). A flag breakout would reverse the short-term downtrend (pullback) and argue for a resumption of the bigger uptrend.
The next chart shows FINX with a 33% advance into early December and a 9% decline into yearend. A falling flag is also taking shape and %B became oversold in mid December.
SMH Consolidates Near 200-day SMA
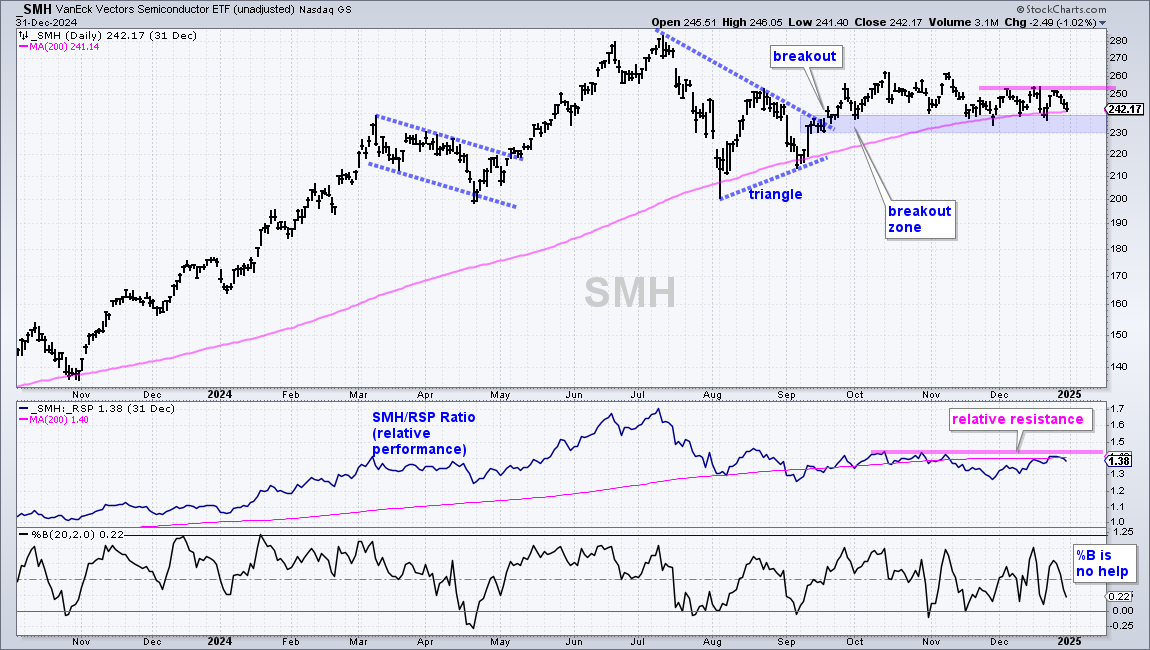
Like XLK and QQQ, the Semiconductor ETF (SMH) formed a triangle in the summer and broke out in mid September. XLK and QQQ worked their way higher after the breakouts and hit new highs. SMH, in contrast, got stuck in a rut and consolidated between 235 and 265. The triangle breakout is still holding and SMH is testing its rising 200-day SMA. Despite lack of follow through, the cup is still half full. A clean break below the 200-day SMA and below the breakout zone would be bearish. Call it a close below 230. SMH established resistance in the 250-255 area with three peaks in December. A close above 255 would break resistance and keep the triangle breakout alive. I would also like to see the price-relative (SMH/RSP Ratio) break out “relative” resistance as well.
Report and Video on Friday, January 3rd
Note that I will publish another report tomorrow and cover the ETFs below. I will also add a video.