Plunge in 10yr Yield Triggers Home Builders – Analyzing ITB and Five Stocks (Premium)
Posted By
Arthur Hill, CMT
On
In
Archive |
No Comments
The next report will be posted on Tuesday morning, December 3rd.
The 10-yr Treasury Yield plunged as Treasury bonds surged on the heels of a new nomination for Treasury secretary. These moves lifted small-caps, banks and homebuilders. Banks have been leading for some time and small-caps started their move last week. Homebuilders held out for interest rates and got their catalyst on Monday. Today’s report will analyze the move in the 10-yr Treasury Yield, the surge in ITB and five home builder stocks. The only concern here is that the move in Treasuries is a knee-jerk reaction. Follow through would confirm the validity of these short-term reversals.
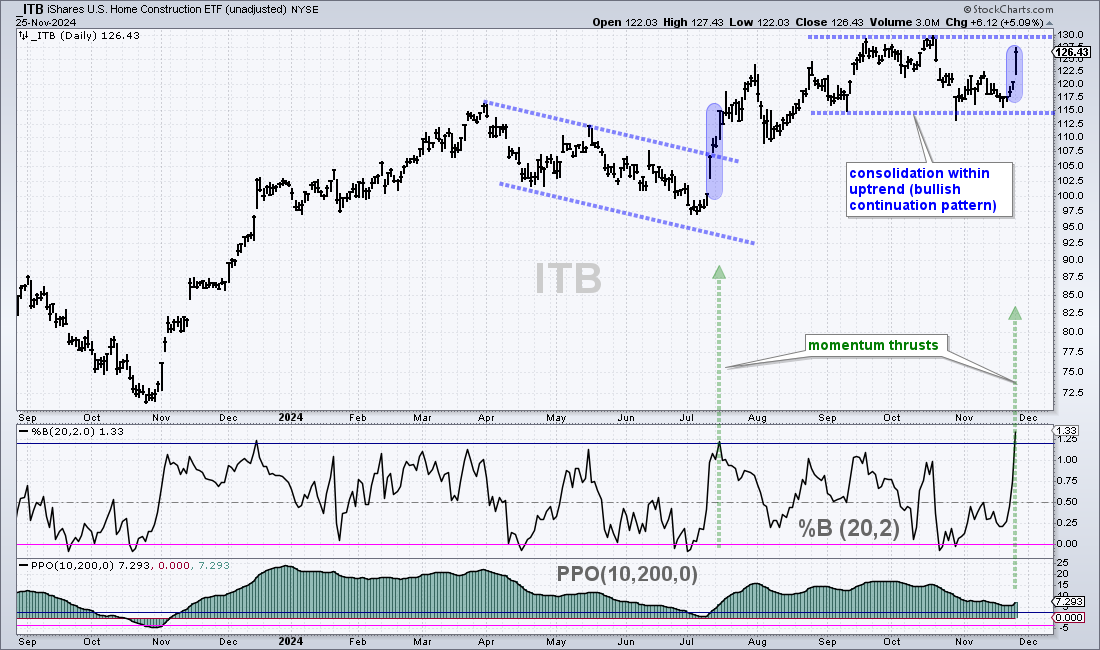
The Home Construction ETF (ITB) also caught a strong bid as the 10-yr Treasury Yield fell on Monday. The chart below shows ITB with its second momentum thrust this year. First, note that the long-term trend is up and ITB consolidated with a trading range from September to November. A consolidation within an uptrend is a bullish continuation pattern and a breakout would provide the continuation signal.
The middle window shows %B surging above 1.2 for the second time this year. This sharp move higher is a momentum thrust (green arrow). The first momentum thrust occurred in July when ITB broke out of a falling channel. As its name implies, a momentum thrust reflects strong buying pressure because prices surged. It is like a rocket lifting off the launchpad. Short-term, ITB is overbought because %B is above 1.2. Long-term, however, this momentum thrust is bullish and I would expect a price breakout. A close below 115 would call for a re-evaluation.
In addition to StockCharts[2], I also use TradingView for multi-chart layouts, comparison charts and a wide array of indicators. Check it out[3].
Five Home Builder Charts
Each chart shows price bars in the main window, %B (20,2) in the middle window and the PPO(10,200,0) in the lower window. This chart layout is designed to capture the long-term trend, short-term overbought/oversold conditions and chart setups. The PPO(10,200,0) signals a long-term uptrend when it crosses above 3% and this signal remains until a cross below -3%, which signals a long-term downtrend. %B (20,2) signals oversold with a move below 0, which means the close is below the lower Bollinger Band. On the price chart, I am looking for bullish continuation setups and bullish setup zones.
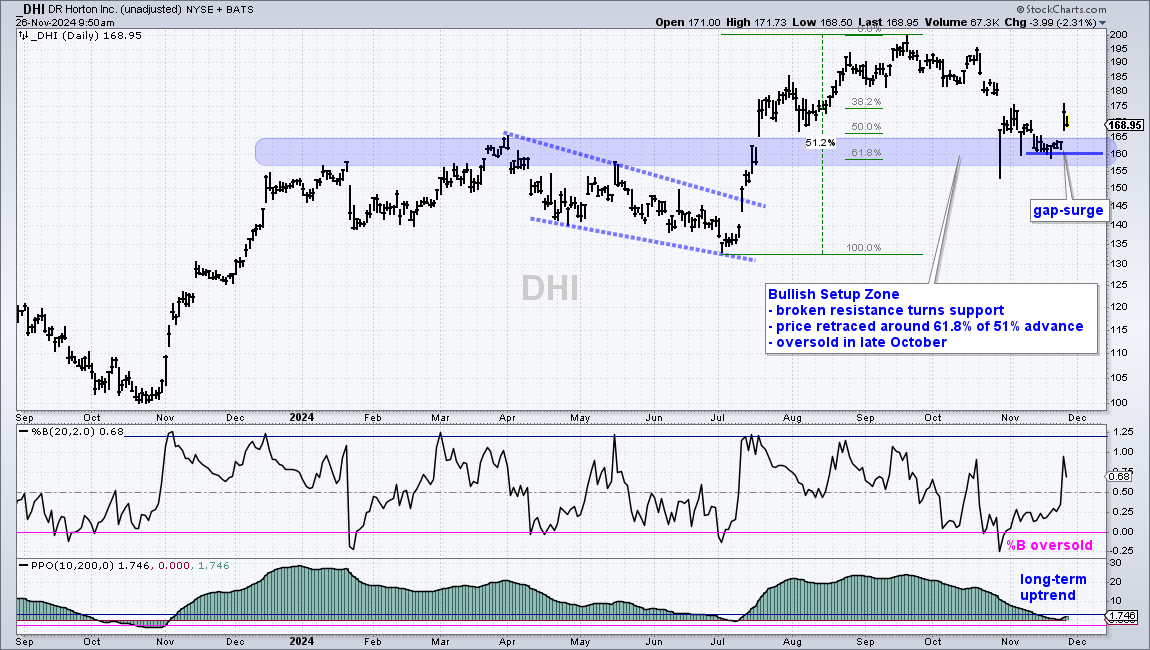
The first chart shows DR Horton (DHI) surging off a Bullish Setup Zone. First, the long-term trend is up. Even though the PPO(10,200,0) dipped in early July and late November, it did not exceed -3% to reverse its uptrend signal from early November 2023. Second, %B became oversold in late October and the stock then stabilized around 160. Thus, we had an oversold condition within a long-term uptrend.
On the price chart, I am using the 61.8% retracement and broken resistance to mark a Bullish Setup Zone in the 160 area (blue shading). DHI surged some 50% and hit a new high in mid September. A correction after a big move is normal. Typically, corrections retraced 33 to 67 percent of the prior advance, with 50% marking the base case. Corrections also have a tendency to return to prior breakouts zones, which turn into support. Thus, we have a Bullish Setup Zone in the 160 area. DHI confirmed this zone with a gap-surge on Monday and this reverses the short-term downtrend. I would mark re-evaluation support at 160.
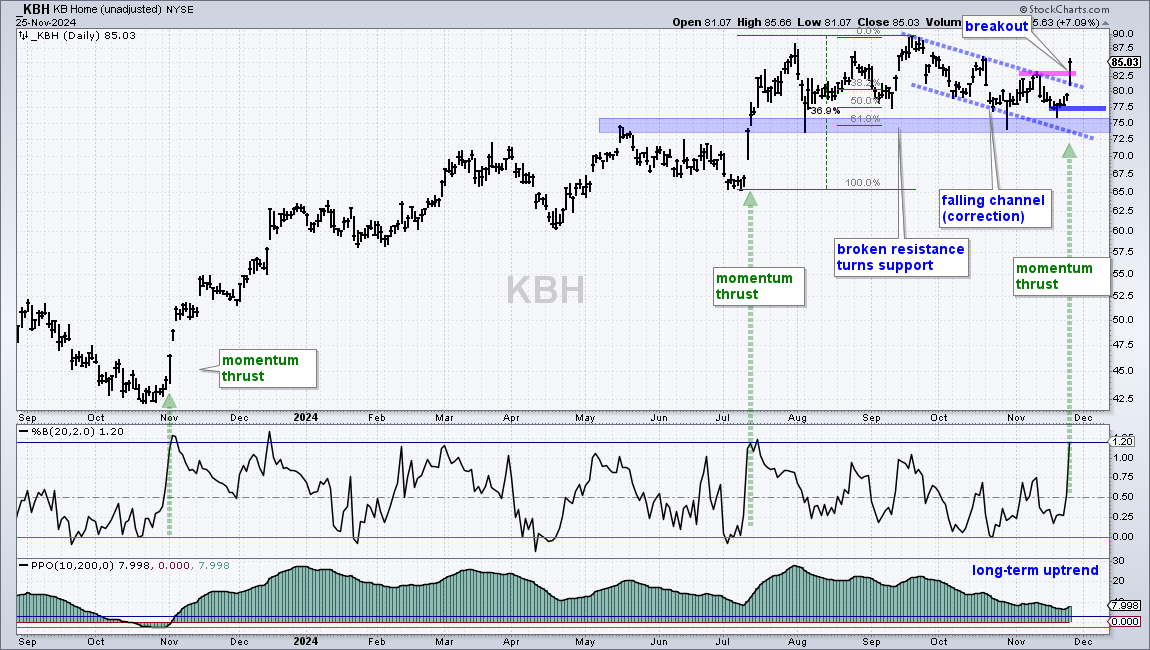
The next chart shows KB Home (KBH) with a breakout in July and new high in mid September. The stock fell back to the breakout zone with a falling channel that retraced around 61.8% of the 37% advance. This channel is a correction within an uptrend and Monday’s breakout reverses the short-term decline. Re-evaluation support is set at 77.
The green arrow-lines mark momentum thrusts in November 2023, July 2024 and November 2024. A momentum thrust occurs when %B surges from a relatively low level (< .25) and exceeds 1.20. This shows strong upside momentum that creates a short-term overbought condition, but also paves the way for further gains in the coming months. Even though we could see a short-term pullback, pullbacks are opportunities as long as support at 77 holds.
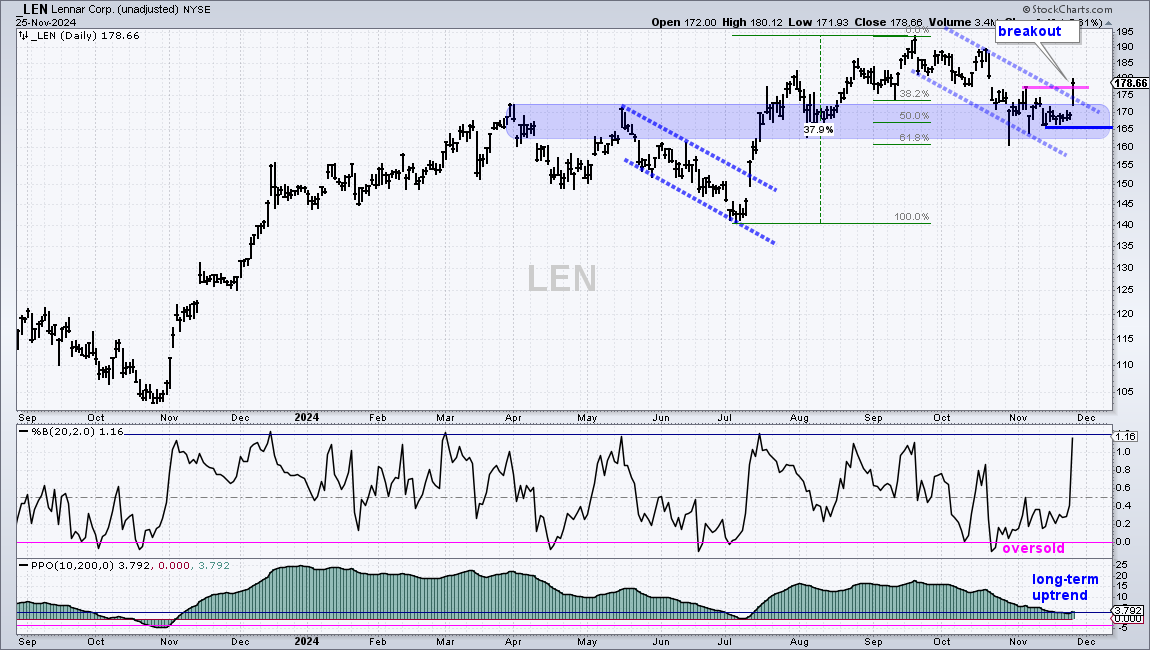
The next chart shows Lennar (LEN) with similar characteristics. Note that the big home builders are highly correlated and tend to move in the same direction.
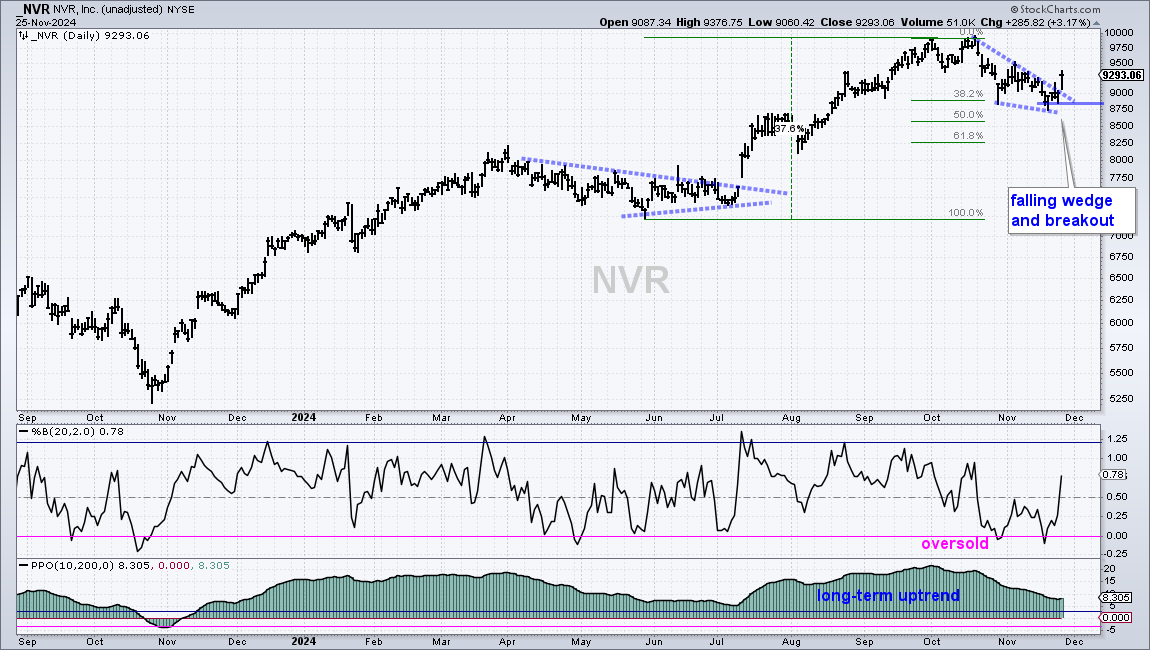
The next chart shows NVR (NVR) with a relatively shallow dip that retraced 38-50% of the prior advance. A falling wedge formed and NVR broke out with a surge on Monday.
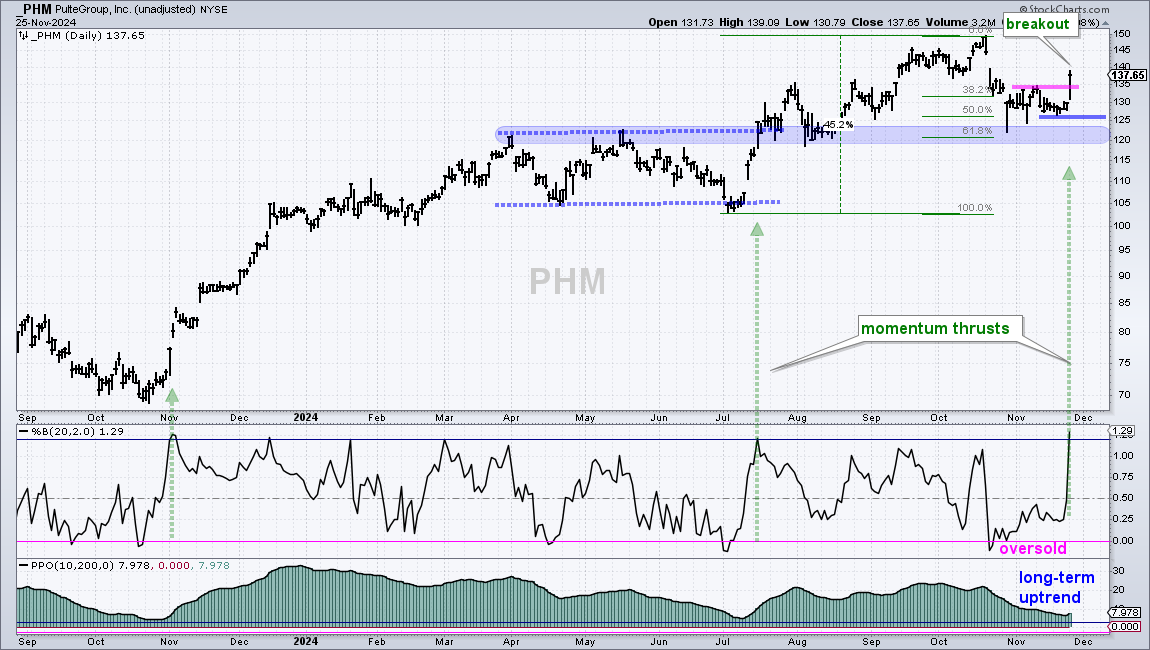
The next chart shows PulteGroup (PHM) with a correction and breakout. First, broken resistance turned into support in the low 120s (blue shading). Second, the October decline also retraced 50-61.8% of the July-September advance. The breakout occurred with a momentum thrust as %B exceeded 1.20. This creates a short-term overbought condition within a longer-term bullish environment.
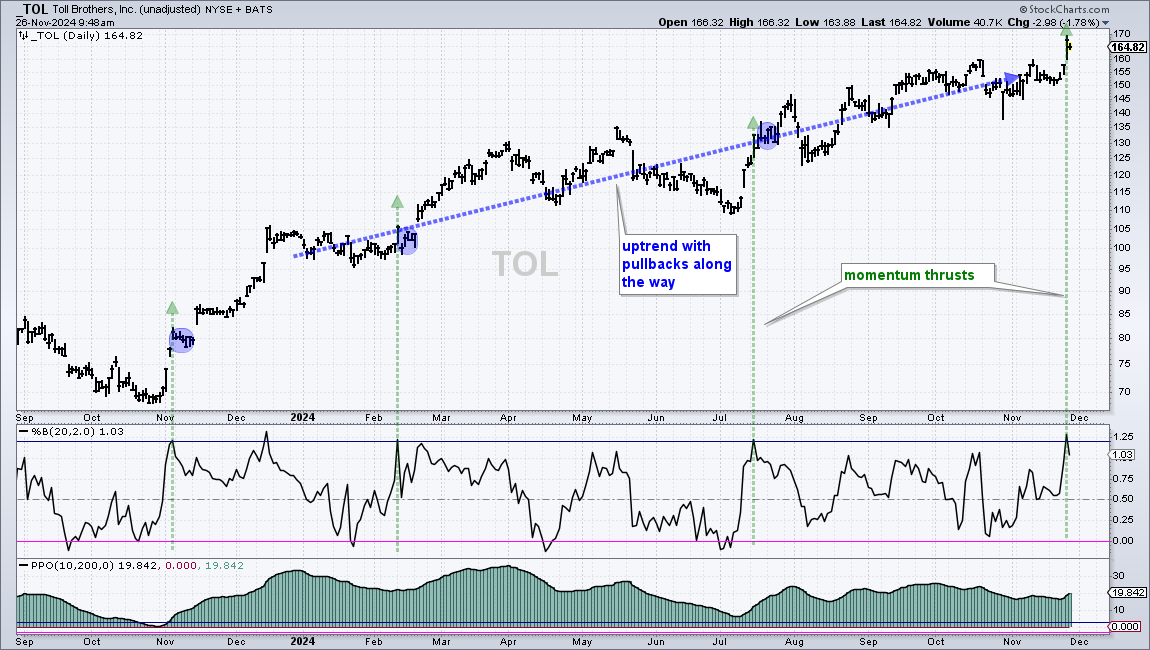
The next chart shows Toll Brothers (TOL), which is the leader within the group. Why? Because it surged to a new high on Monday. The green vertical lines show momentum thrusts in early November 2023, mid February 2024, mid July and late November. The blue shaded boxes show short consolidations that lasted four to five days after the first three surges. Sometimes we get a short pullback or consolidation and sometimes we don’t. It is hard to predict the short-term here because the news cycle is running in high gear and trading will thin in the coming days.