Chart Trader Weekly Report – Broad Market Analysis, Leading Groups (ETFs), Chart Setups and Trading Ideas (Premium)
Posted By
Arthur Hill, CMT
On
In
Archive |
No Comments
Video and Report Headlines
Winners and Losers Since the Election
S&P 500 Breadth Reflects Broad Strength
QQQ Breadth Remains Bullish
BBB Spread Plunges to New Lows (Narrow)
What is the Bond Market Telling Us?
SPY Surges to a New High
QQQ Extends on Triangle Breakout (Plus XLK, MAGS)
Semiconductor ETF Remains a Drag
Software, Cyber, Fintech and Cloud Become Extended
Healthcare and Defense Move Sharply Lower
Copper, Base Metals and Palladium Get Slammed
CCEP Reverses at Bullish Setup Zone
CSX Surges for Big Breakout
DDOG Bids to Reverse Extended Downtrend
GLD becomes Oversold with Free Fall
TLT Extends Downtrend
Bitcoin Surges to Another New High
The next Weekly Report will be posted on Friday morning, November 22nd.
Market Pricing in New Policies
We saw some big moves over the last eight days as the markets rush to price in results of the election. This is the way markets work. They price in future events with just a few days of buying or selling. Some of these moves simply extended existing trends (stocks), while others resulted in failed breakouts (copper).
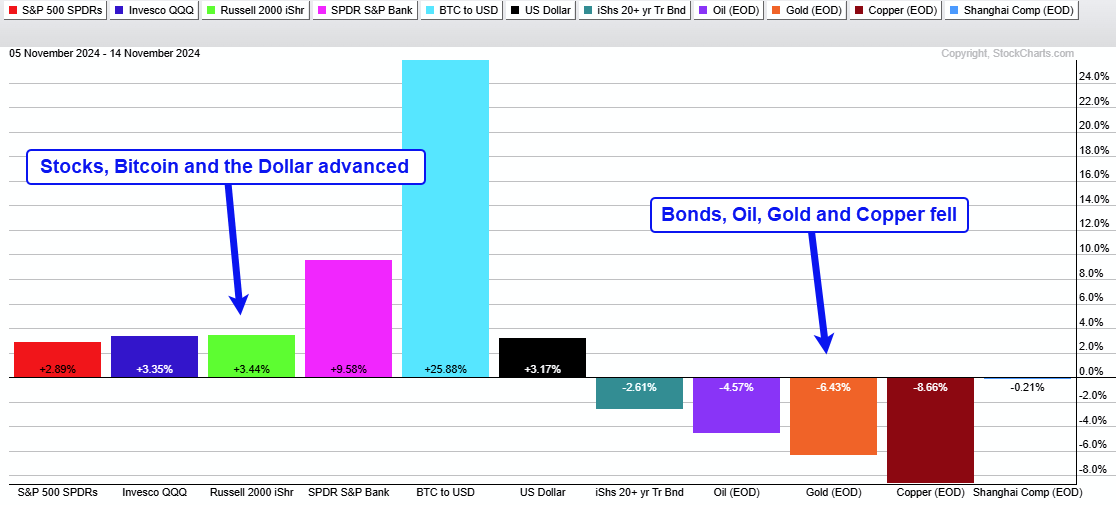
Groups leading over the last eight days include software, fintech, blockchain and banks. Marijuana (MJ) and clean energy (ICLN) suffered with double digit declines. Industrial metals moved sharply lower as traders priced in the “prospects” for tariffs. Bitcoin extended its surge, the Dollar went on a tear and gold became oversold for the first time this year. The PerfChart below shows some winners and losers since the election.
There are lots of narratives running around because there are more uncertainties than normal right now. Why? Because there is a regime change in Washington and the agenda remains a work in progress. Agenda’s take time to unfold and we are still over two months away from inauguration day.
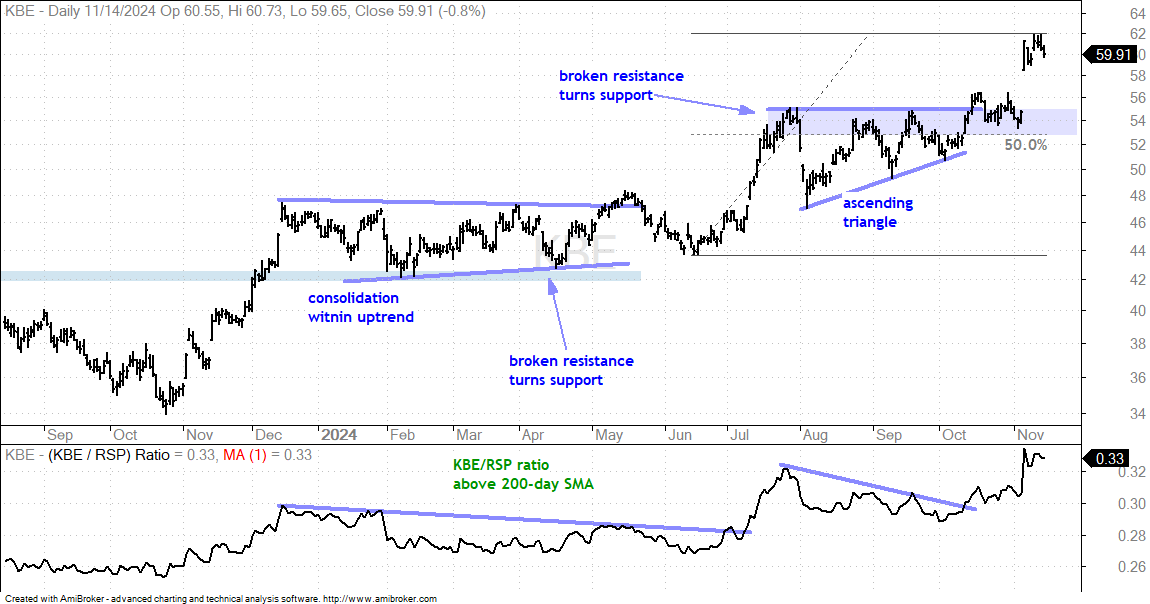
Time to let the dust settle. The big moves did not change the overall picture for stocks, but many groups became very extended earlier this week. Many are extended both medium-term and short-term. For example, the Bank SPDR (KBE) is up around 36% since mid June and up 9.5% the last nine days. Big moves reinforce existing uptrends, but it also means there are not very many setups on the charts. This it the time to exercise some patience: hold current positions and wait for better setups for new positions.
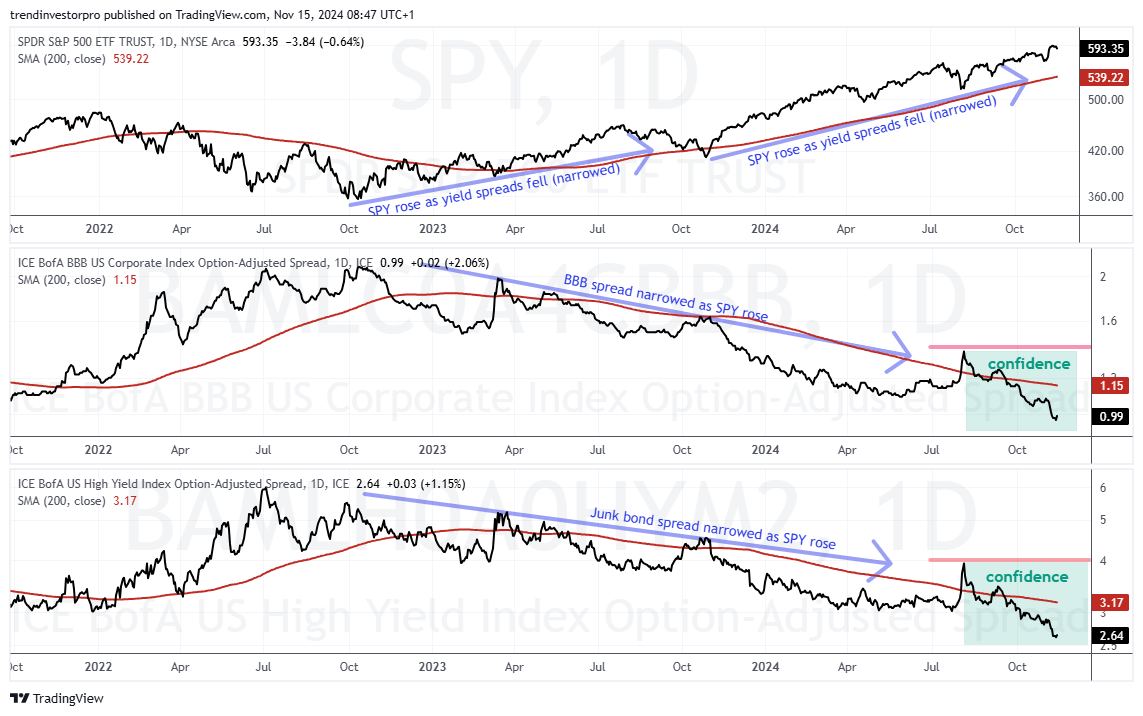
Despite extended conditions, the weight of the evidence remains bullish for stocks. It was bullish before the election and it remains bullish after the election. Breadth is strong with new highs expanding. The major index ETFs hit new highs here in mid November (QQQ, SPY, RSP). Even though the 10-yr Treasury Yield is near 4.4%, I am not concerned with this rise because yield spreads fell to new lows, which means the credit markets are confident.
S&P 500 Breadth Reflects Broad Strength
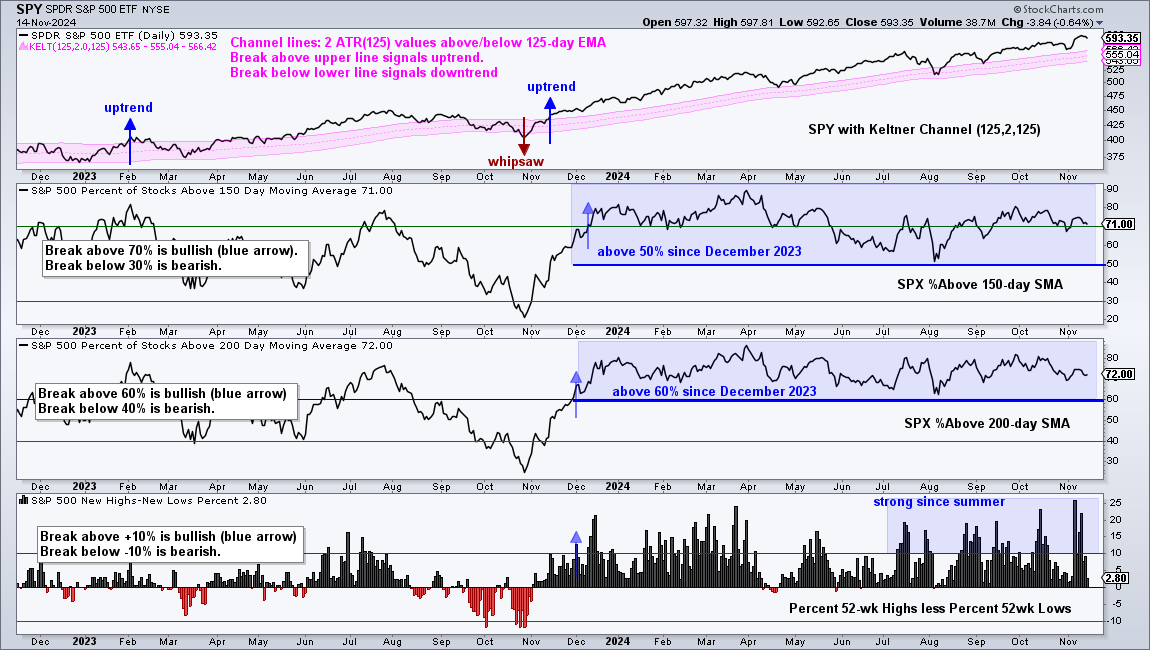
The top window shows SPY in a long-term uptrend since it first broke above the upper Keltner line in November 2023. This is a classic trend-following signal based on a volatility breakout because the Kelter Channels are two ATR(125) values above/below the 125-day EMA. This uptrend remains in play until a break below the lower line. SPY has remained above the entire channel since mid September, and this reflects a strong uptrend.
The chart below shows SPY with the Keltner Channels (125,2,125). The middle line is a 125-day EMA and the outer lines are 2 ATR(125) values above and below. An uptrend starts with a break above the upper line and remains until a break below the lower line. There was a whipsaw in late October 2023 and then an uptrend signal in mid November 2023. The long-term trend is clearly up here.
S&P 500 breadth remains strong with over 70% of stocks above their 150 and 200 day SMAs. These numbers are not as strong as those seen in late March (~90%) or late September (~80%), but they are strong enough to support a bull market (>70%). The lower window shows High-Low Percent with dozens of surges above 15% since July and a few surges above 20% since mid October. There are lots of stocks making new highs (strong uptrends) and this supports a bull market.
QQQ Breadth Remains Bullish
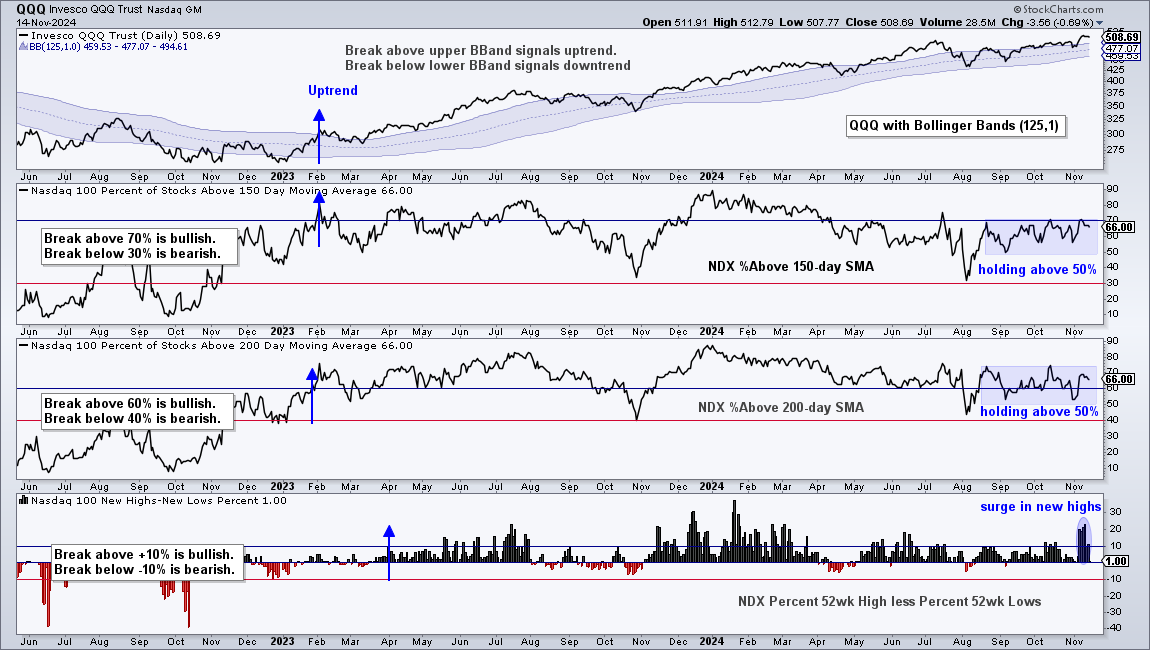
The top window shows QQQ in a long-term uptrend since it first broke above the upper Bollinger Band in February 2023. This is a classic trend-following signal based on a volatility breakout because the Bollinger Bands are 1 standard deviation above/below the 125-day SMA. This uptrend remains until a break below the lower band. Most recently, QQQ moved back above the upper band last week and hit new highs to confirm the uptrend.
Nasdaq 100 breadth is not as strong as S&P 500 breadth, but it is strong enough to support a bullish environment for Nasdaq 100 stocks. NDX %Above 200-day SMA and %Above 150-day SMA have hovered above 50% since September. Thus, the cup remains half full and both are currently above 60%. NDX High-Low Percent surged above 20% as new highs significantly expanded. This shows more stocks in strong uptrends and this also supports a bullish backdrop for Nasdaq 100 stocks.
In the indicator windows, we can see NDX %Above 150-day SMA plunging into early August and recovering into September. It has held above 50% the last two months and is currently at 70%. Strong enough. NDX %Above 200-day SMA dipped below 50% in early August, but quickly recovered and has held above 50% since this recovery. It is currently at 68% and strong enough to support a bull market for QQQ. The bottom window shows High-Low Percent surging to 20% on Wednesday, the highest level since March. This means 20% of Nasdaq 100 stocks hit new highs and this is also very bullish.
BBB Spread Falls to New Lows (Narrows)
There is no change in the yield spreads as they extended lower again this week. The BBB and Junk bond spreads fell to new lows here in mid November and this shows confidence in the corporate bond market. This is bullish for stocks.
These spreads show the difference between a corporate bond yield (BBB) and the equivalent US Treasury bond yield. BBB bonds are the lowest rated investment grade bonds. US Treasuries are the ultimate safe-haven bonds. The spread between these two widens (rises) when stress builds in the corporate bond market. This is negative for stocks. The spread narrows (falls) when stress levels are low or subsiding. This is positive for stocks.
What is the Bond Market Telling Us?
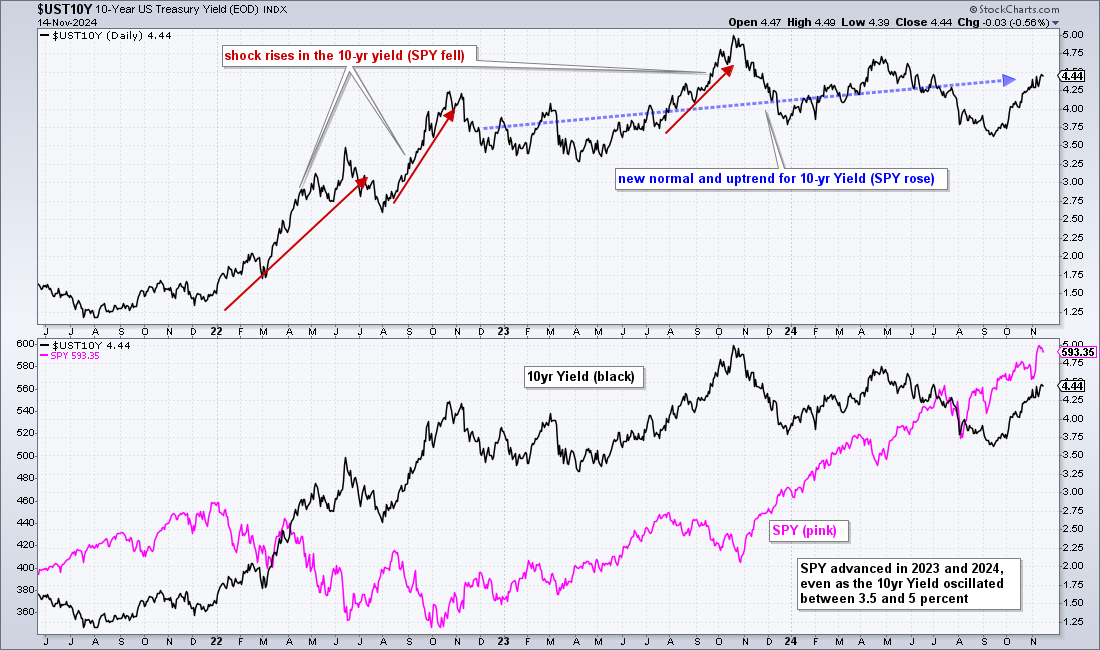
The 10-yr Treasury Yield ($UST10Y) surged from 3.6% in mid September to 4.44% in mid November. This steep move puts the yield well above 4%. A sudden and steep rise in the 10-yr Yield can weigh on the stock market. There dark red arrows in the top window shows three steep rises (2 in 2022 and one from August to October 2023). These moves correlated with weakness in stocks (see SPY (pink) in bottom window).
There are two distinct periods for the 10-yr Yield over the last three years. First, we have and initial rise from the 1.25-1.5 percent area in late 2021 to the 4% area in October 2022. This signaled the start of the new normal for interest rates (higher for longer). The blue dashed line shows this new normal and continued uptrend over the last two years. SPY performed extremely well during this new normal.
I was concerned with the sudden and sharp rise in the 10-yr Yield over the last two months, but that was because of the narrative. This narrative, suggested that yields surged on the prospects for bigger deficits and inflationary policies. It is important to keep an open mind because narratives can be wrong and there are other forces at work. For example, the bond market could be pricing in stronger economic growth. I will not become concerned with the 10-yr Yield unless we see a sharp widening in yield spreads.
SPY Surges to a New High
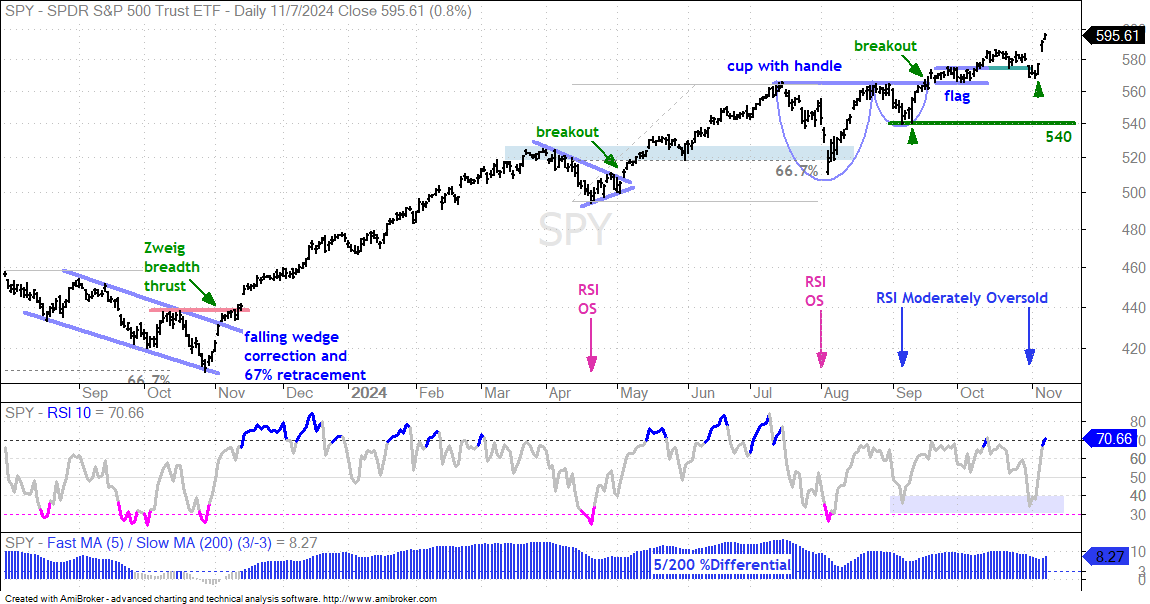
There is no change with SPY. This key market benchmark remains in a long-term uptrend and I do not see a trading setup, such as a tradable pattern or an oversold condition. The last patterns were the cup-with-handle and the flag, while the last oversold condition occurred in late October. This means we are in the monitoring and waiting stage.
QQQ Extends on Triangle Breakout (Plus XLK, MAGS)
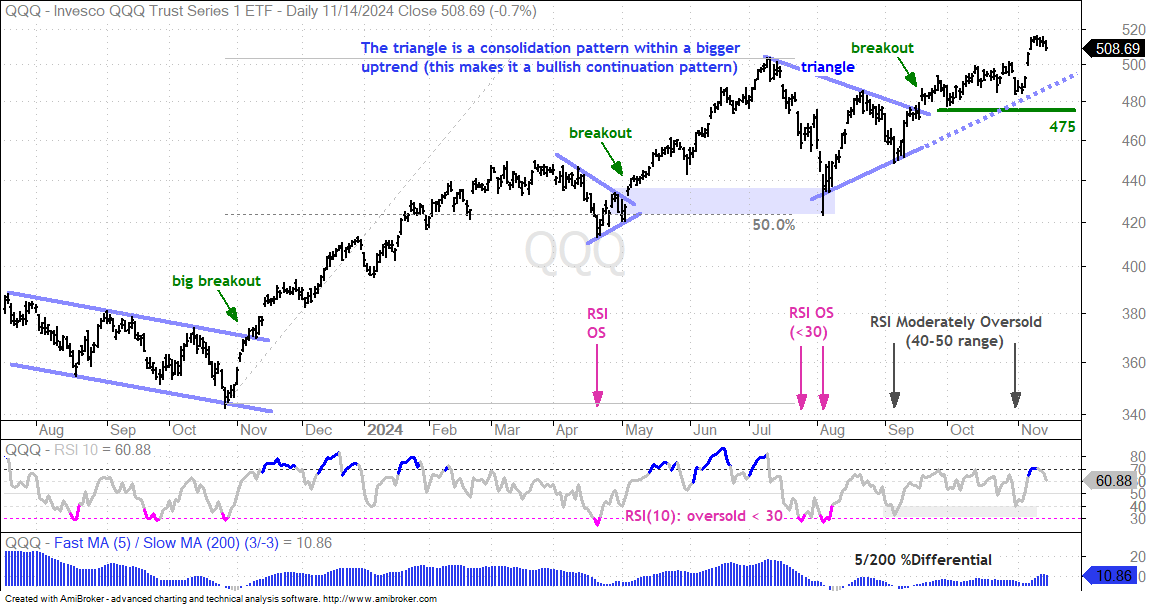
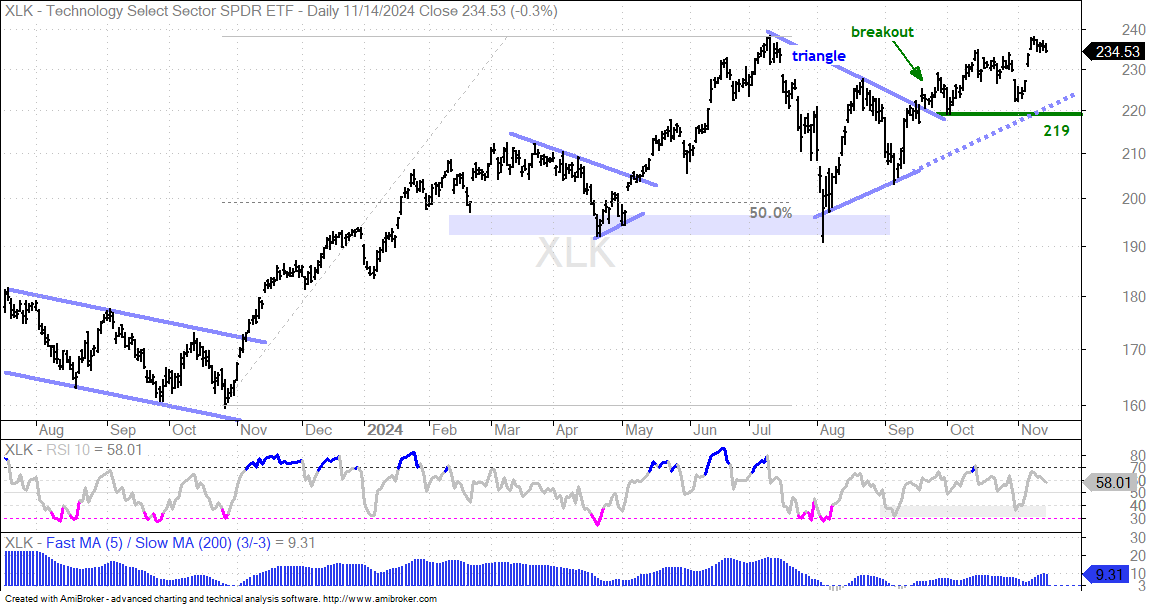
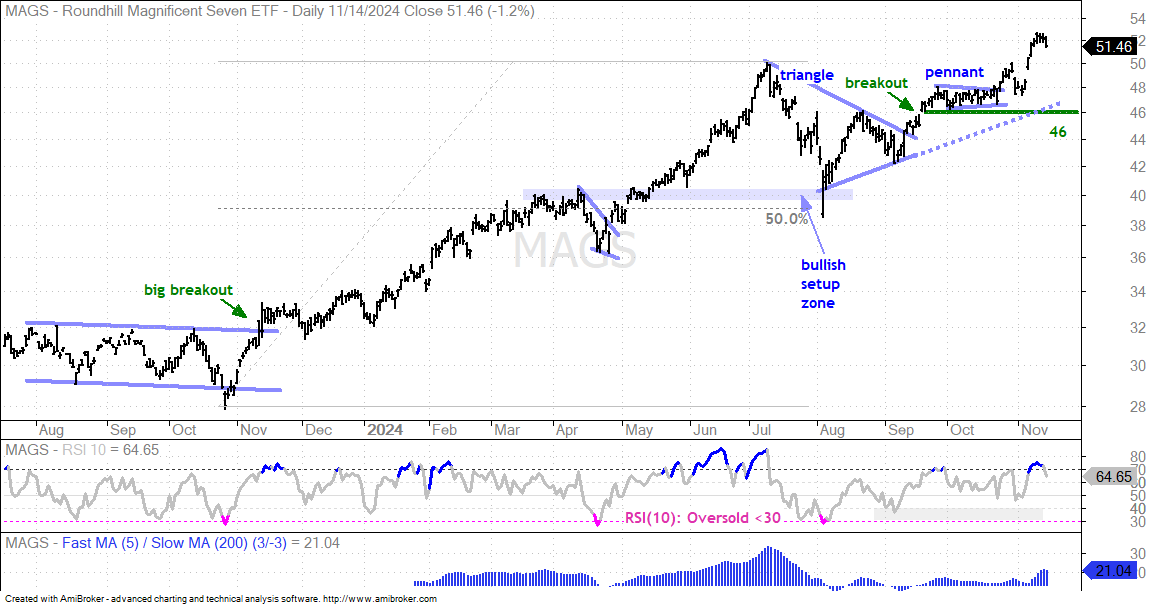
There is also no change for QQQ, the Technology SPDR (XLK) and Mag7 ETF (MAGS). They are in long-term uptrends and I do not see any pattern setups or oversold conditions right now. Overall, all three hit new highs in July, consolidated into mid September with triangles and broke out in the second half of September. The triangle breakouts signaled an end to the consolidation periods and a resumption of the bigger uptrends. The October lows mark key support levels to watch going forward.
QQQ broke triangle resistance with a surge on September 19th, worked its way higher into late October and surged to a new high this week. Triangles are bullish continuation patterns that represent consolidations within the trend. This pattern formed within a long-term uptrend and the breakout signaled a continuation of this uptrend. I am marking re-evaluation support at 475. This week’s new high simply affirms the ongoing uptrend and there is no setup on this chart right now.
The next chart shows XLK with support marked at 210. XLK has yet to hit a new high, but the triangle breakout clearly held and this signal remains valid.
The next chart shows MAGS with a pennant breakout in late October and a surge to new highs last week. Key support remains at 46.
Semiconductor ETF Remains a Drag
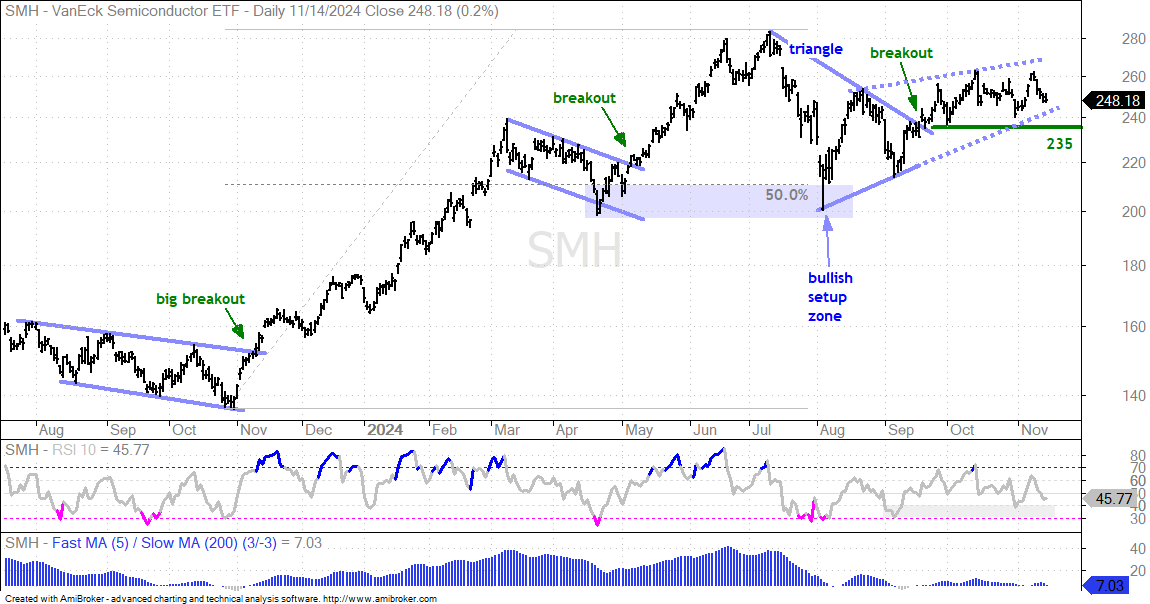
The Semiconductor ETF (SMH) is dragging its feet, but remains with a triangle breakout. As with the other tech ETFs, SMH broke out in the second half of September. In contrast to the tech ETFs, SMH did not extend higher and did not challenge its July high. This is concerning, but the triangle breakout has yet to be proven otherwise (wrong). The August trendline and October lows mark support at 235 and I will stick with the bulls as long as this level holds. The dashed lines mark the alternative pattern at work: a rising wedge. A support break would confirm this pattern and signal a continuation of the July decline. Next support would be in the 200 area.
Software, Cyber, Fintech and Cloud Become Extended
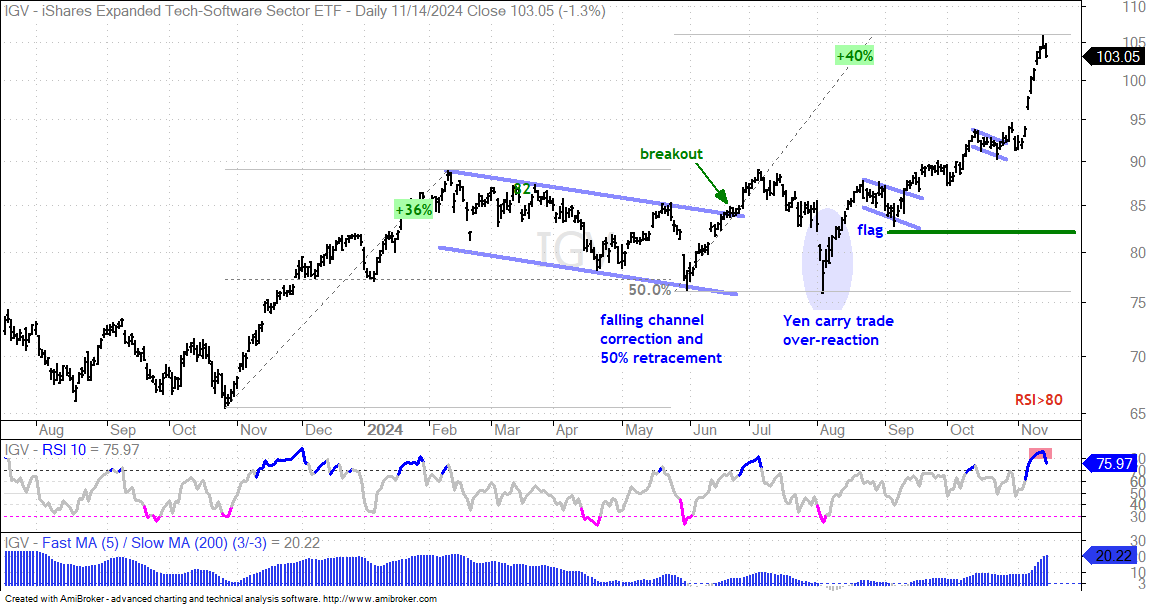
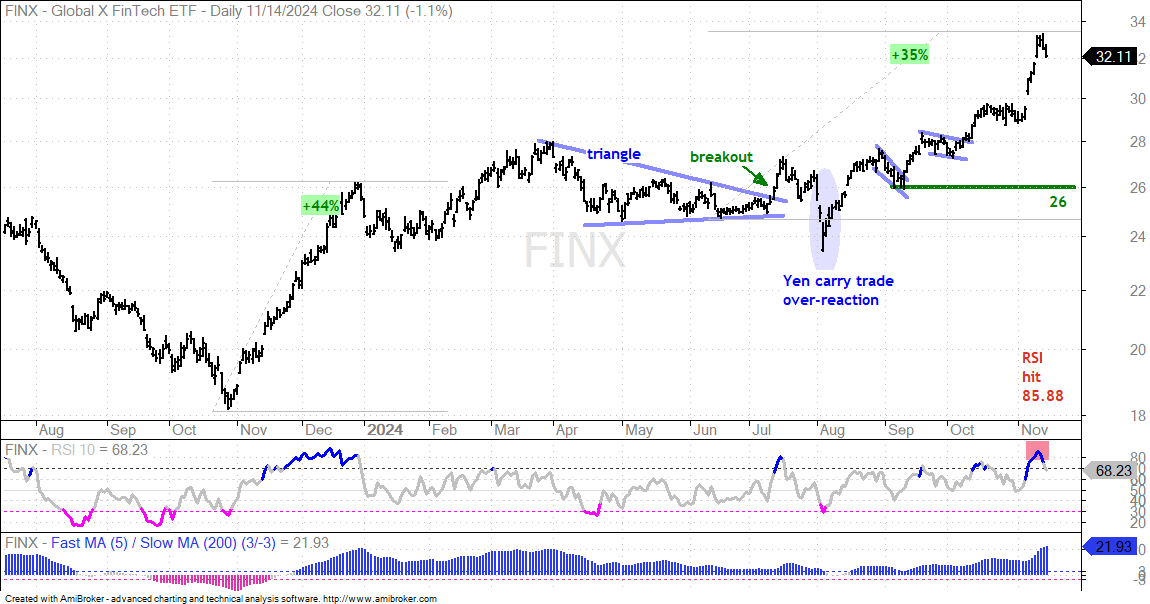
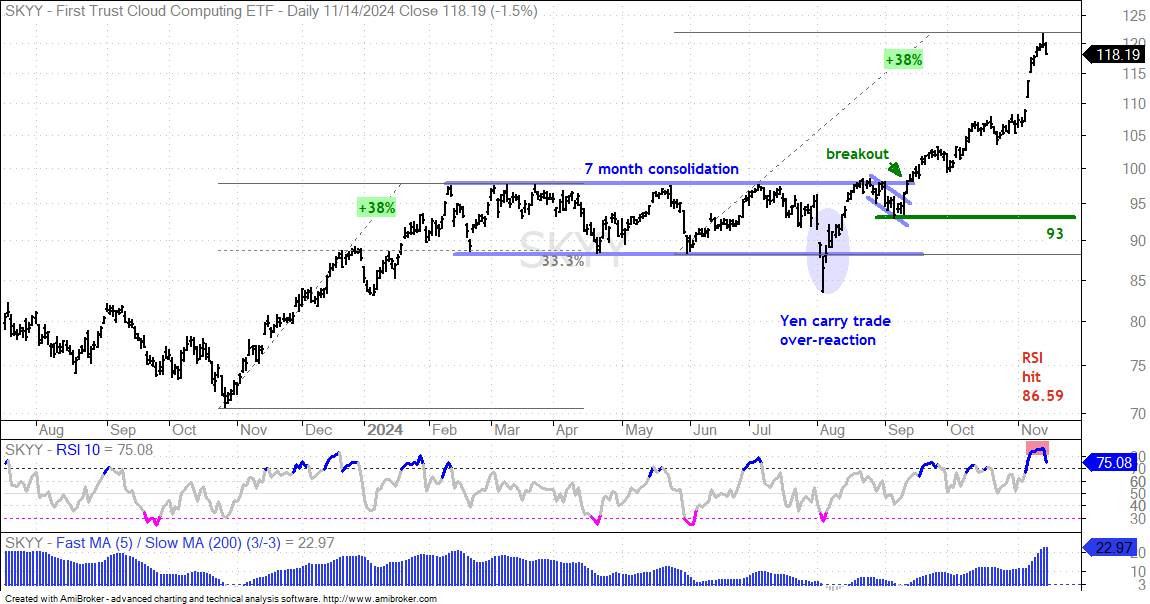
There is extended and then there is seriously EXTENDED. The Software ETF (IGV), FinTech ETF (FINX) and Cloud Computing ETF (SKYY) were in leading uptrends before the election and they exploded higher after the election. These explosive moves pushed RSI(10) above 85 this week. Truth be told, we do not need a momentum oscillator to know that these ETFs are very extended after big moves. Overextended and overbought are not bearish conditions. These conditions simply increase the odds for a corrective period, which could involve a pullback or consolidation. All three are in strong uptrends so a pullback would present an opportunity, not a threat.
The chart below shows IGV surging 15% from late October to mid November. Note that Palantir (PLTR) surged over 40% and this stock accounts for 4.35% of the ETF. IGV is now up around 40% since the late May low and RSI exceeded 85 during the week. I am marking the 40% move from the late May low and ignoring the early August plunge, which was brought on by the Yen carry trade scare. In any case, IGV is strong and leading, but there is no setup on the chart and price is very extended.
The next chart shows FINX with a 35% advance from mid July to mid November. A 15% surge in six days punctuates this move, as does an RSI move above 85. As with IGV, FINX is in a strong and leading uptrend, but very extended and I do not see a setup on the chart.
The next chart shows SKYY with similar characteristics.
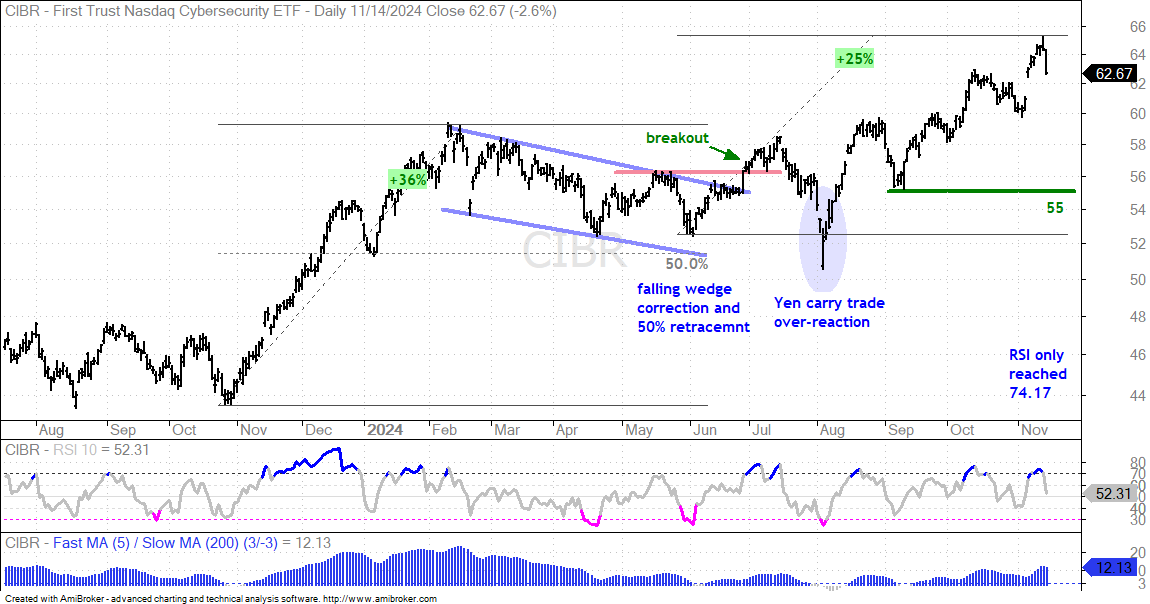
The next chart shows CIBR with similar characteristics. Note, however, that RSI only reached 74.17 and did not become excessively overbought. Nevertheless, CIBR still looks extended and I do not see a setup on this chart.
Healthcare and Defense Move Sharply Lower
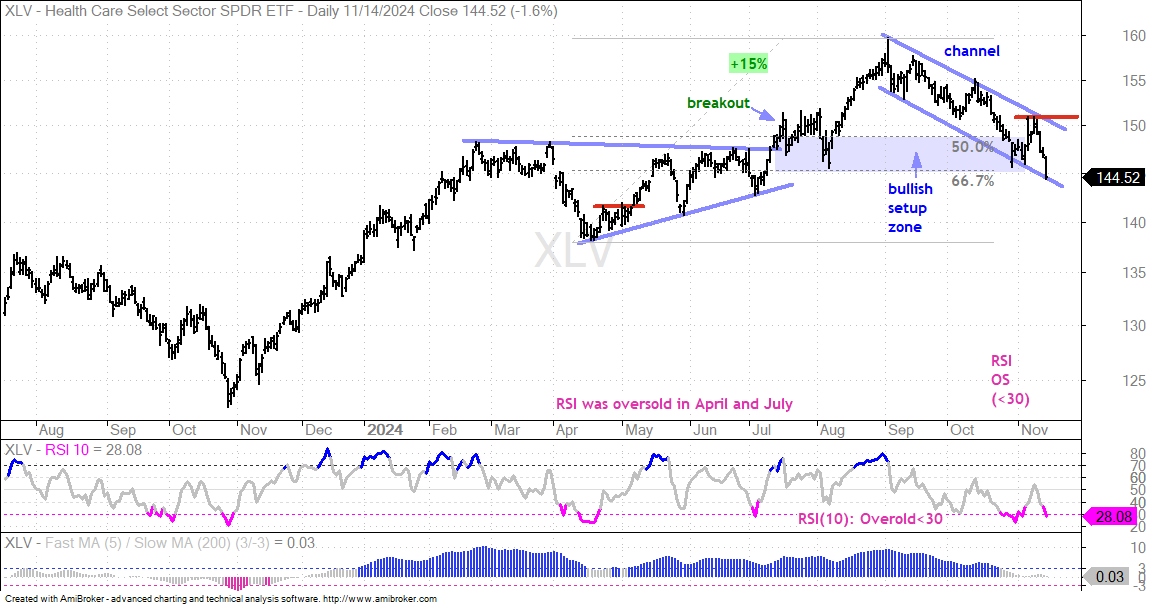
The Healthcare and Defense industries are under pressure with the regime change in Washington. While I do not want to make any policy predictions, note that the Healthcare SPDR (XLV) is down 3.8% so far this week and the Aerospace & Defense ETF (ITA) fell 3.1% on Thursday. The department of Health and Human Resources and the Department of Defense come to mind here.
On the chart below, XLV is still in a long-term uptrend but the falling channel continues to fall with the decline accelerating the last three days. XLV closed below the bullish setup zone and RSI is back below 30. It is short-term oversold, but in a strong downtrend since mid September. Channel resistance is marked at 151 and a breakout here is needed to forge a reversal.
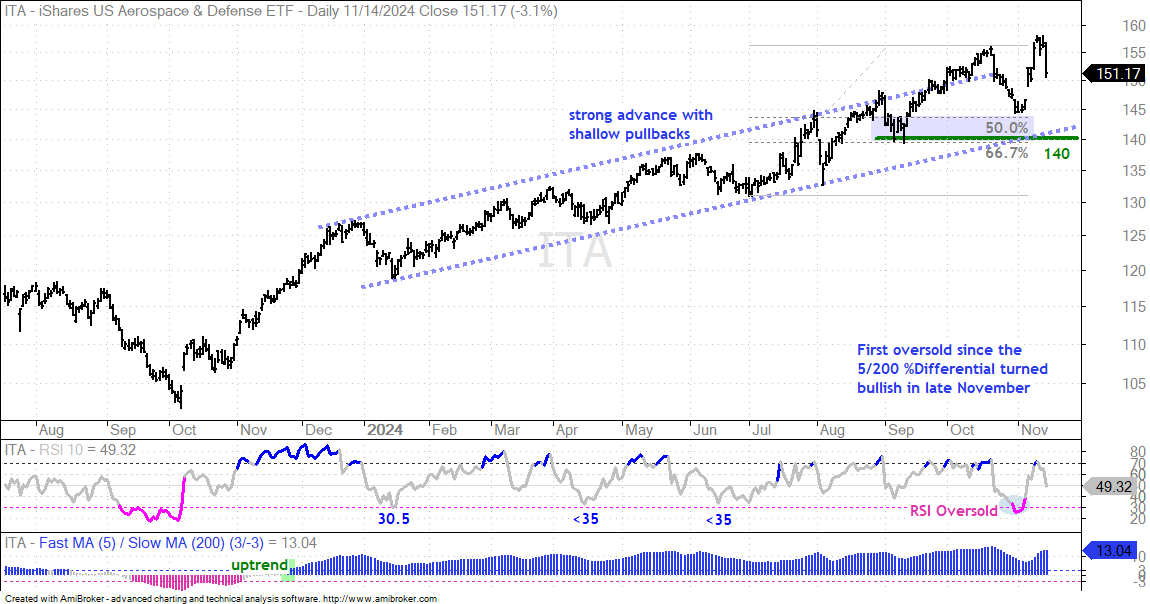
I featured the Aerospace & Defense ETF (ITA) on November 1st as it neared the bullish setup zone and RSI became oversold. It surged with the rest of the market after the election and then fell 3.1% on Thursday. The long-term trend is still up, but this group could see some volatility in the coming weeks. Long-term support is set at 140.
Copper, Base Metals and Palladium Get Slammed
Copper and Based Metals were hit hard as the markets priced in the potential for US tariffs to weigh on Chinese growth (demand). Note that China consumes half of the world’s copper. The threat of tariffs is real, but the actual tariffs are still months away and there will be negotiations. I have no idea how US-China relations will evolve because there are many variables at work.
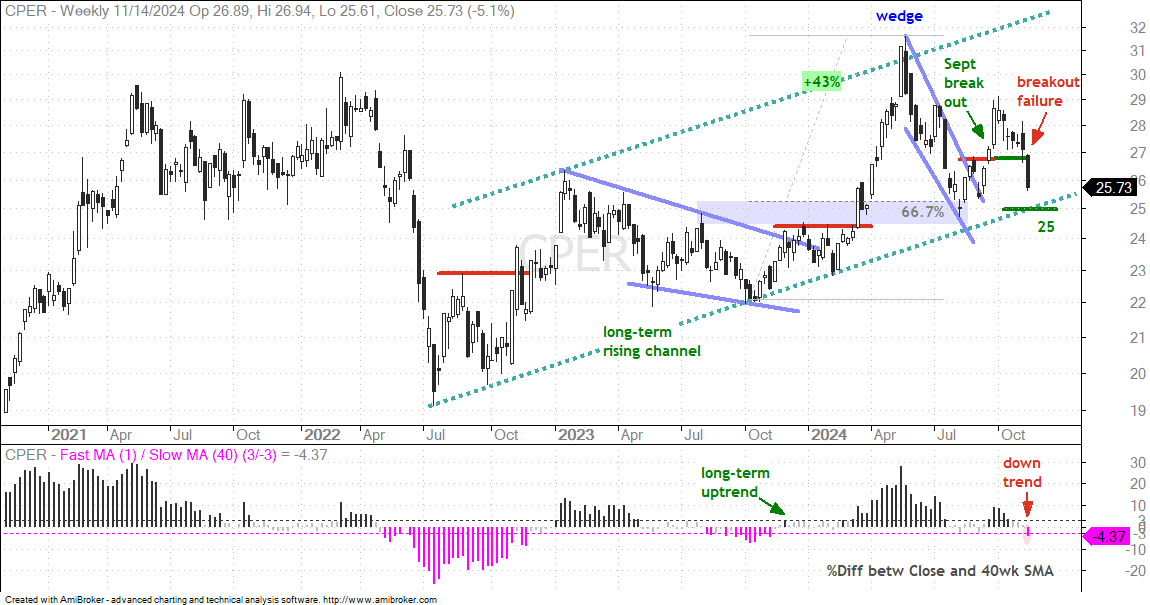
Today’s chart shows weekly candlesticks to keep some perspective. The Copper ETF (CPER) remains within a rising channel, but the ETF is poised for a weekly close that is more than 3% below its 40-week SMA (bottom window). The ETF is still within a large rising channel and I am marking long-term support at 25. A break here would target a move to the low 20s. Medium-term, CPER surged and broke out in September. This was the breakout that turned me bullish. CPER then fell back to the breakout zone in October and firmed for a few weeks. This was the short-term setup (post breakout pullback). A strong breakout should hold and CPER did not hold the September breakout zone. The ETF fell sharply this week and negated the breakout. This trade did not work out.
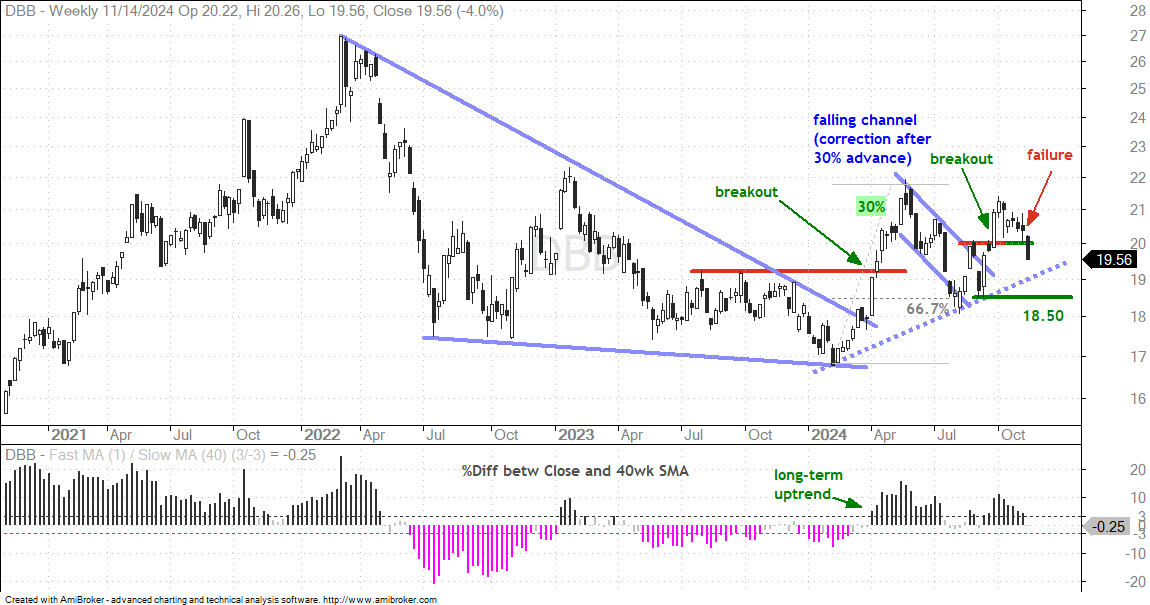
The next chart shows the DB Base Metals ETF (DBB) with a falling channel breakout in September and a pullback to the breakout zone in October. This breakout level (20) did not hold as DBB fell over 3% this week. The failed breakout is a short-term negative, but the long-term trend remains up. Notice that the Close/40-week %Differential is still positive. As with CPER above, I am using the September low to mark long-term support at 18.50. The Copper Miners ETF (COPX) and related stocks will move in tandem with copper and base metas.
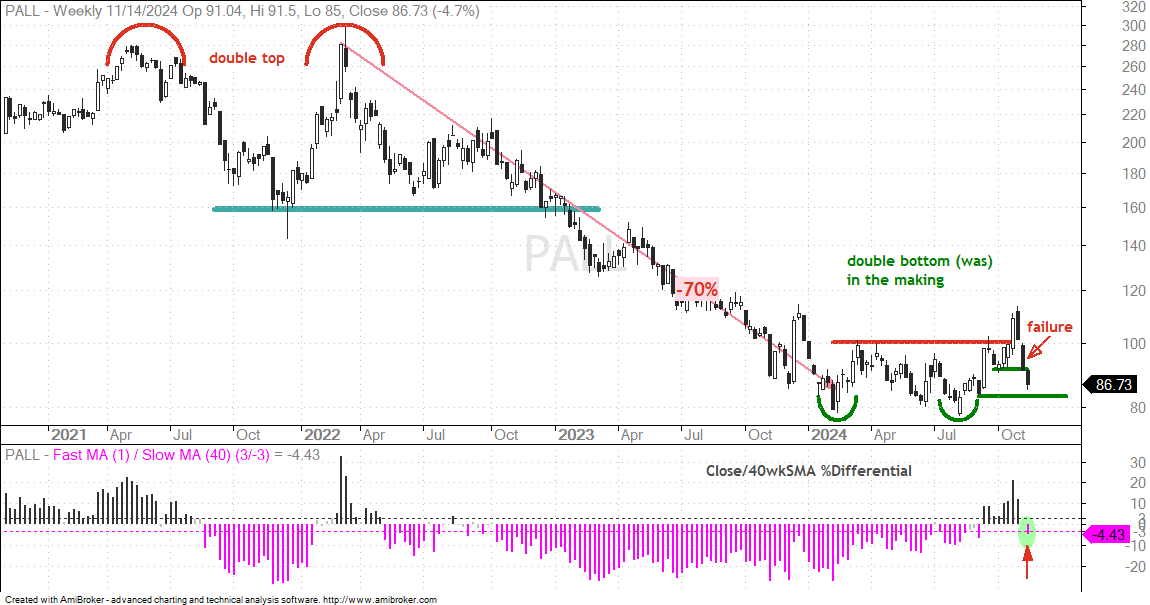
The next chart shows the Palladium ETF (PALL) with a double bottom and a breakout four weeks ago. This breakout failed as the ETF fell sharply the last three weeks. A pullback after a surge is normal, but PALL broke the early October low (red arrow). As with CPER and DBB, I am using the September low to mark long-term support at 83. A break here would erase the majority of the breakout move and reverse the long-term uptrend. Notice that PALL is already over 5% below its 40-week SMA (see bottom window).
CCEP Reverses at Bullish Setup Zone
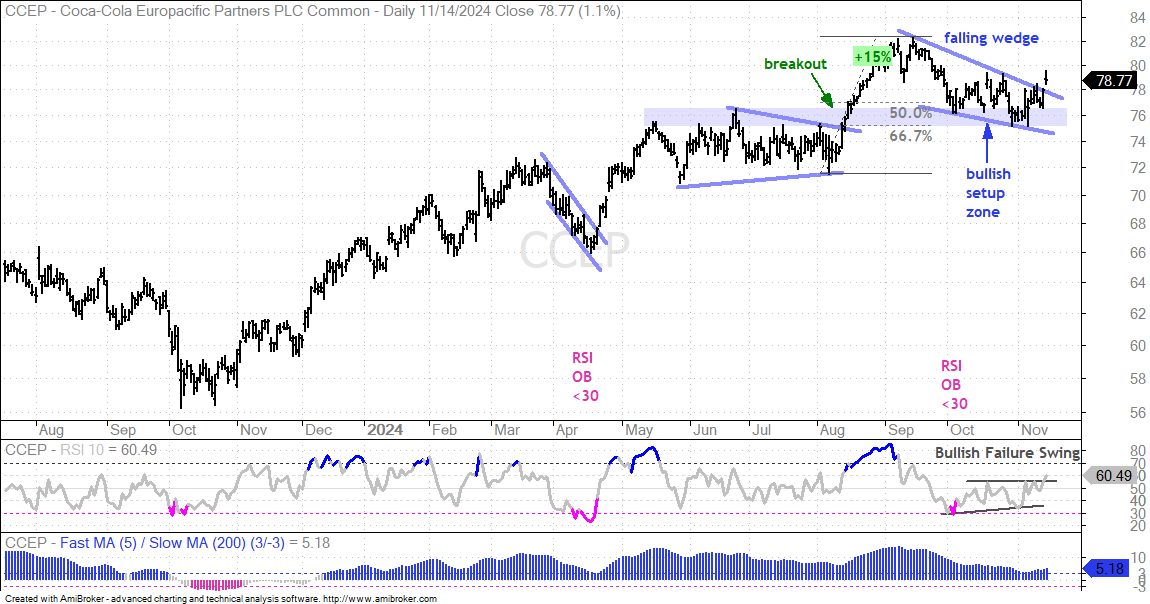
The next chart shows Coca-Cola EuroPacific Partners (CCEP), which is part of the Consumer Staples SPDR (XLP). Overall, the stock is in a long-term uptrend and hit a new high in mid September. After a 15% advance, the stock corrected with a falling wedge that retraced 50-67% and returned to the breakout zone (broken resistance). The blue shading marks this bullish setup zone in the 75-77 area. The falling wedge is typical for a correction within an uptrend. CCEP broke out with a surge on Thursday. This signals an end to the correction and a continuation of the bigger uptrend.
The indicator window shows RSI with a bullish failure swing, which is a setup/signal found in Welles Wilder’s 1978 book (New Concepts in Technical Trading Systems). This pattern forms when RSI dips below 30 to become oversold and then bounces. It then pulls back, but holds above 30 on the pullback. A subsequent move above the prior high triggers a momentum breakout. This is a short-term bullish reversal pattern.
CSX Surges for Big Breakout
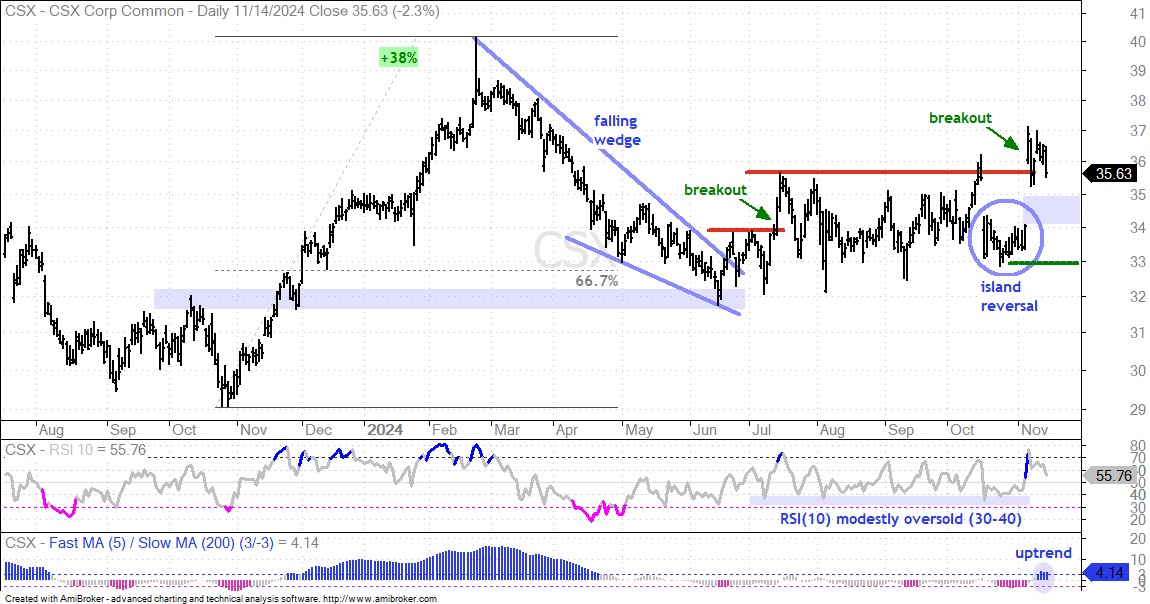
The next chart shows CSX Corp (CSX), which is a railroad stock and part of the Industrials SPDR (XLI). CSX surged 38% from late October to late February and then corrected pretty hard with a falling wedge that retraced over 66.7%. The stock ultimately found support near the November breakout zone and firmed in June-July. A breakout occurred in mid July, but there was no follow through as the stock moved into a trading range, which lasted almost four months. After a gap down in mid October, CSX firmed for a few weeks and then gapped up. This triggered an island reversal and a breakout. I view this breakout as bullish and would expect a run towards the February high. I will mark re-evaluation support at 33. The blue shading marks a throwback zone (34-35) to watch should CSX pull back. A throwback to this area would offer a better risk-reward profile.
DDOG Bids to Reverse Extended Downtrend
The next chart shows Datadog (DDOG), which is part of the Cloud ETF (CLOU). The stock led the market from early November 2023 to early February with a 78% surge. What looked like a normal corrective wedge in March-April turned into a long falling channel (red dashed lines). Despite the duration of the decline, the stock retraced around 50% of the 78% advance. Most recently, DDOG advanced 25% into mid October and formed a flag into mid November. I view this flag as a bullish continuation pattern. A close above 132 would break the flag line and also trigger a bigger channel breakout. I would then mark re-evaluation support at 120.
GLD becomes Oversold with Free Fall
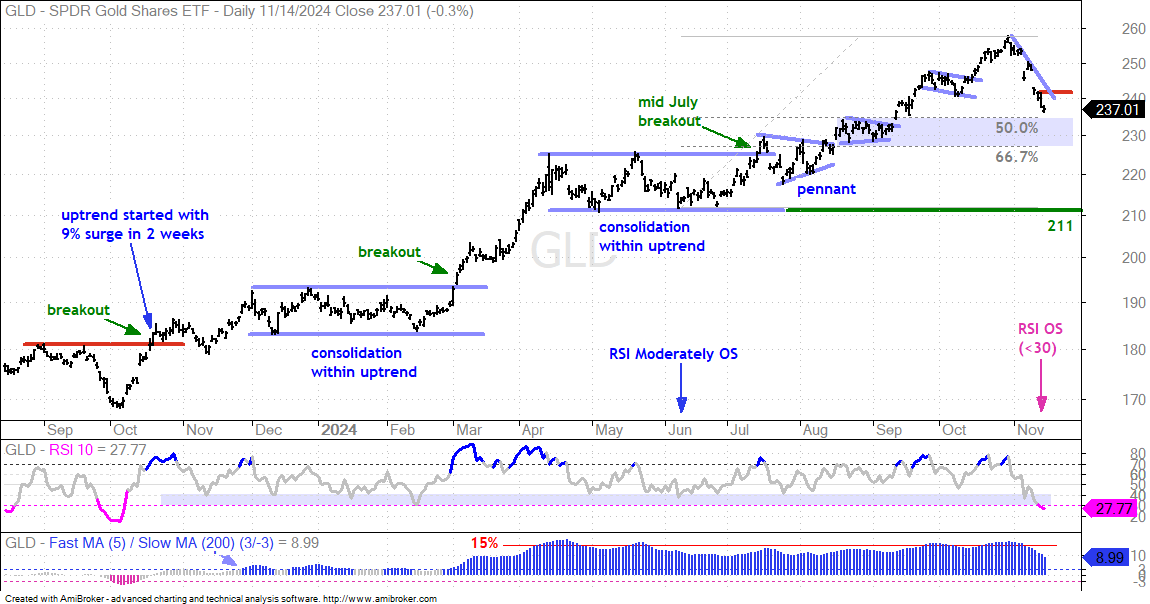
The Gold SPDR (GLD) and other metals got slammed in November with GLD falling 8% the last 11 days. This decline pushed RSI below 30 for the first time since October. It is also the steepest 11-day decline since March 2020. GLD is basically in a free fall with the next support zone in the 230 area (blue shading). Support here stems from the August consolidation and the 50-67 percent retracement zone. With the long-term trend up, this area is considered a Bullish Setup Zone that chartists can watch for firming and a potential short-term reversal. My concern here is that long-term trends often start with violent moves. Notice how the long-term uptrend started with a massive surge in October 2023. GLD is oversold and ripe for a bounce, but this outsized move could be the start of a bigger decline.
TLT Extends Downtrend
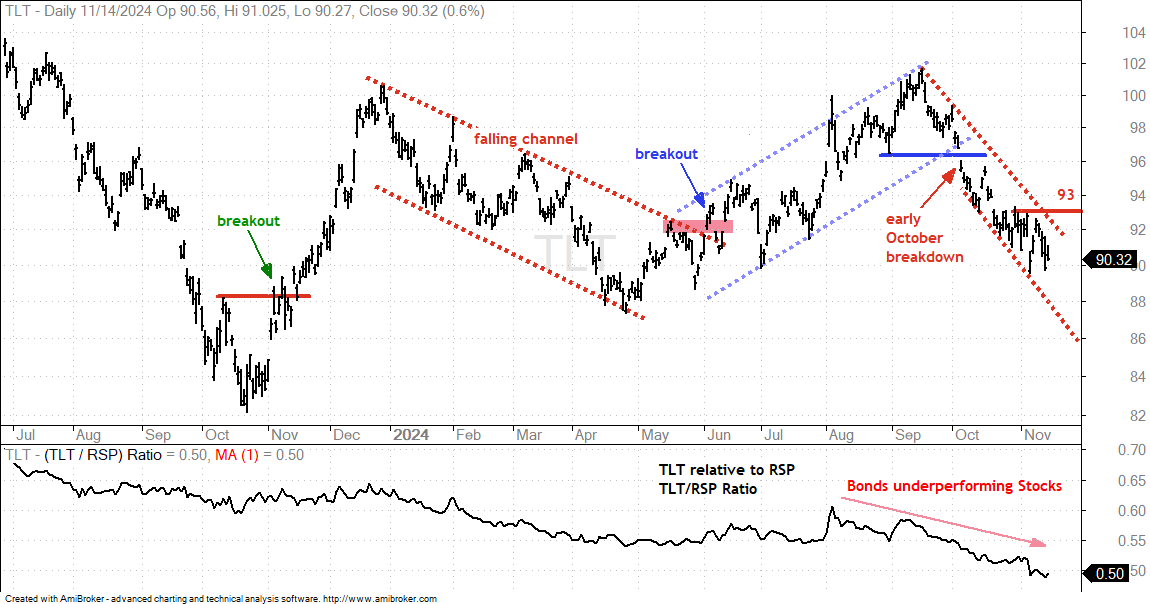
There is no change in the 20+ Yr Treasury Bond ETF (TLT). TLT remains in a downtrend since the breakdown in early October. The chart below shows daily bars with four big swings. TLT surged from mid October to December 2023, fell from January to April, advanced from May to mid September and fell since mid September. The red channel lines define the steep downtrend with resistance marked at 93. A breakout here is needed to reverse the downtrend. Note that TLT is underperforming the S&P 500 EW ETF (RSP), which means stocks are outperforming bonds. This is positive for stocks.
Bitcoin Surges to Another New High
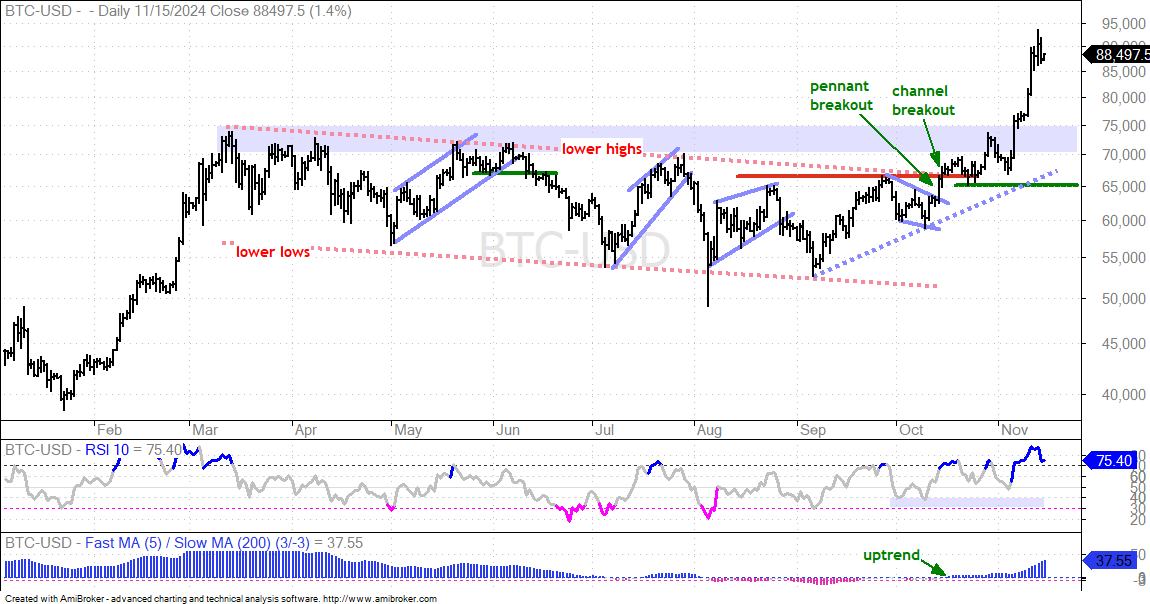
There is no change on the Bitcoin chart as it broke out in the second half of October and surged to new highs again this week. Overall, Bitcoin worked its way lower with a large falling channel from March to September and reversed the long-term downtrend with a breakout in mid October. After stalling around the breakout zone for two weeks, Bitcoin surged again the last three weeks and hit new highs. The big broken resistance turns into first support in the 70,000-75,000 area (blue shading). I am leaving key support at 65000. This is based on the October low and September trendline.