Chart Trader Weekly Report – Broad Market Analysis, Leading Groups (ETFs), Chart Setups and Trading Ideas (Premium)
Posted By
Arthur Hill, CMT
On
In
Archive |
No Comments
Video and Report Headlines
Composite Breadth Model Remains Bullish
69% of S&P 500 Stocks in Uptrends
BBB Spread Remains Near Lows (narrow)
Sharp Rise in 10-yr Yield Could be Headwind for Stocks
SPY Fails to Hold Flag Breakout
Five Indicators to Watch for Oversold Conditions
Trends, Conditions, Patterns, Breakouts and Waiting
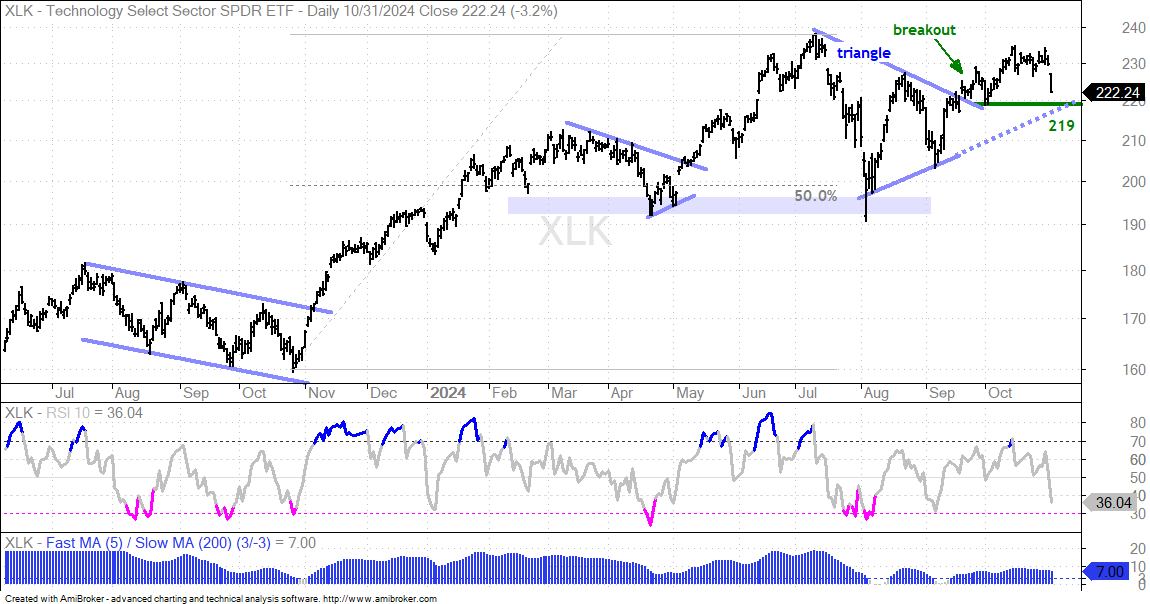
QQQ, MAGS and XLK Remain with Triangle Breakouts
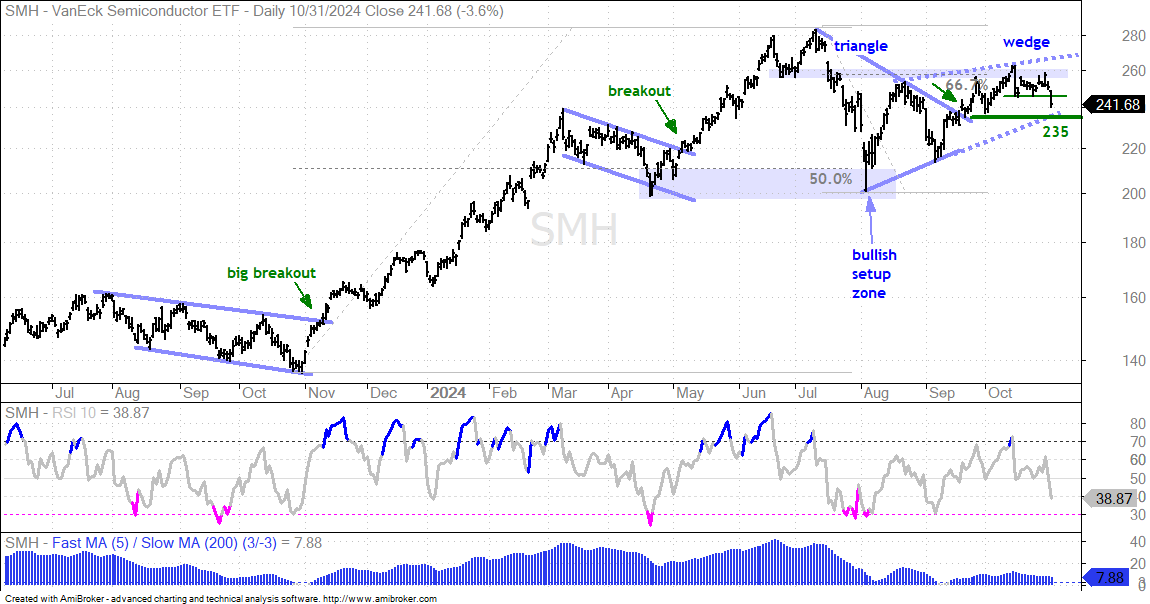
A Bearish Wedge for SMH
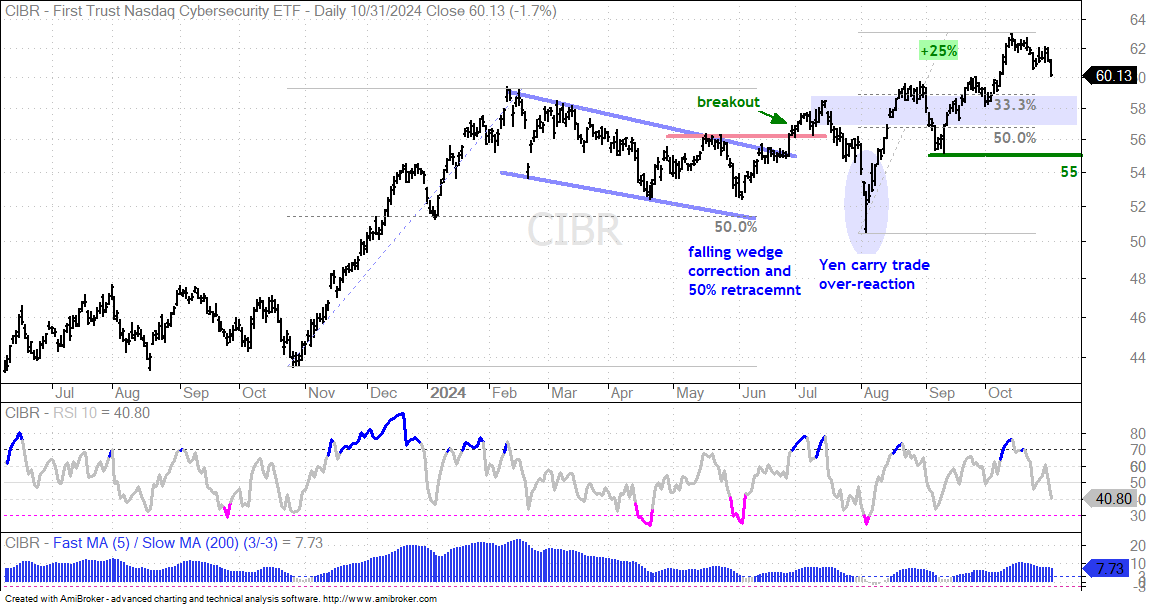
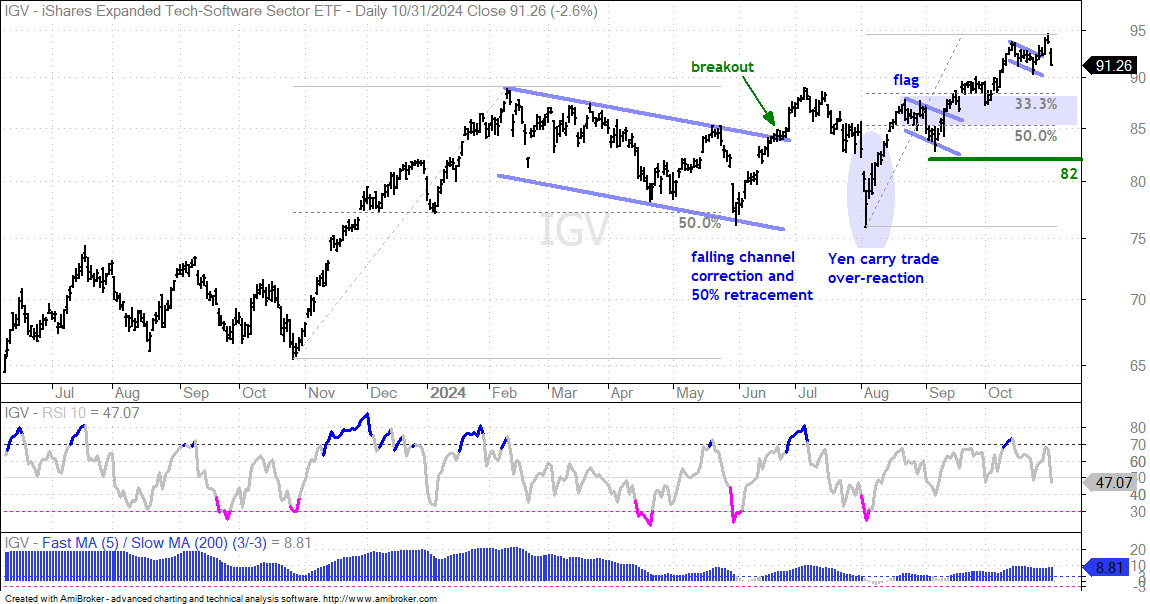
Retracement Zones for Cyber, Software, Fintech and Cloud
XLV Enters Bullish Setup Zone
Amgen Firms at Support Zone
GE Healthcare Hits Bullish Setup Zone
ITA Becomes Oversold for the First Time
INDA Corrects with Falling Wedge
Copper Firms Near Bullish Setup Zone
GLD Remains Extended
TLT in Downtrend after Channel Break
Bitcoin Extends on Breakout
The next Weekly Report will be posted on Friday morning, November 8th.
The weight of the evidence remains bullish for stocks, but a correction is underway as Treasury yields surge and semiconductors weigh on the largest sector. Semis account for 35.57% of the Technology SPDR and this sector accounts for 32.24% of the S&P 500. We will review the long-term breadth indicators and show some short-term breadth indicators to watch for oversold conditions. Names hitting bullish setup zones include XLV, GEHC, AMGN, ITA, INDA, CPER and COPX.
Composite Breadth Model is Bullish
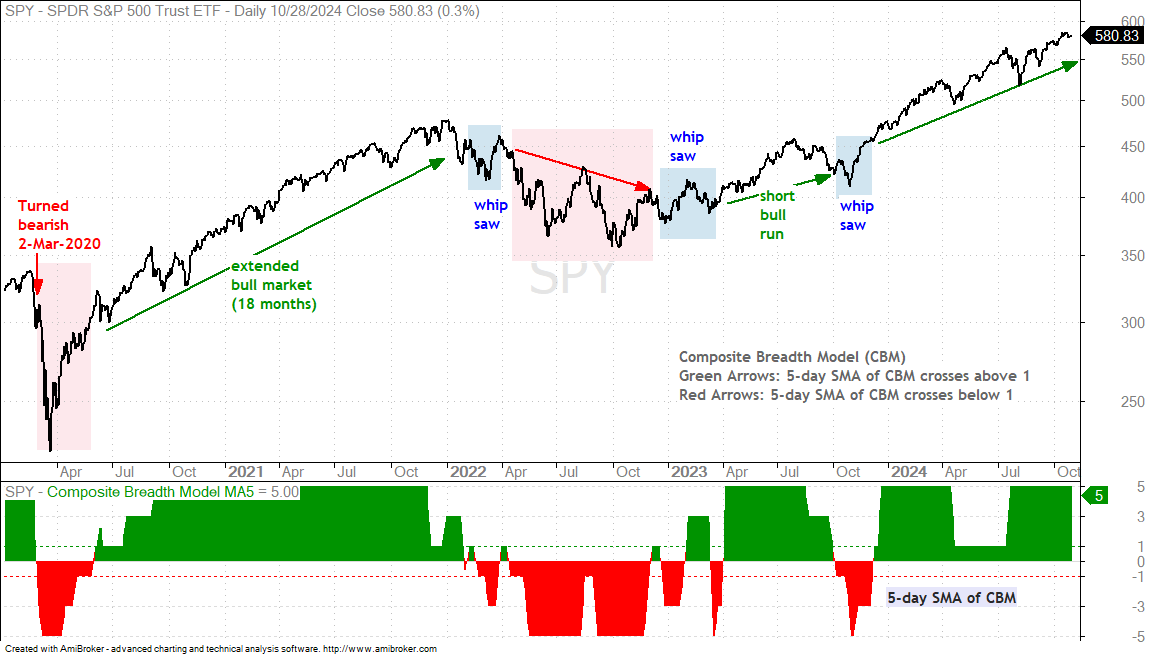
The chart below shows SPY with the 5-day SMA of the Composite Breadth Model at +5. This model turned bullish on December 7th and remains bullish. A positive CBM signals a favorable environment for stocks (bull market). Even within a bull market, we can still see pullbacks, corrections, volatility, rotations and trading ranges.
The Composite Breadth Model aggregates[1] signals in over a dozen breadth indicators from the S&P 500 and S&P 1500. This means it covers large-caps, mid-caps, small-caps, NYSE stocks and Nasdaq stocks. It ranges from +5 to -5. A bull market is present when the 5-day SMA of the CBM is at +1 or higher. A bear market is present when below +1.
69% of S&P 500 Stocks in Uptrends
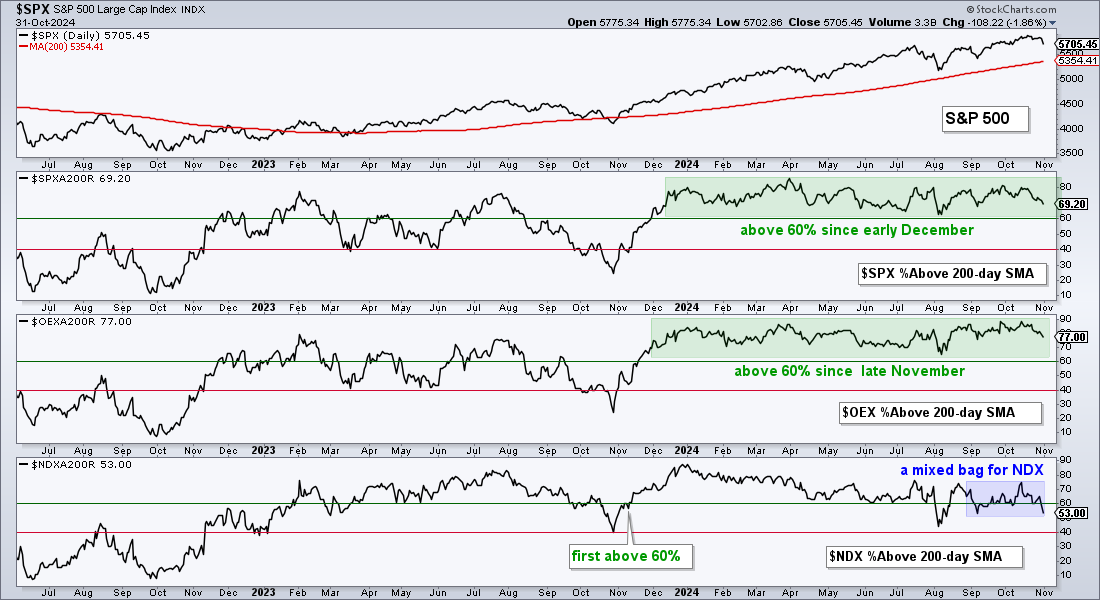
The chart below shows the percentage of stocks above the 200-day SMA for the S&P 500, S&P 100 and Nasdaq 100. These are the big three when it comes to large-caps. Institutions drive large-caps and large-caps drive the market. For now, the S&P 500 and S&P 100 are strong with over 65% of stocks above their 200-day SMAs. Both have been above 60% since early December (green shading). NDX %Above 200-day is still net bullish at 53%, but Nasdaq 100 stocks are struggling at bit because some 47% are below their 200-day SMAs. Despite a sizable pocket of weakness within the Nasdaq 100, the weight of the evidence is still long-term bullish for this indicator trio.
BBB Spread Remains Near Lows (narrow)
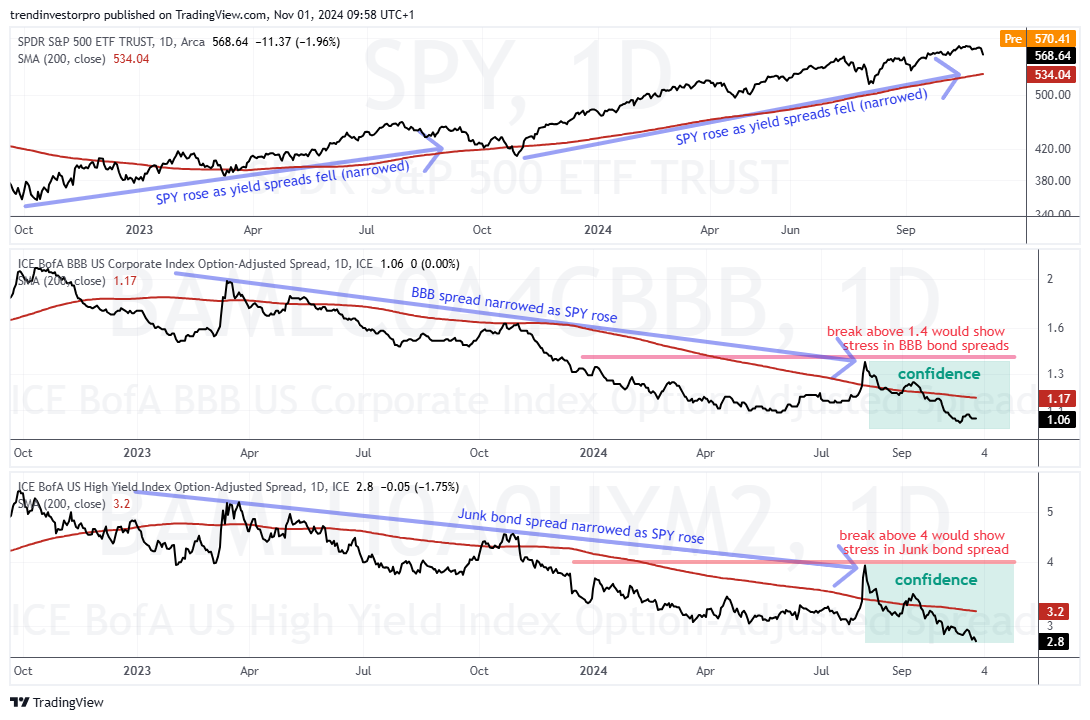
There is no change in the yield spread charts. The BBB and Junk bond spreads fell to new lows in October and remain near these lows. This means the spreads narrowed and this shows confidence in the corporate bond market, which is bullish for stocks. This confidence is reflected in the Finance SPDR (XLF), which is one of the strongest sectors right now.
These spreads show the difference between a corporate bond yield (BBB) and the equivalent US Treasury bond yield. BBB bonds are the lowest rated investment grade bonds. US Treasuries are the ultimate safe-haven bonds. The spread between these two widens (rises) when stress builds in the corporate bond market. This is negative for stocks. The spread narrows (falls) when stress levels are low or subsiding. This is positive for stocks.
Sharp Rise in 10-yr Yield Creates Headwind for Stocks
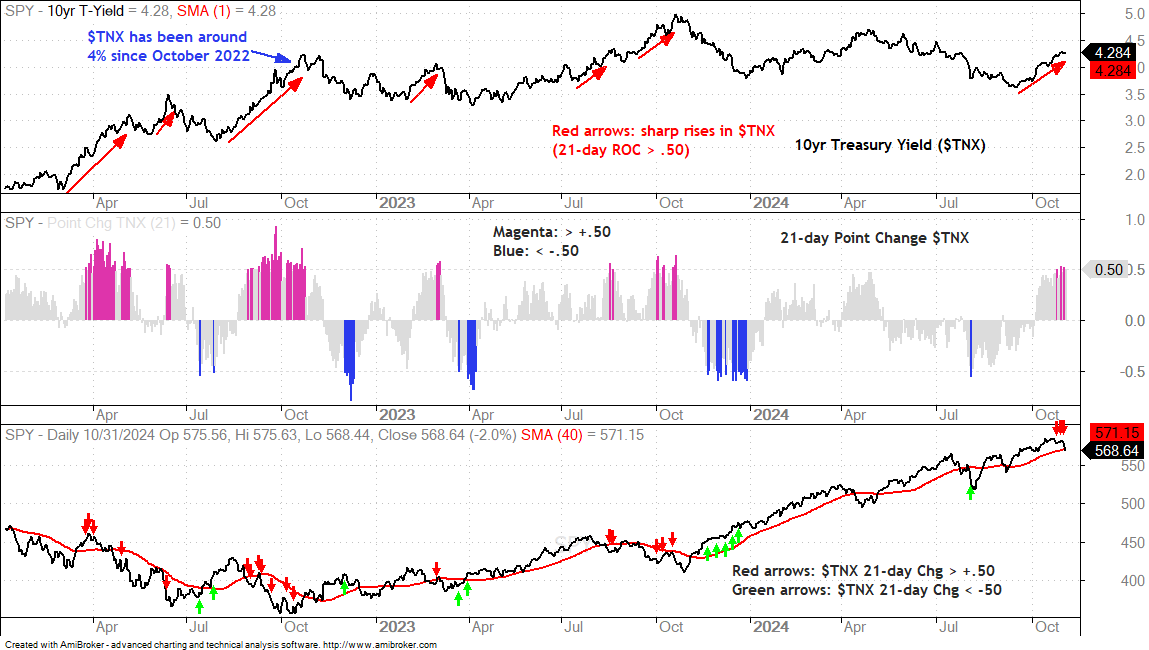
Despite narrow yield spreads, the bond vigilantes became active over the last few weeks and pushed the 10-yr Treasury Yield ($TNX) above 4.20%. The move above 4% is not as important as the speed of the move. There were seven exceptionally sharp rises over the last three years (red arrows) and these coincided with weak periods for the S&P 500. We can quantify the speed of these moves by showing the 21-day Point-Change for $TNX (middle window). This indicator turns magenta when it exceeds .50 (sharp rise) and blue when it exceeds -.50 (sharp fall). A move from 3.8% to 4.23% would be a .53 point rise.
The bottom window on the chart above shows SPY. Red arrows show when $TNX rose sharply in 21 days and the green arrows show sharp falls. Notice that the sharp rises typically mark periods of weakness for SPY, while the sharp falls led to strength. Stocks like it when the 10yr Yield falls sharply, but do not like it when it rises sharply, which is the case right now. The 21-day Point Change for $TNX exceeded .50 three times in the last six days.
Flag Breakout Fails as SPY Falls Sharply
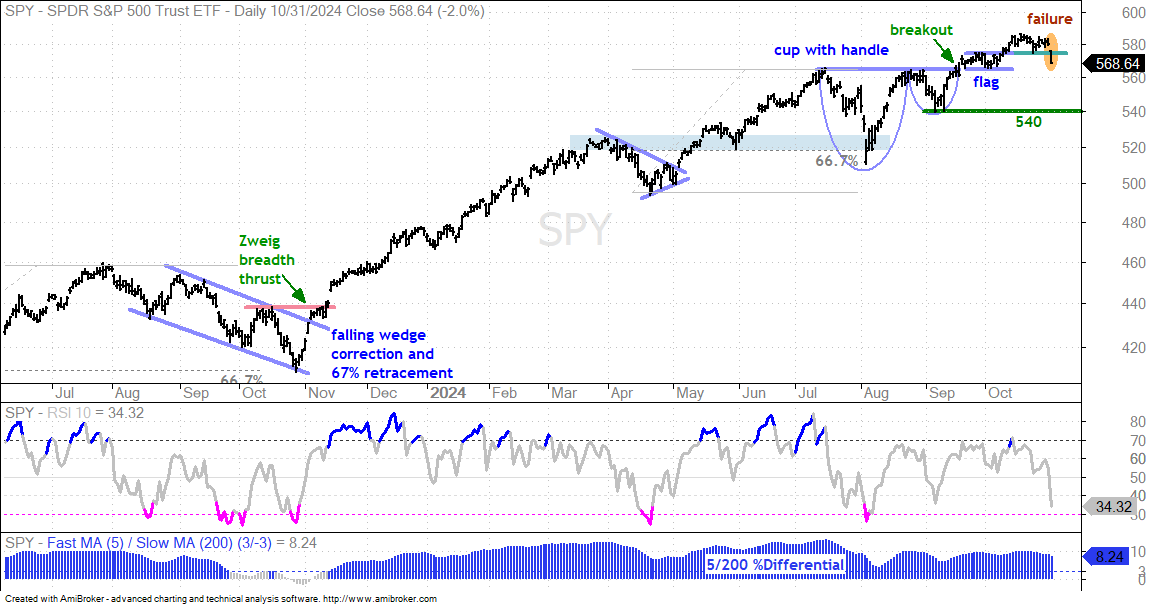
The cup-with-handle breakout remains in play for SPY, but the flag breakout failed and the sharp rise in the 10-yr Treasury Yield is creating a headwind. On the price chart, SPY broke flag resistance three weeks ago and then stalled above the breakout zone. There was no follow through as buying pressure quickly subsided. Short-term, the flag breakout (broken resistance) turns first support (574) and Thursday’s break below this level means the flag breakout failed. This calls for a corrective period. The long-term trend is still up so a decline is still considered a correction and more of an opportunity than a threat. Once a correction is underway, I will turn to RSI and short-term breadth indicators to identify an oversold condition. Notice how RSI(10) dipped below 30 in mid April and early August.
The indicator windows show RSI(10) and the 5/200 %Differential. The latter tells us the direction of the long-term trend. It turns bullish with a move above +3% (blue) and remains bullish until a move below -3% (magenta). This long-term trend indicator has been bullish since February 2023. It dipped into negative territory in October, but did not exceed -3%. This signal threshold helps to reduce whipsaws and stay with the bigger trend. RSI is used to identify oversold conditions during a long-term uptrend. It turns magenta with a move below 30. I typically ignore overbought readings because overbought conditions are normal in strong uptrends.
Five Indicators to Watch for Oversold Conditions
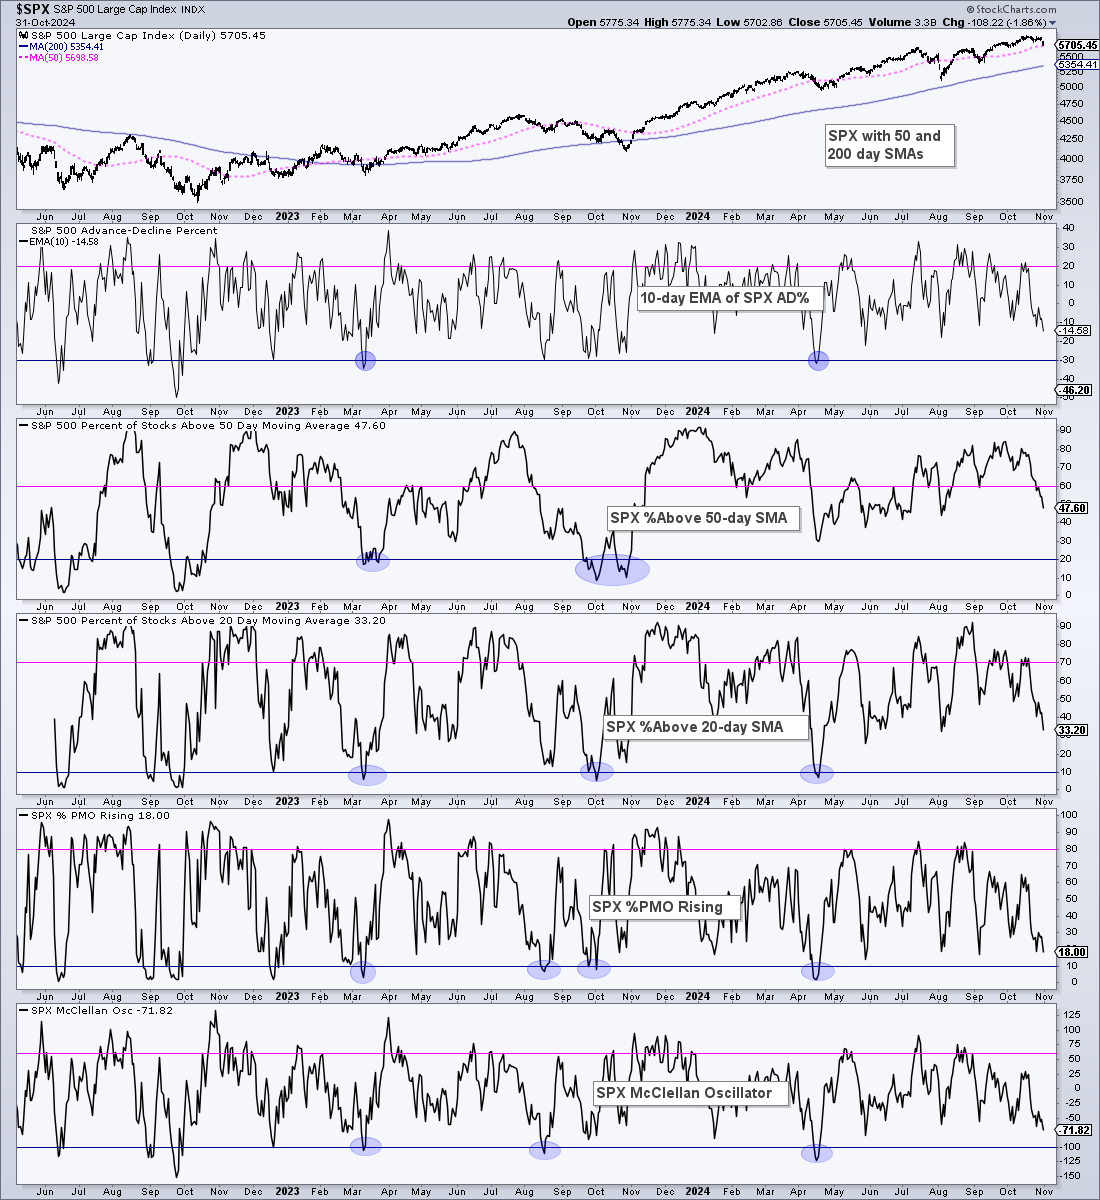
The next chart shows five breadth indicators for identifying oversold conditions. These are all based on the S&P 500. Each indicator shows a low threshold to mark oversold conditions and an upper threshold for a signal. For example, SPX %Above 50-day SMA becomes oversold with a move below 20% and triggers bullish with a subsequent move above 60% (pink line). It is important to have a signal threshold because indicators can become oversold and remain oversold. An oversold reading is the first step. It serves as an alert that conditions are ripening for a bounce. We then need to use other methods or indicator thresholds to identify the start of a bounce.
As you can see from the chart above, four of the five indicators were oversold in April 2024 (blue ovals). None of these indicators became oversold in August because the dip and recovery were so sharp. Currently, none of the indicators are oversold. There is no guarantee that we will get to oversold conditions, but I will be watching these as the current pullback unfolds.
Trends, Conditions, Patterns, Breakouts, Watch and Wait
There are numerous methods to identify tradable setups on the charts. I have narrowed my approach to two methods. First, combine the long-term trend with short-term conditions by looking for opportunities when an ETF or stock is oversold within a long-term uptrend. For example, look for RSI(10) to dip below 30 when the 5/200 day SMA Differential signals a long-term uptrend. QQQ was in a long-term uptrend and became oversold in mid April and early August.
The second method is to look for bullish continuation patterns within long-term uptrends. These include flags, triangles, pennants (small triangles), falling wedges, falling channels and flat trading ranges. We usually have to trade the breakout when dealing with patterns. QQQ formed a smaller triangle consolidation and broke out in May. It also formed a larger triangle in July-August and broke out in mid-late September.
The long-term uptrends remain for QQQ and SPY, the last oversold conditions were in early August and the last pattern breakouts were in mid-late September. Thus, I am currently in the watch and wait mode. Watch mode means setting levels that would negate the pattern breakouts and call for a re-evaluation. Wait mode means waiting for the next pattern or oversold condition.
QQQ, MAGS and XLK Remain with Triangle Breakouts
Unless otherwise noted, the following ETFs and stocks are in long-term uptrends, as defined by the 5/200 %Differential in the bottom window. In general, I am not concerned with divergences, high values or low values. This is simply a trend filter designed to weed out names in long-term downtrends.
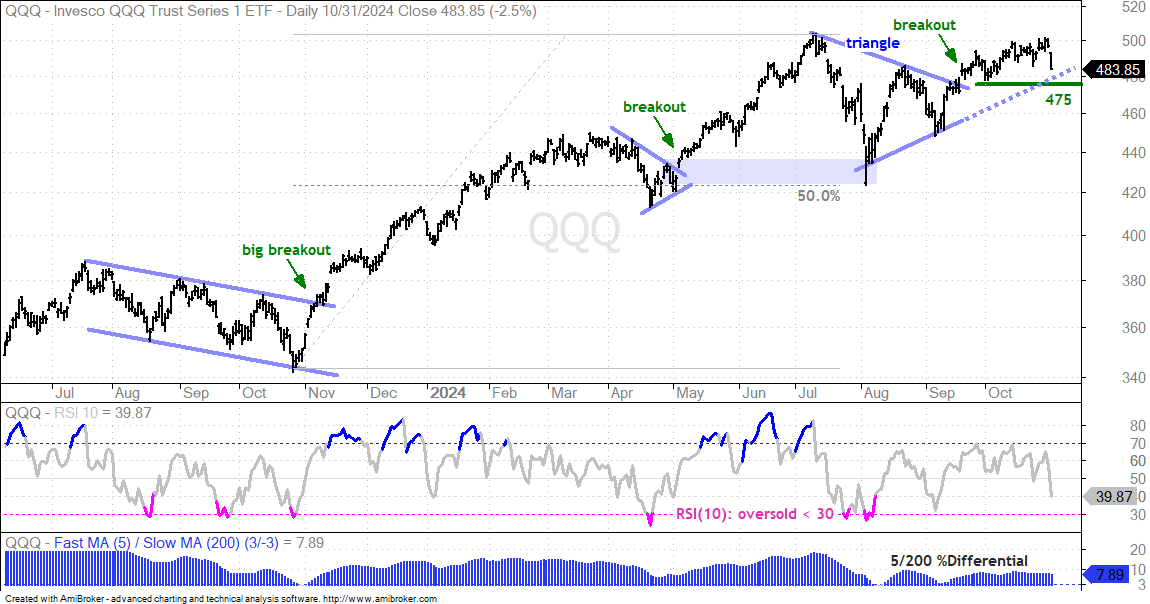
The triangle breakout remains the active pattern for QQQ and I do not see a setup right now. This means I am in watch mode. Triangles are consolidation patterns that take their directional bias from the long-term trend, which is up. A break signals an end to the consolidation and a resumption of the uptrend. QQQ broke out in mid-late September and this breakout is holding.
QQQ remains in a long-term uptrend, per the 5/200 %Differential in the bottom window. The triangle breakout is the active signal medium-term. A triangle consolidation within a long-term uptrend is a bullish continuation pattern. As such, the triangle breakout signals a continuation of the long-term uptrend and new highs are expected.
Follow through has been a struggle the last four weeks, but the breakout has yet to be proven otherwise. I am raising my re-evaluation level to the October low. A close below 475 would negate this breakout and call for a re-evaluation. I would then go into wait mode: wait for an oversold condition or tradable setup.
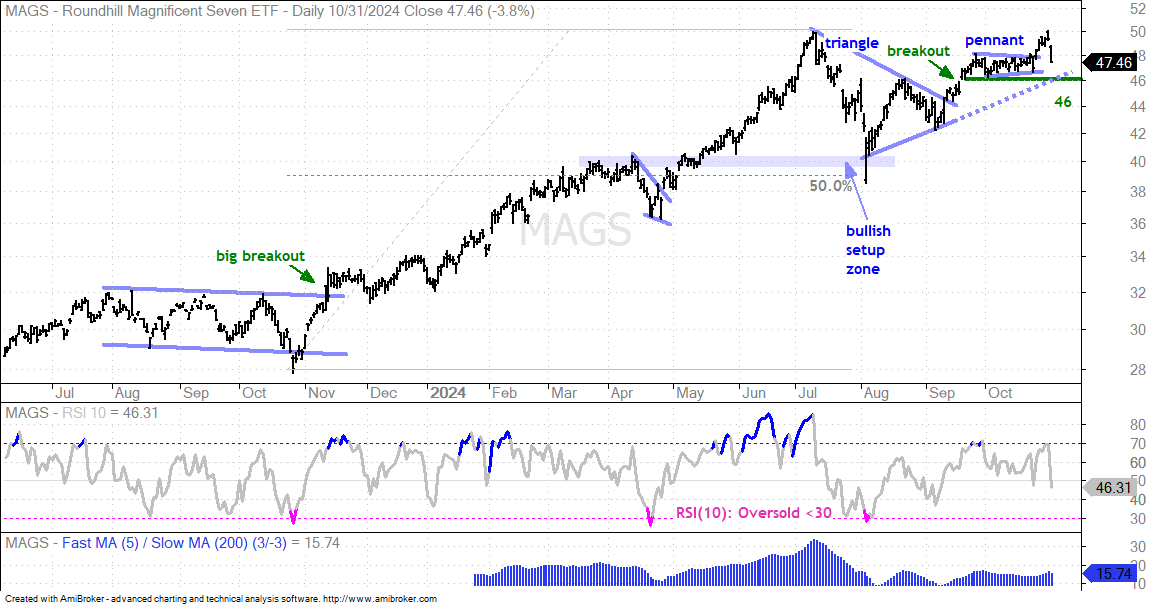
The next chart shows the Mag7 ETF (MAGS) with similar characteristics and re-evaluation support marked at 46. Short-term, MAGS broke out of a pennant consolidation, with help from TSLA and GOOGL. However, weakness in MSFT, APPL and META is weighing.
The next chart shows the Technology SPDR (XLK) with similar characteristics and support marked at 219.
A Bearish Wedge for SMH
The next chart shows the Semiconductor ETF (SMH) with a triangle breakout around 240 and further gains to the 260. This triangle breakout remains the dominant chart pattern and the breakout is holding. Even so, a bearish continuation pattern is lurking in the shadows (must be Halloween). I am showing the rising wedge (dashed lines) on the SMH chart because the advance off the August low retraced a little over 66.7% and returned to the mid July support break (blue shading). A 2/3 retracement is normal for a counter-trend bounce and broken support turns into resistance. Together, these mark a bearish setup zone that could give way to a reversal. SMH broke the mid October low with a sharp decline on Thursday and this is the first sign of a reversal. Wedge support is set at 235 and a break here would confirm the pattern. And negate the triangle breakout. Technically, a wedge break would target a move to the 190 area. I am not a big fan of targets. Instead, I would become interested in SMH should it trade to the low 200s.
Retracement Zones for Cyber, Software, Fintech and Cloud
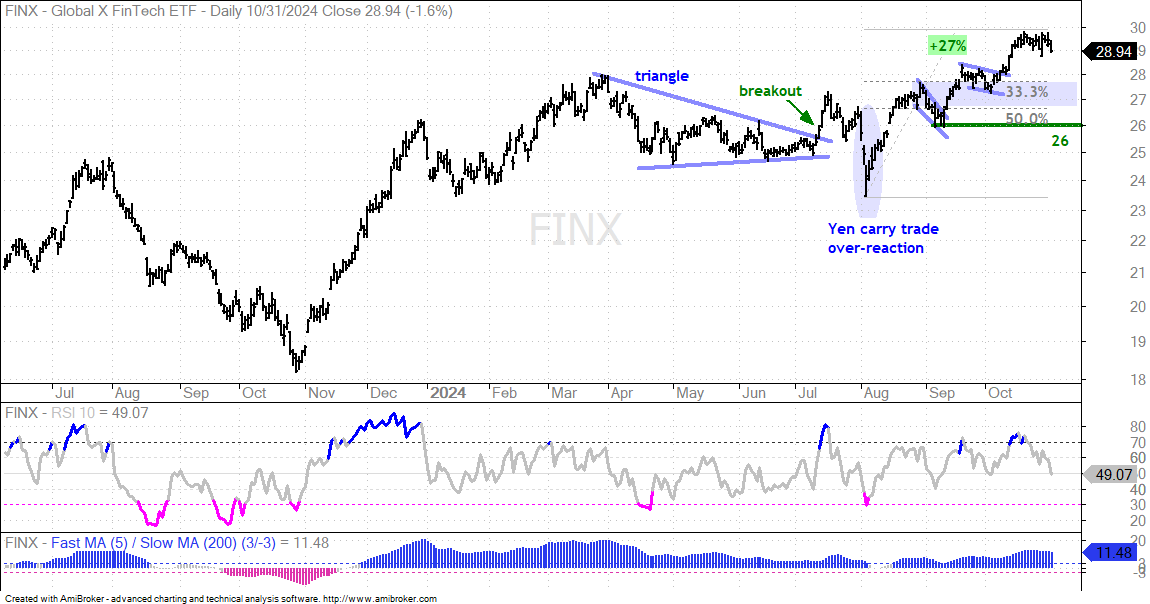
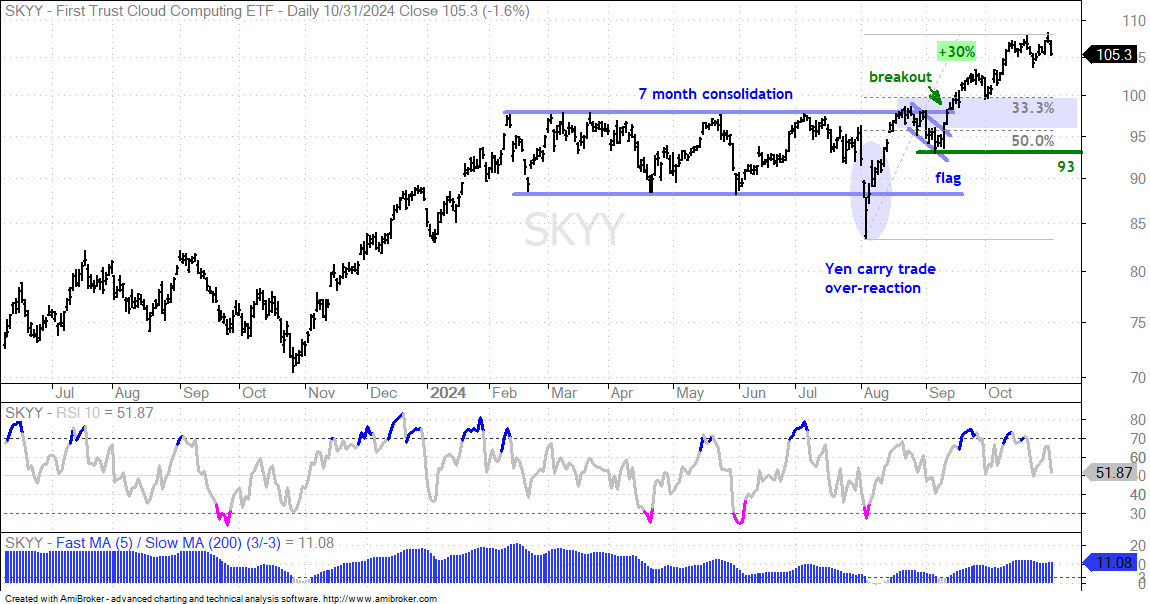
The Cybersecurity ETF (CIBR), Software ETF (IGV), FinTech ETF (FINX) and Cloud Computing ETF (SKYY) are leading within the tech sector because they hit new highs in October. All four advanced over 20% from the August low to the October high and became short-term overbought. This is NOT a trading setup because overbought conditions are normal within an uptrend. Overbought conditions just mean we are in the watch and wait phase. I am using the September lows to mark key support for these ETFs. The blue shading marks a possible Bullish Setup Zone based on the 33-50 percent retracement zones, broken resistance and support levels. Should we get a pullback, these are the first areas to watch for opportunities. The first chart shows CIBR with support marked at 55 and the Bullish Setup Zone around 58.
The next chart shows the Software ETF (IGV) with support at 82 and the Bullish Setup Zone in the 85-87 area.
The next chart shows the FinTech ETF (FINX) with support marked at 26 and the Bullish Setup Zone in the 27 area.
The next chart shows the Cloud Computing ETF (SKYY) with support marked at 93 and the Bullish Setup Zone in the 96-100 area.
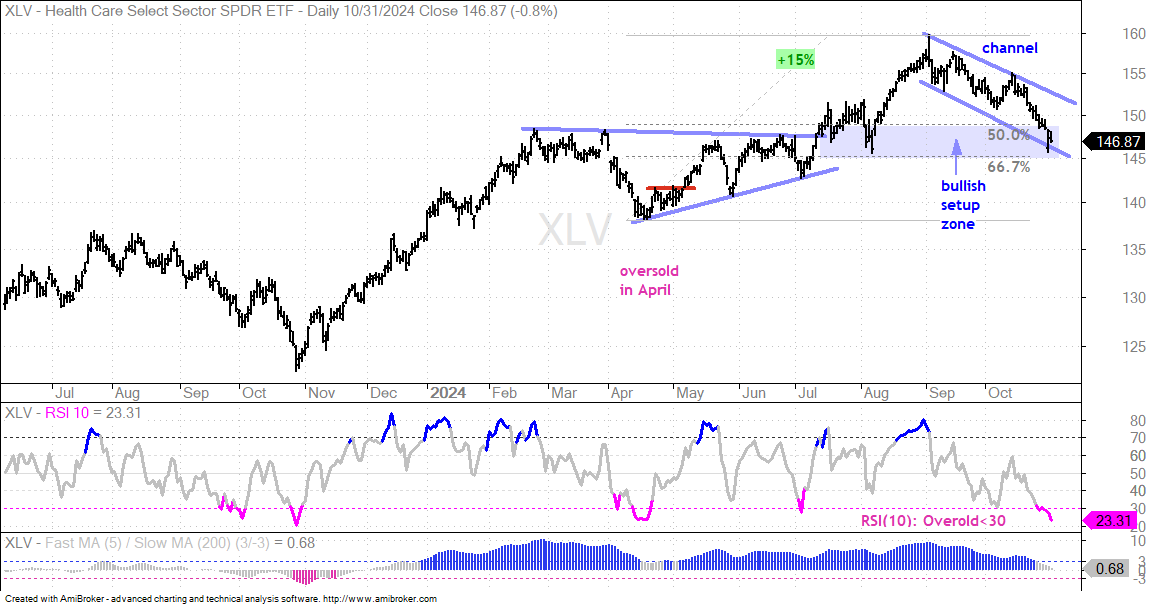
The Healthcare SPDR (XLV) hit a Bullish Setup Zone as it correcting with a falling channel that retraced 50-67 percent of the April-September advance. RSI also became oversold with a dip below 30. Thus, a setup is in the making and I will be watching for firmness and some sort of upside catalyst. XLV also became oversold in mid April, but did not get a short-term breakout or upside catalyst until mid May. Sometimes these setups take time to evolve. Also note that the sector components are quite mixed over the last few months. AbbVie (ABBV), Incyte (INCY) and Bristol Meyers (BMY) are surging, while Regeneron (REGN), Eli Lilly (LLY) and Merck (MRK) are falling.
Amgen Firms at Support Zone
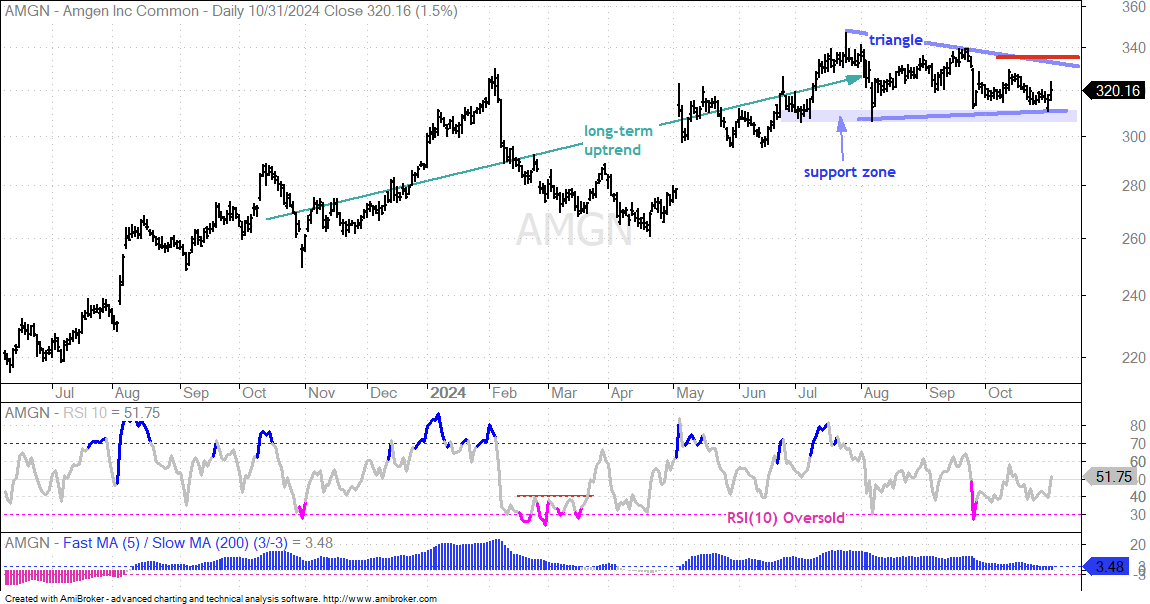
The next chart shows Amgen (AMGN), which reported earnings on Thursday. The long-term trend is up and the stock formed a triangle consolidation after hitting a new high in July. This triangle represents a rest within the bigger uptrend and a breakout at 335 would be bullish. Such a breakout would signal an end to the rest and a resumption of the uptrend. Short-term, AMGN is testing support in the 310 area. This support zone extends back to the July lows. A surge off support would provide the first sign that Amgen is going to attempt a triangle breakout.
GE Healthcare Hits Bullish Setup Zone
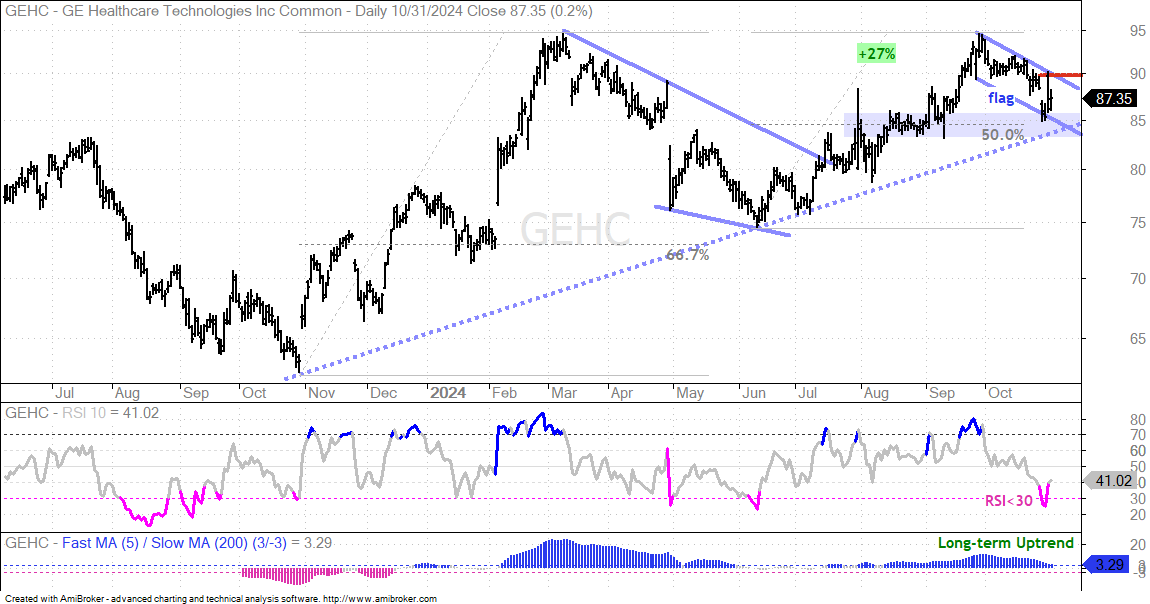
The next chart shows GE Healthcare (GEHC) advancing 27% into September and hitting resistance from the March high around 95. The stock fell back into October and this decline looks like a correction within a bigger uptrend. Moreover, the stock is nearing a Bullish Setup Zone. Notice how GEHC retraced around 50% of this advance. There is also support in the 85 area from the August consolidation and lows from mid August and late September (blue shading). We can even throw in the trendline extending up from the October 2023 low, but I am not a fan of long angled trendlines. A falling flag formed in October and I am marking resistance at 90. A breakout here would be bullish.
ITA Becomes Oversold for the First Time
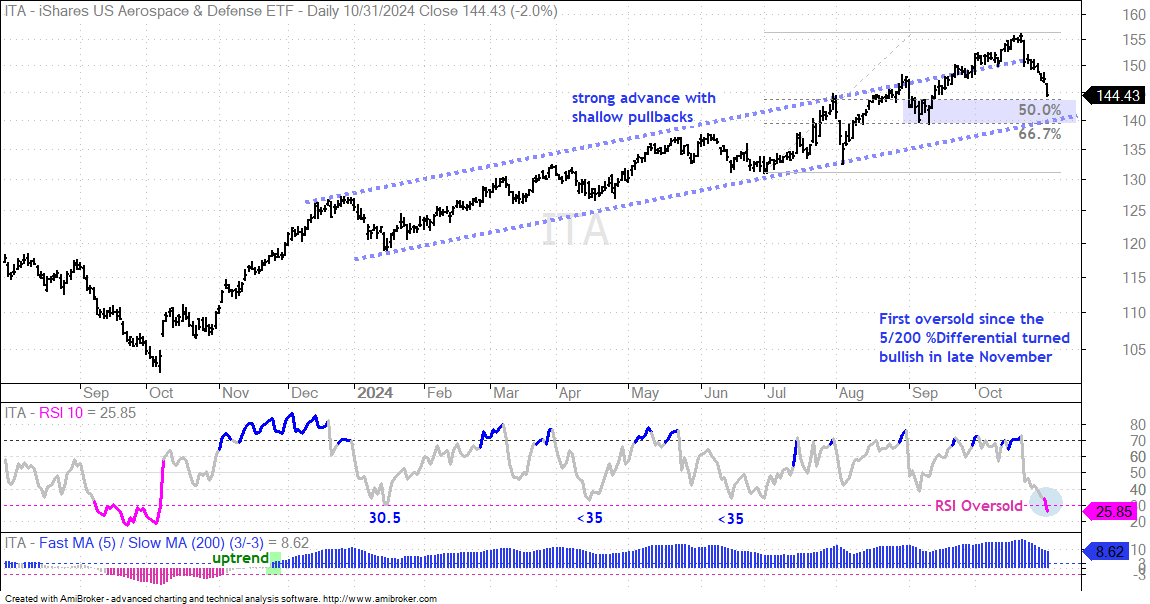
After an extended advance without a true oversold reading, the Aerospace & Defense ETF (ITA) finally became oversold as RSI(10) dipped below 30. The chart below shows ITA with the 5/200 %Differential turning bullish in late November as it moved above +3%. We are now getting the deepest pullback since the advance started. NOC, LMT and GE are responsible for recent weakness and these three are also short-term oversold. It is time to put ITA on the watch list because it is near a Bullish Setup Zone. The early September lows, 50-67% retracements and January trendline mark this zone in the 140-143 area. This is the place to watch for firming and a short-term upside catalyst.
Turning to RSI, notice that RSI dipped to 30.50 in mid January, but did not get below 30 to become technically oversold. There were also dips below 35 in April and June. Identifying oversold conditions is not an exact science. The oversold readings in ITA were shallow (<35) because the advance was so strong and pullbacks were minimal.
As you can see from the chart above, four of the five indicators were oversold in April 2024 (blue ovals). None of these indicators became oversold in August because the dip and recovery were so sharp. Currently, none of the indicators are oversold. There is no guarantee that we will get to oversold conditions, but I will be watching these as the current pullback unfolds.
INDA Corrects with Falling Wedge
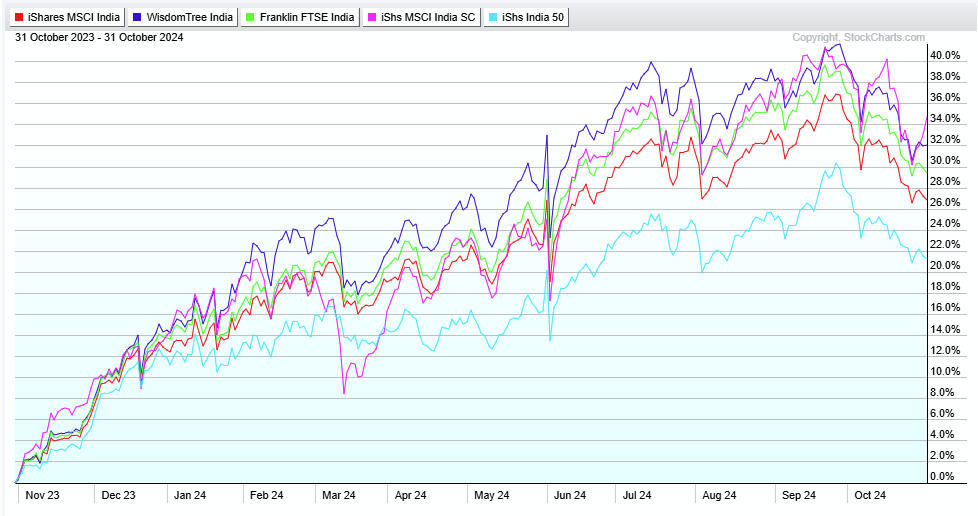
There are several India-related ETFs with five standing out. The iShares India ETF (INDA) is by far the biggest in assets (red line). The WisdomTree India Earnings Fund (EPI) weighs stocks by earnings instead of market cap (blue line). The Franklin India ETF (FLIN) has the lowest fees (green line). The MSCI Small-cap India ETF (SMIN) focuses on small-caps (pink line). The iShares India 50 (INDY) focuses on large-caps and sports the smallest gain (light blue line). INDA is the best for size and broadness, FLIN is the best for low fees and SMIN is the best for capturing BETA.
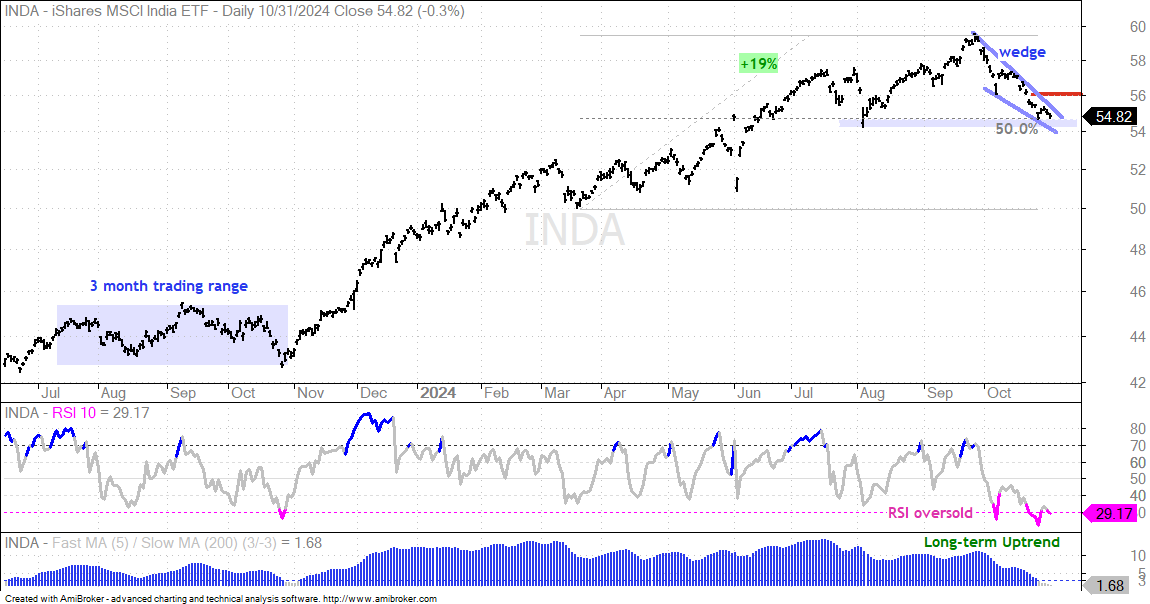
The chart below shows India ETF (INDA) in a long-term uptrend and hitting a new high in late September. INDA corrected in October with a falling wedge that retraced around 50% of the March-September advance. The indicator window shows RSI becoming oversold twice here in October. Thus, we have a long-term uptrend and an oversold condition. This is a rather tight wedge and I am marking resistance at 56. A breakout here would reverse the short-term downtrend and signal an end to this corrective period.
Copper Firms Near Bullish Setup Zone
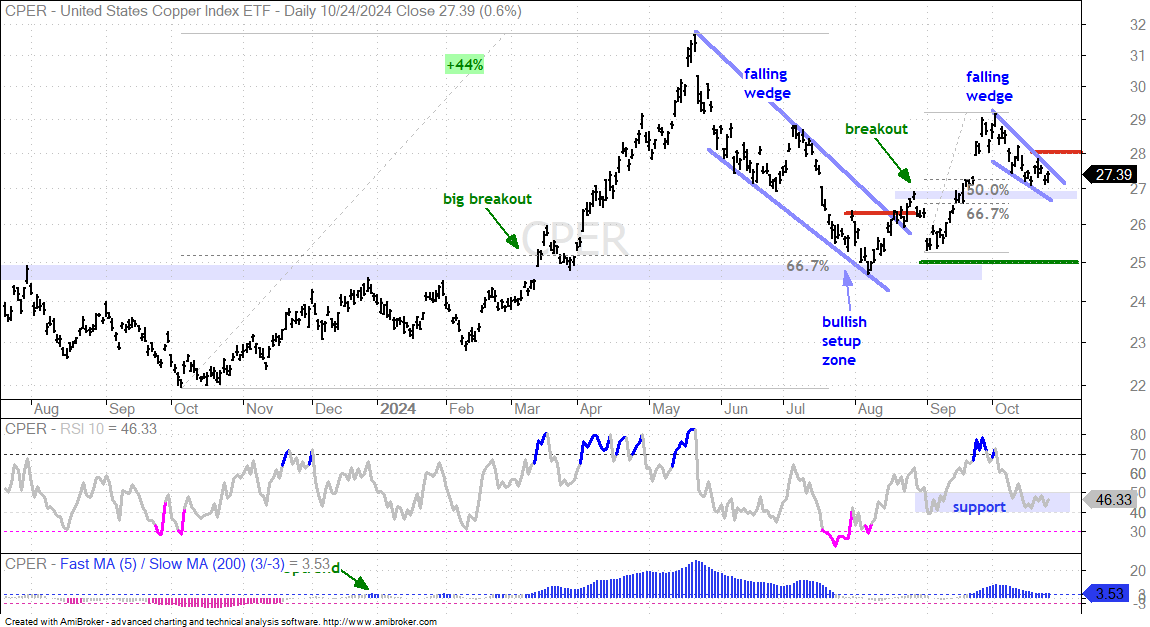
I am repeating the analysis for the Copper ETF (CPER) and Copper Miners ETF (COPX) because they are trading near Bullish Setup Zones. See this report and video for details on these zones. Long-term, the 5/200 %Differential turned bullish with a move above 3% in late December 2023 and we can see a big breakout at 25 in mid March. CPER advanced some 44% and then corrected with a large falling wedge in early August. The ETF broke out in late August and this is the most recent long-term signal.
Short-term, CPER advanced to 29 in September and then fell back here in October with a falling wedge. This wedge retraced 50-67% of the September surge and returned to the August high, which is broken resistance that turns support. Taken together, CPER is trading near a short-term bullish setup zone. In other words, this is a pullback within a bigger uptrend, and an opportunity. Also notice that RSI is trading in the 40-50 zone, which can act as momentum support in an uptrend. I am marking short-term resistance at 28 and a breakout here would be bullish.
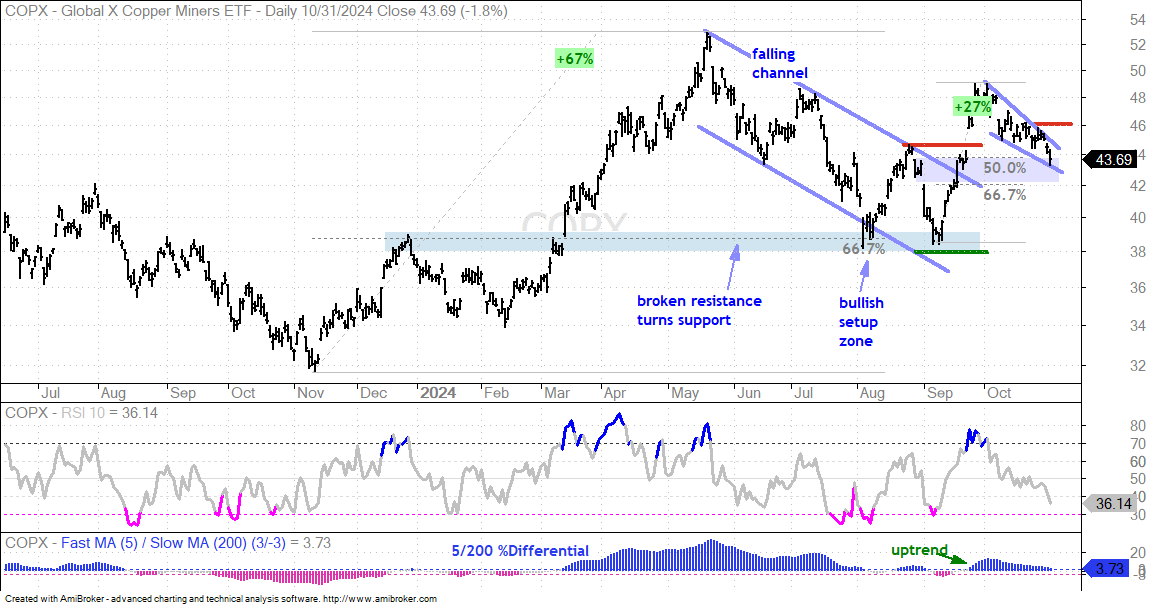
The next chart shows the Copper Miners ETF (COPX) surging 27% in September and then correcting in October. As with copper, I view this pullback as a correction after the September surge. COPX is also trading in a Bullish Setup Zone and RSI is in an oversold zone (<40). Short-term resistance is set at 46 and a breakout here would be bullish.
GLD Remains Extended
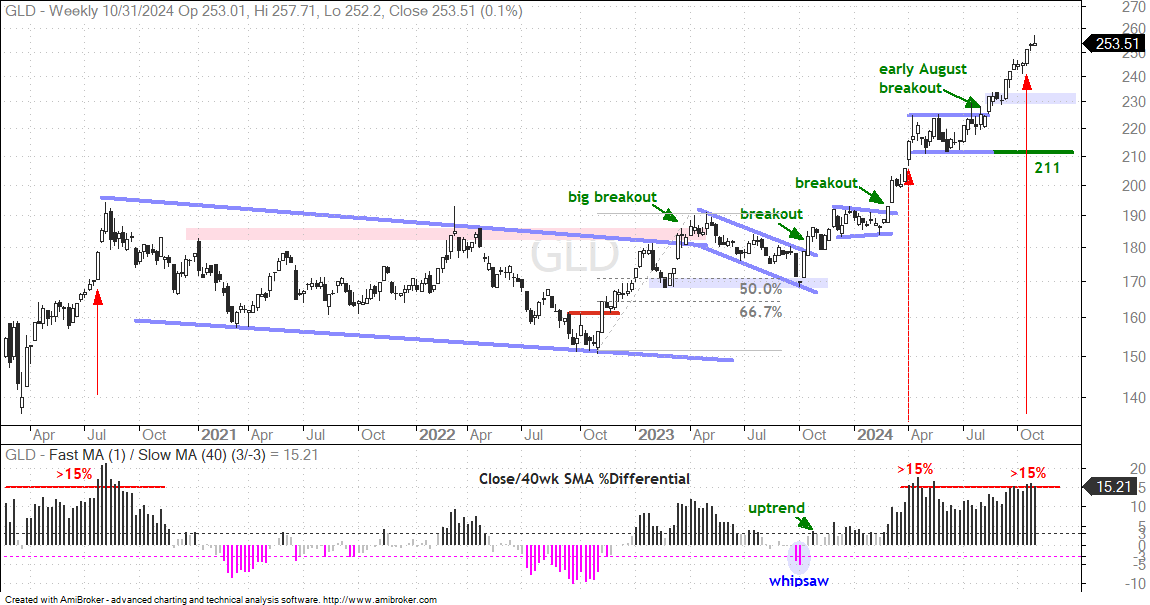
There is no change for gold. The Gold SPDR (GLD) remains very strong as it extended higher after the early August breakout. GLD is up 50% since October 2023 and up around 20% since early July, The only concern here is that gold became overbought the last few weeks because it was over 15% above its 40-week SMA. The red arrow-lines show the last three times this occurred. Overbought is not outright bearish, but it increases the odds for a corrective period (pullback or consolidation). First support is set in the 230 area (broken resistance). Key support remains at 211.
TLT in Downtrend after Channel Break
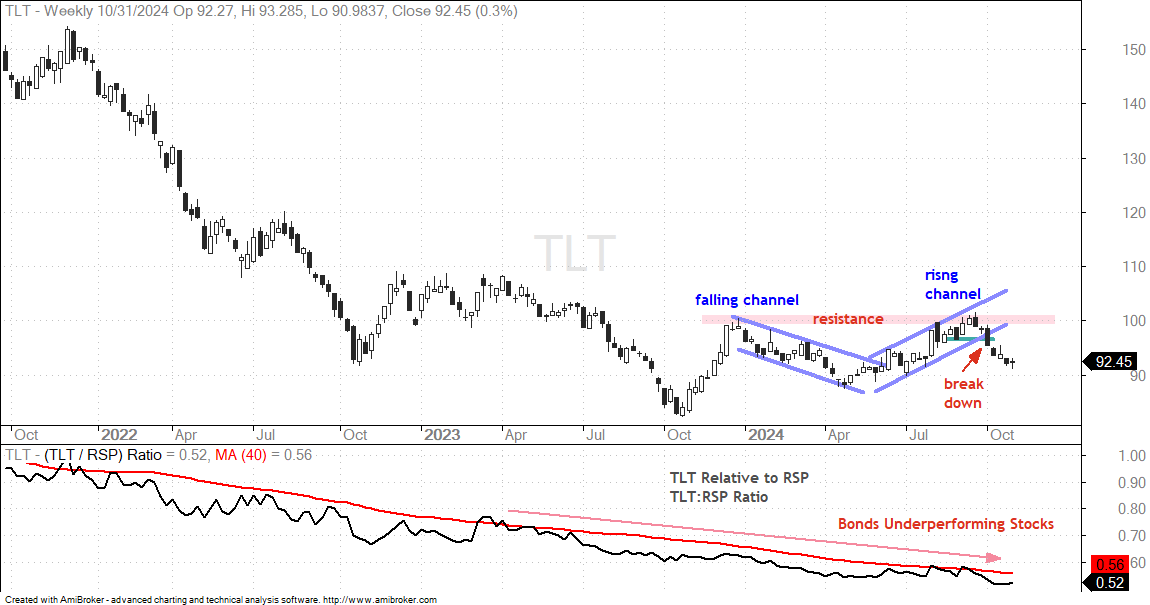
There is no change for TLT. The 20+ Yr Treasury Bond ETF (TLT) is in a downtrend and seriously underperforming stocks (RSP). After an advance from April to September, TLT hit resistance near the December 2023 highs (red resistance zone) and broke channel support with a sharp decline into October. The channel break is bearish and targets a move into the mid 80s (October lows).
Bitcoin Extends on Breakout
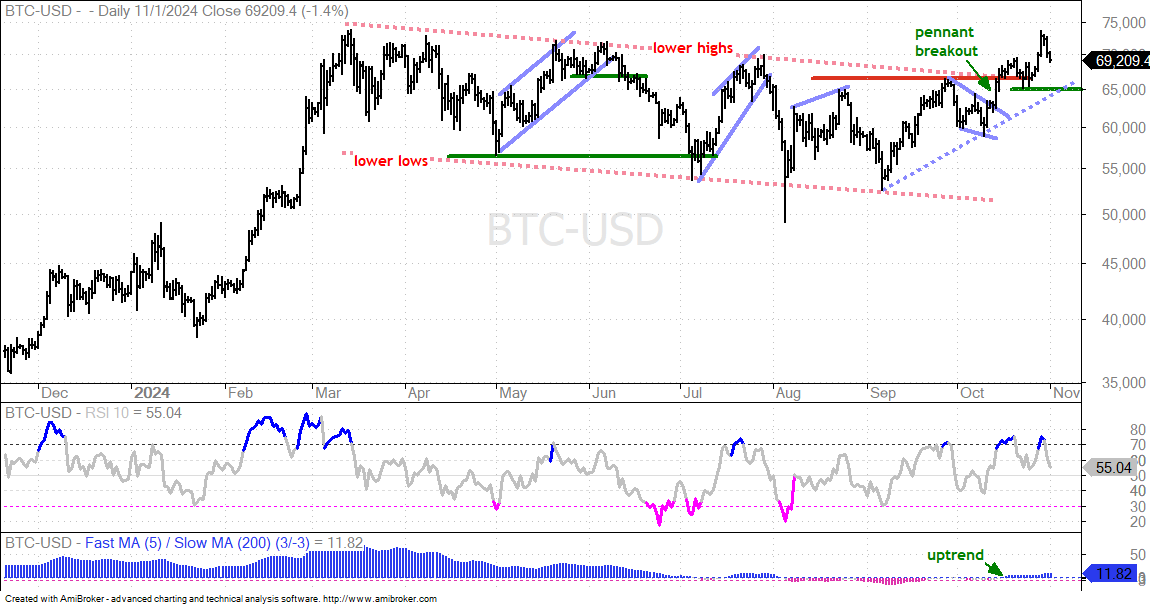
Bitcoin broke out of a short-term pennant on October 14th and closed above long-term resistance with follow through the next day. It trended lower from April to September and broke the string of lower highs with a big move in mid October. The crypto then consolidated around the breakout zone for two weeks and then extended higher this week. This follow through solidifies the breakout and the breakout zone turns first support. Using the October 23rd low, I will mark support at 65000. A break here would call for a re-evaluation.