The next report will be on Wednesday, February 12th.
The weight of the evidence remains bullish for stocks with SPY and QQQ leading the broader market. The S&P 500 EW ETF (RSP), mid-caps and small-caps are lagging. SPY has a bullish cup-with-handle pattern taking shape, and QQQ has a wedge breakout working.
The Finance SPDR (XLF) and Communication Services SPDR (XLC) are leading the sectors with new highs here in February. The Technology SPDR (XLK) is holding up as it surged off support. In particular, I am watching the Industrials SPDR (XLI) this week as it broke out of a small flag and the Utilities SPDR (XLU) has it holds its wedge breakout.
Many tech-related ETFs extended on their mid January breakouts and hit new highs. These include two Cloud ETFs (CLOU, SKYY), the Cybersecurity ETF (CIBR) and two AI-related ETFs (AIQ, ARTY). The Software ETF (IGV) extended on its wedge breakout. Semis continue to lag within the tech sector and the Mag7 ETF (MAGS) is dragging its feet.
Of interest this week, the Infrastructure ETF (IFRA) and Global Infrastructure ETF (PAVE) formed small falling wedge patterns and broke out. Elsewhere, the Regional Bank ETF (KRE) and Insurance ETF (KIE) have yet to extend to new highs, but they are holding their wedge breakouts.
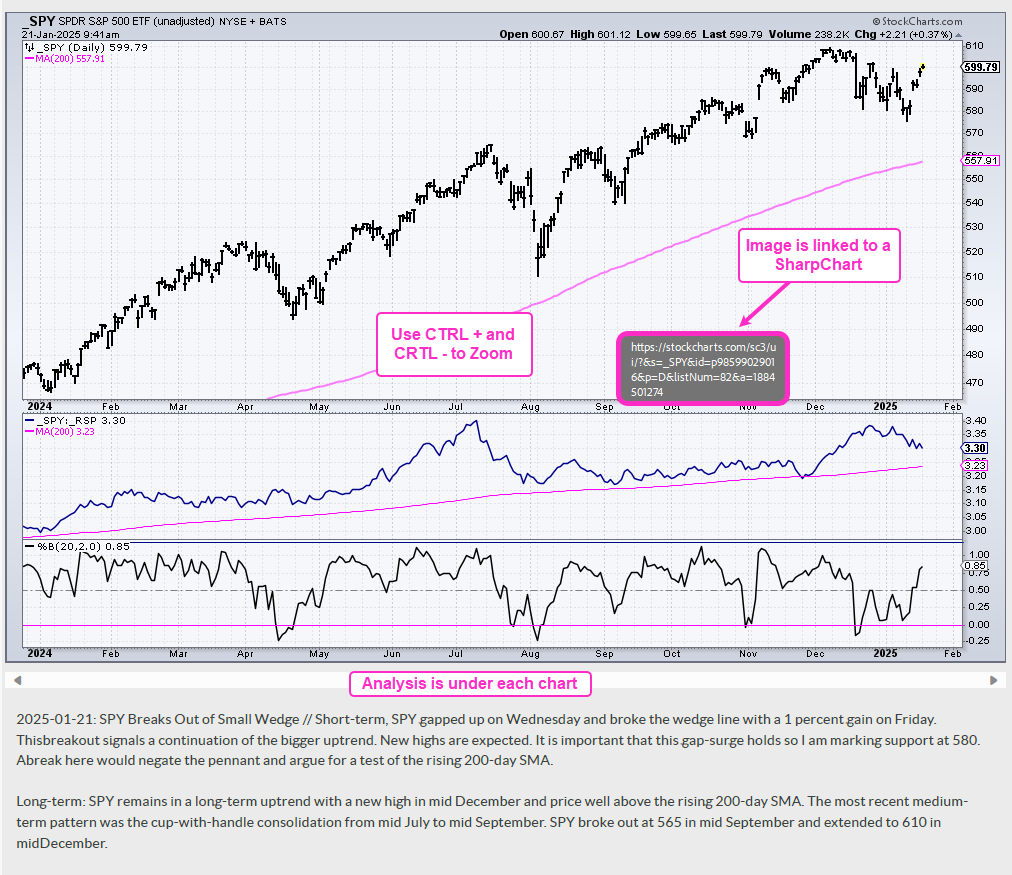
– SPY Forms Bullish Cup-with-handle Pattern
– QQQ Holds Wedge Breakout
– RSP Forms Small Bullish Wedge after Breakout Surg
– MDY, IJR and IWM Tests Wedge Breakout Zone
– XLK Holds Support and Maintains Uptrend
– XLC and XLF Tag New High After Breakout
– XLI Goes for Short-term Breakout after Pullback
– XLU Breaks Out and Consolidates around Breakout Zone
– MAGS Struggles with Breakout but Holds Support
– AIQ and ARTY Leads AI-Related ETFs Higher
– IGV Extends on Wedge Breakout
– IBIT Tests Wedge Breakout Zone
– KBE, KRE and KIE Holds Wedge Breakouts
– ITA Consolidates Near New High
– IFRA and PACV Break Out of Small Wedges
– IBB and XBI Fall Back below Breakout Levels
– GLD Leads with New High
If viewing the PDF in a browser, right click on charts to open in a new tab or window.
Use CRTL and the Plus or Minus keys (+ -) to zoom. 125% works best for me.
Send feedback to support(at)trendinvestorpro.com or use the contact form. [2]
Working with PDF Files
Why the shift to PDF? Working with ChartLists at StockCharts and PDF files is an effective and efficient manner to track and analyze a chart group (ETFs, stocks, Market Regime). It saves an enormous amount of “posting” time, which is the time required to copy/paste the text and charts for each section. With a ChartList, I simply print the charts and analysis to one PDF. This also serves as a good archive.
The charts in the PDF files are linked to a corresponding SharpChart at StockCharts. There are two ways to open the PDF file: through your browser or through an application like Adobe Acrobat. When viewing the PDF through your browser, the best way to open a chart is to right click on the image and choose open in new tab/window. When viewing the PDF through Acrobat, you can open a chart in your default browser by simply clicking on the image.
The example below is a screen shot from the PDF.
Send feedback to support(at)trendinvestorpro.com or use the contact form. [2]