Strength Emerging in the Middle, Finance, Industrials and Utilities Lead, Gold and Industrial Metals Move
Posted By
Arthur Hill, CMT
On
In
Archive |
No Comments
The next report will be on Tuesday, January 21st.
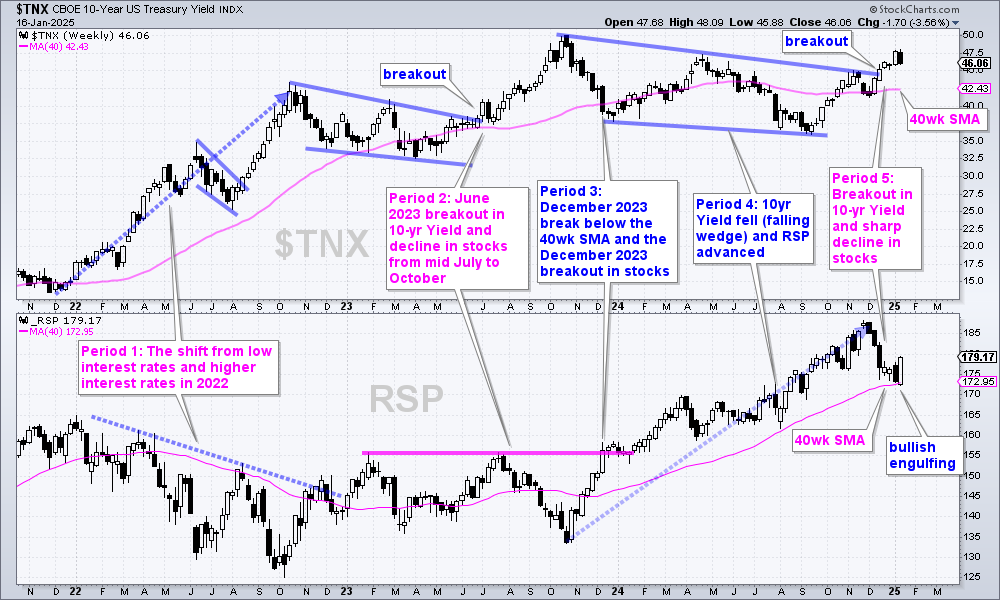
After rising sharply from mid December to mid January, Treasury yields fell sharply on benign CPI numbers. The 10-yr Treasury Yield remains in a long-term uptrend with a breakout, but short-term yields are still trending lower and more reflective of Fed policy. The decline in yields sparked a buying binge on Wall Street with leadership coming from the middle of the market (mid-caps). Broad strength in mid-caps triggered a breadth thrust for this group. We are also seeing leadership in ETFs related to finance, industrials and utilities. Seven feature in today’s report. The Gold SPDR and DB Base Metals ETF are also going for breakouts, as is IBIT.
If viewing this PDF in a browser, right click on the chart to open as a new tab or window.
Use CRTL and the Plus or Minus keys (+ -) to zoom.
Video Headlines
– 10-year Yield vs 3-month Yield – A Breadth Thrust for Mid-caps – SPY and QQQ Remain with Pennant Consolidations – Leaders Emerge in the Middle of the Market – Small-caps Surge, but Lag – Finance, Industrials and Utilities Lead with Wedge Breakouts – XLF, XLI, XLU, KRE, ITA, PAVE and IFRA – IHI and AMLP Lead with New Highs – GLD Breaks out of Triangle – DB Base Metals ETF With a Bullish Setup – IBIT Breaks Pennant Line
The chart and commentary are reversed with the chart first and the relevant commentary underneath.
10-year Yield vs 3-month Yield
We all know about the sharp rise in the 10-yr Treasury Yield. I covered this on Wednesday and the wedge breakout in mid December remains in play. This benchmark yield fell from 4.8% to 4.6% this week and the dropped trigged a buying binge in the broader stock market. The S&P 500 EW ETF (RSP) and S&P MidCap 400 SPDR (MDY) rose 3.42% and 4.06%, respectively. The chart above shows RSP forming a big bullish engulfing at the rising 40-week SMA.
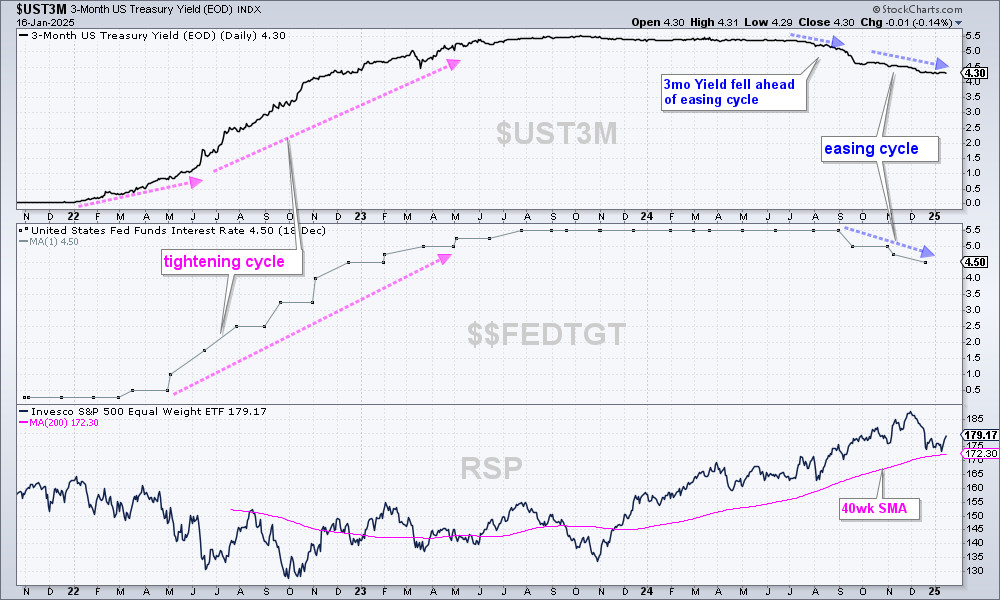
There are many drivers when it comes to the US Treasury bond market. These include the economic outlook, inflation expectations, government policies and supply/demand dynamics. Short-term Treasury yields are also influenced by these factors, but they are more closely aligned with Fed policy and the Fed funds rate. The chart above shows the 3-month Treasury Yield ($UST3M) in the top window and the Fed Funds Target Rate ($$FEDTGT) in the middle. This yield peaked in June and fell into December. We have yet to see an upturn and this points to a dovish Fed, which is positive for stocks.
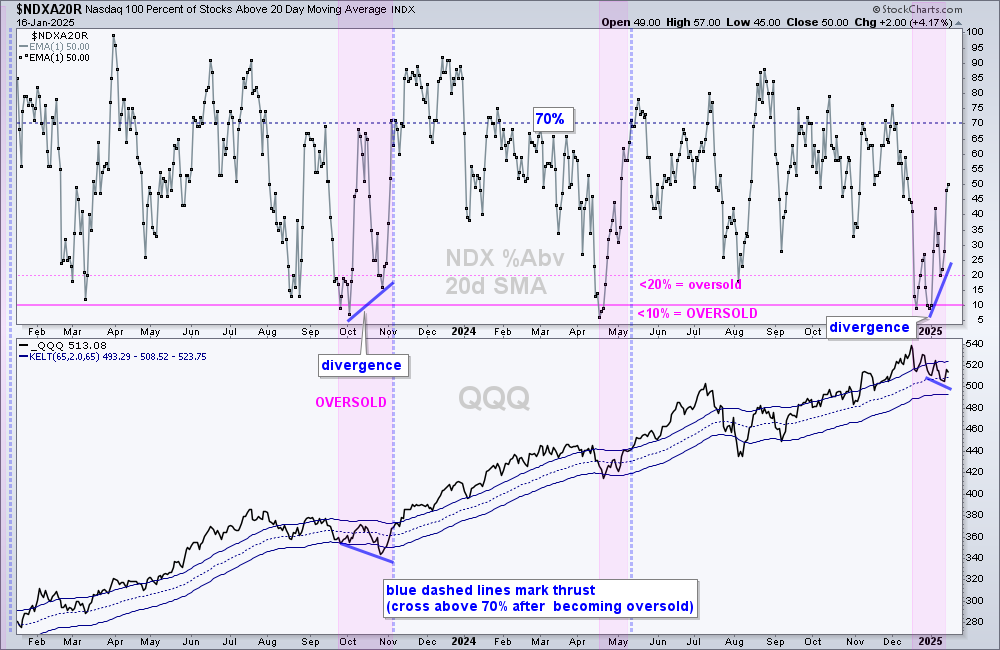
A Breadth Thrust for Mid-caps
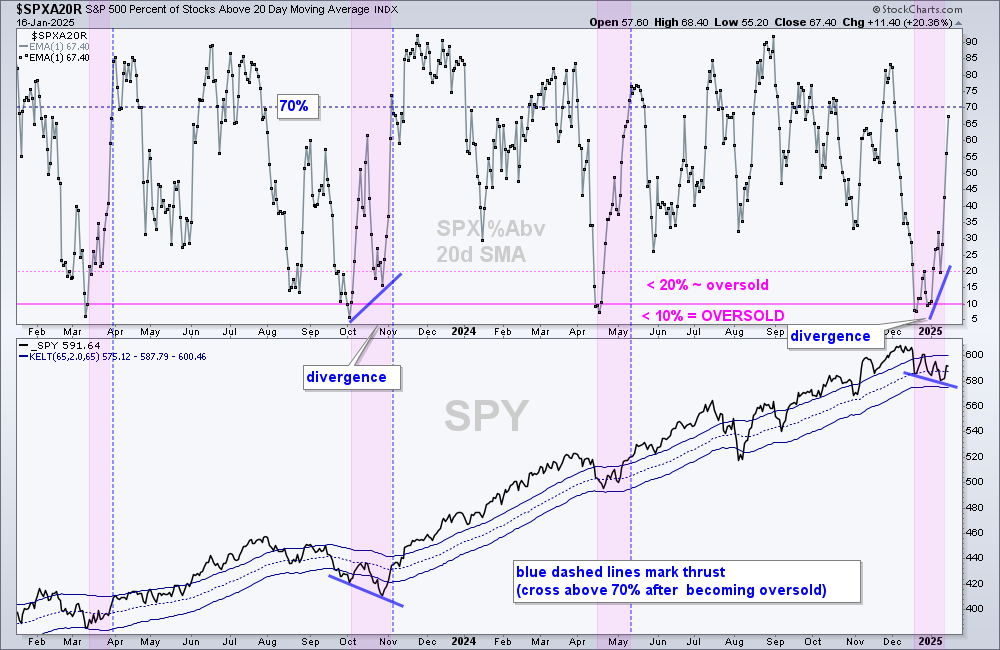
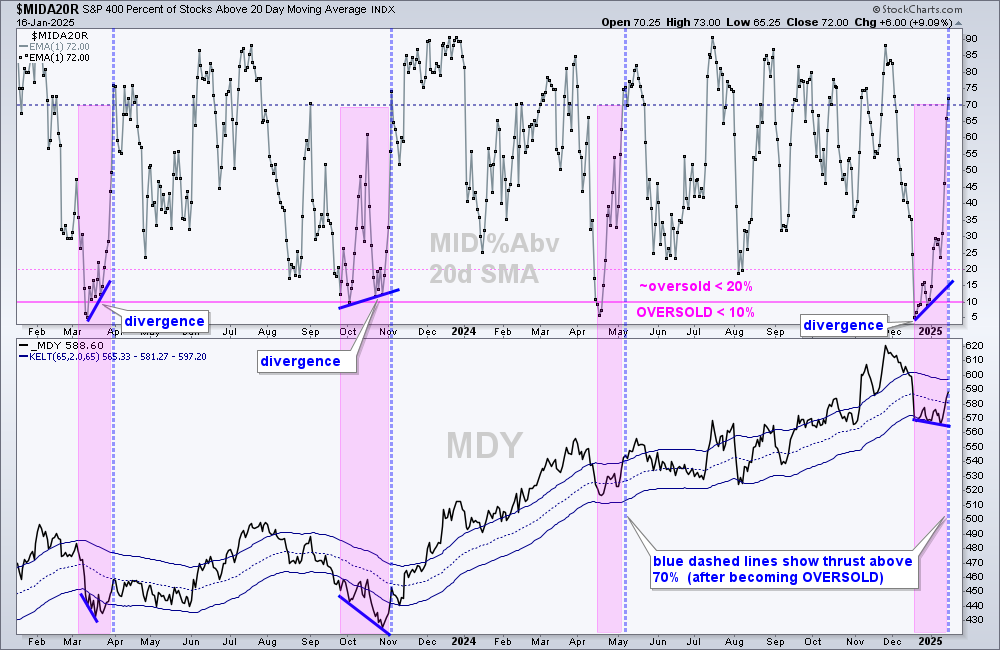
The chart above shows SPX %Above 20-day surging to 67.4%. Further strength above 70% would trigger a thrust signal.
Stocks surged the last two days with broad strength in the S&P 500 and S&P MidCap 400. The charts below show the percentage of stocks above the 20-day SMA within the S&P 500 ($SPXA20R), S&P MidCap 400 ($MIDA20R) and Nasdaq 100 ($NDXA20R). These indicators become mildly oversold when below 20% and OVERSOLD when below 10%.
All three exceeded 10% in December and then formed bullish divergences into January. A bullish divergence forms when the indicator forms a higher low as the underlying index ETF forms a lower low. This higher low shows less downside participation and sets the stage for a bounce.
The chart above shows MID %Above 20-day surging above 70% and hitting 72% for a breadth thrust signal. Note that SML %Above 20-day SMA ($SMLA20R) finished at 57.5%. I am not showing this chart because I am not a fan of small-caps. Their volatility (risk) does not justify their reward potential.
The chart above shows NDX %Above 20-day moving to 50% and falling well short of a thrust. Clearly, money moved into the broader market and not so much into Nasdaq 100 stocks.
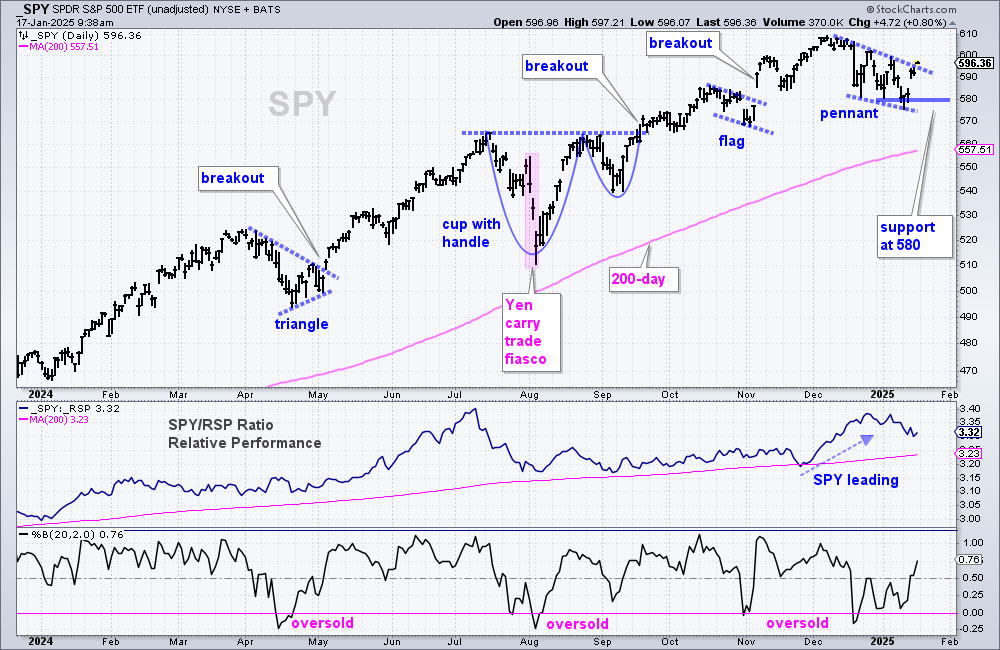
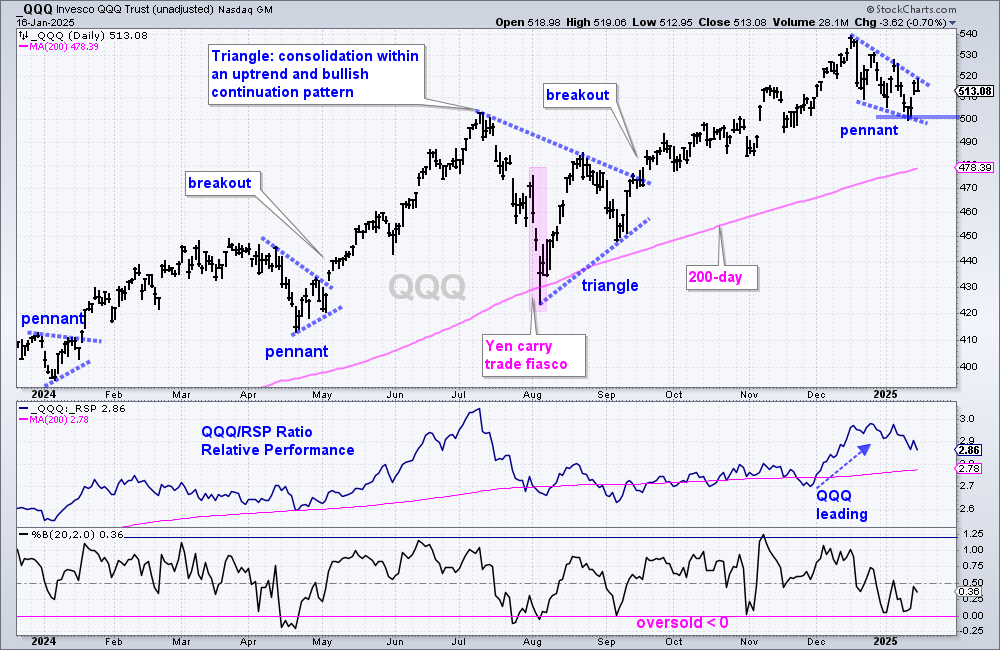
SPY and QQQ Remain with Pennant Consolidations
SPY remains in a long-term uptrend with a bullish pennant forming the last few weeks. The ETF became oversold in mid December as Percent-B dipped below 0. This oversold condition means there was a pullback within the bigger uptrend and traders should be on watch for a bullish setup. On the price chart, SPY formed a pennant the last few weeks and this is a short-term bullish continuation pattern. A breakout at 600 would be bullish. SPY gapped up on Wednesday and it is important that this gap holds (support at 580). A break here would erase Wednesday’s buying binge and argue for a test of the rising 200-day SMA.
QQQ remains in a long-term uptrend with a bullish pennant taking shape. The ETF did not become oversold the last few weeks as Percent-B held above 0. This means QQQ held up better than SPY, which became oversold. A breakout at 520 would confirm the pennant and signal a continuation higher. Short-term, QQQ gapped up on Wednesday and then closed lower on Thursday. It is important that this gap holds (support at 500). A break here would negate the pennant and argue for a test of the rising 200-day SMA.
Leaders Emerge in the Middle of the Market
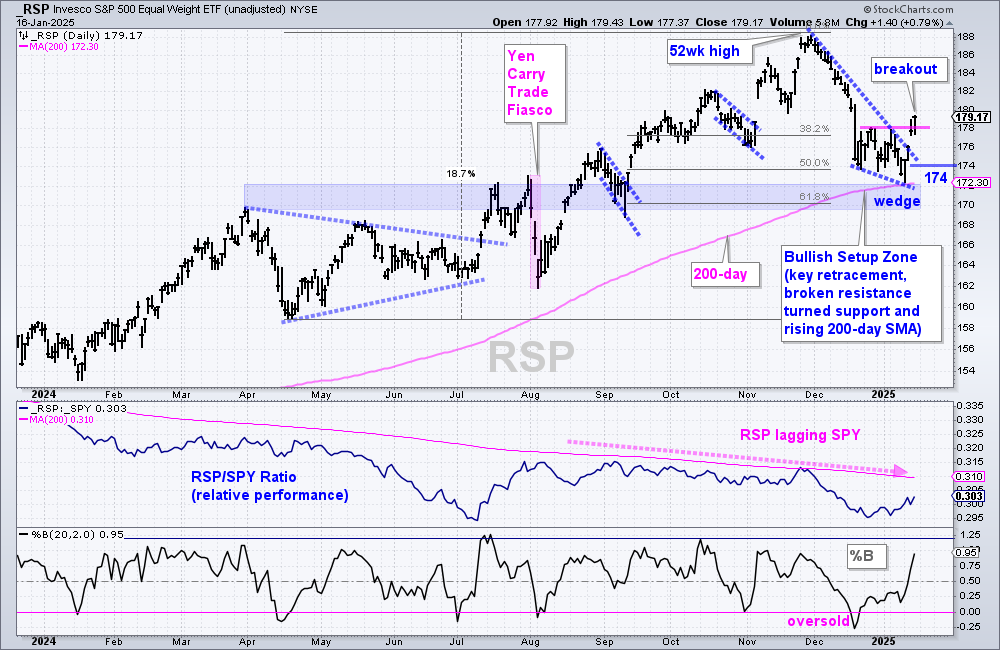
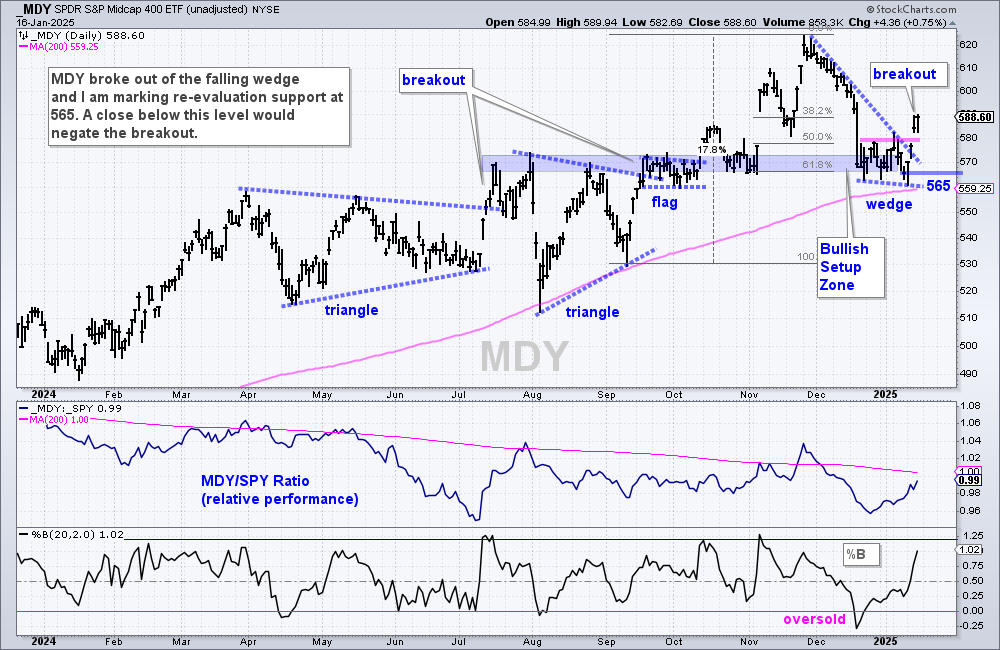
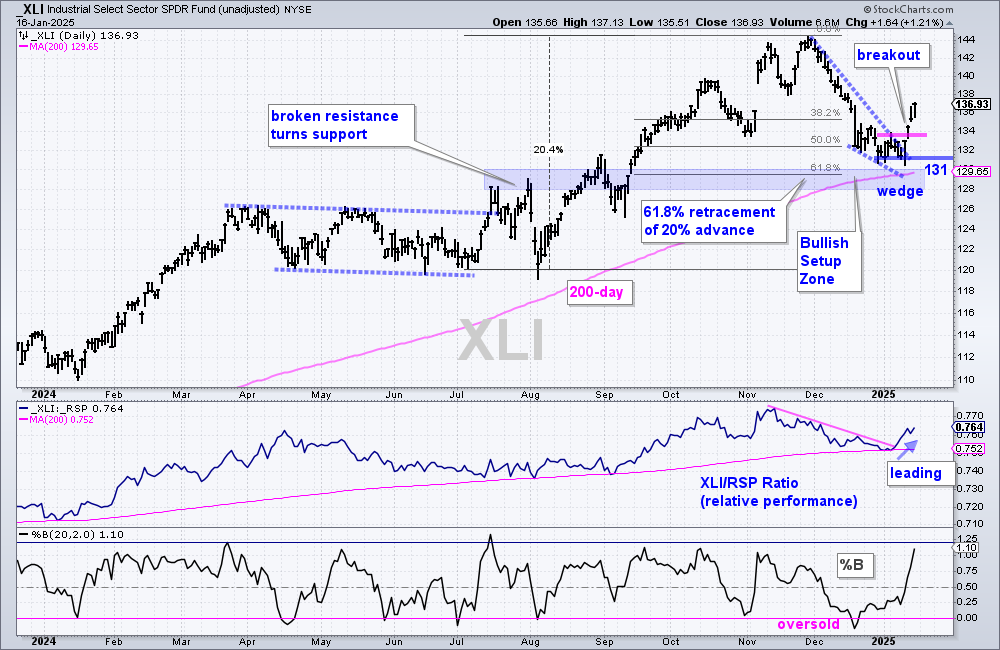
We are seeing leadership in the middle of the market, between large-caps and small-caps. Here we find the S&P 500 EW ETF (RSP) and the S&P MidCap 400 SPDR (MDY). I consider this a sweet spot in the stock market. The chart above shows RSP falling to the Bullish Setup Zone with a wedge and breaking above the late December high. Within a long-term uptrend, a Bullish Setup Zone marks a confluence of support and retracements that can lead to firming and a reversal. RSP reversed the short-term downswing with this week’s breakout. This also signals a resumption of the bigger uptrend. It is important that Wednesday gap and the breakout surge hold. I am marking re-evaluation support at 174.
This late December high is a benchmark high that chartists can use to compare performance. Stocks and ETFs above their late December highs are showing short-term relative strength. Stocks and ETFs that have yet to break this high are showing short-term relative weakness (QQQ, IWM). The chart below shows MDY with a breakout.
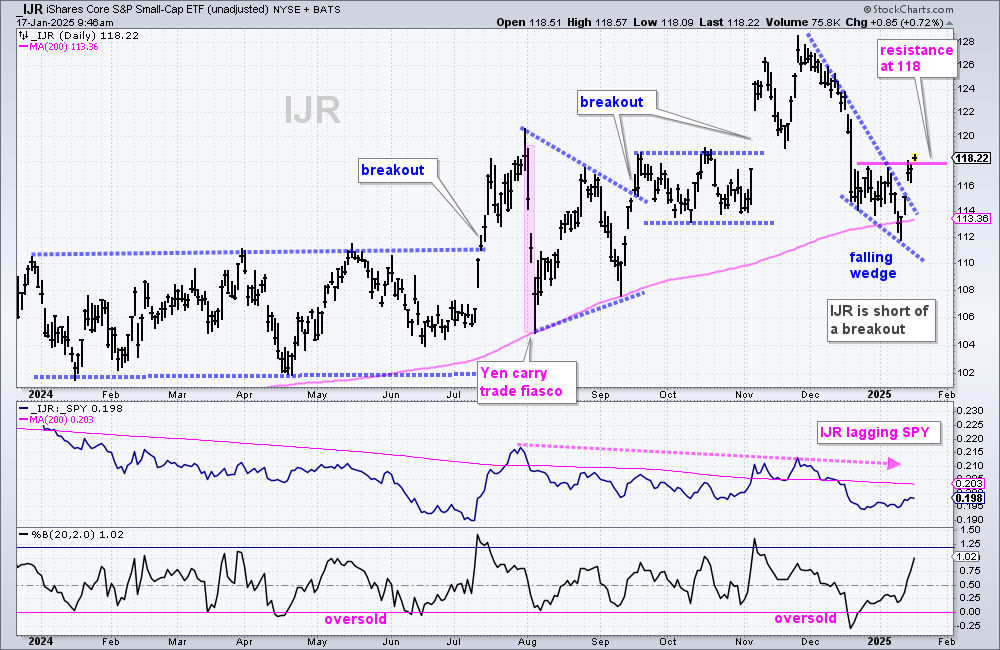
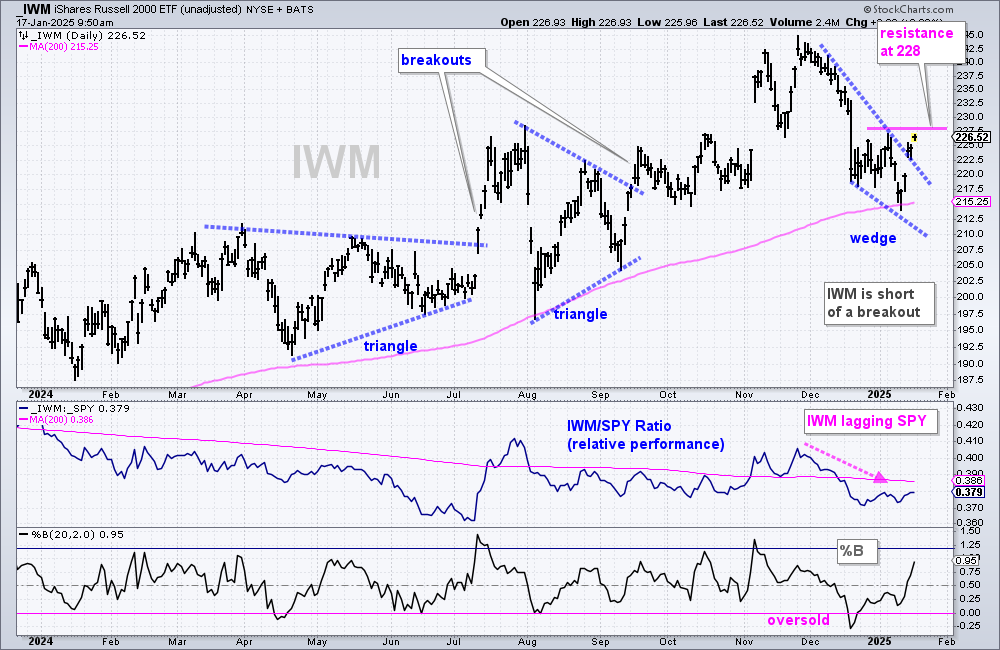
The S&P SmallCap 600 SPDR (IJR) and Russell 2000 ETF (IWM) also formed falling wedge patterns from late November to early January. These two also surged the last two days and broke above the upper line of the falling wedge. The surge and wedge line breakout are positive. These two, however, are still lagging because they have yet to exceed their late December highs and their price-relatives are well below their 200-day SMAs (IJR/SPY ratio and IWM/SPY ratio). RSP and MDY seem the better choice here. The chart below shows IWM just short of a breakout.
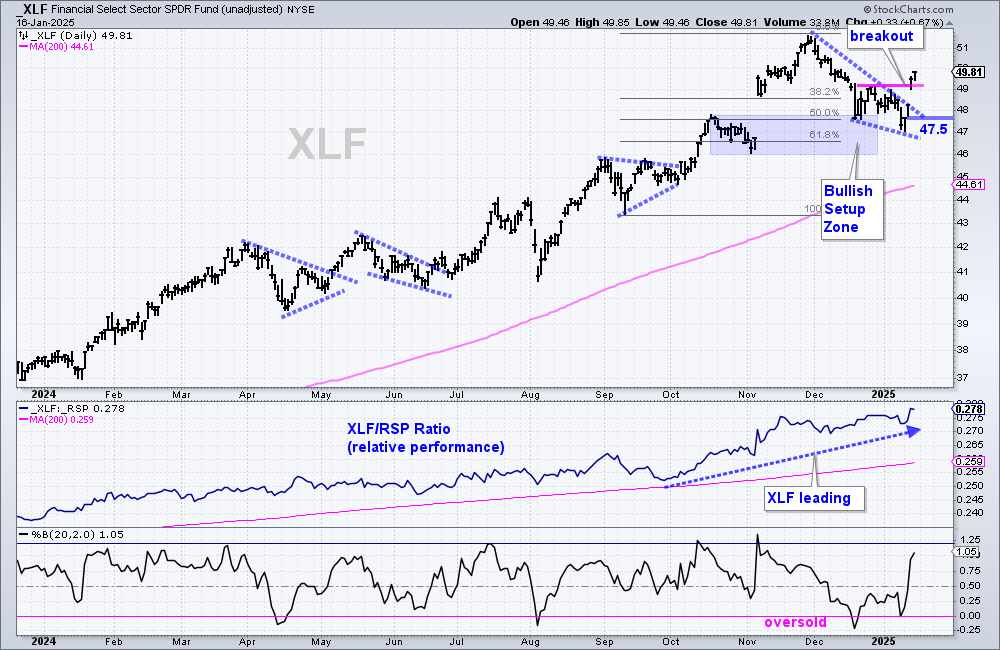
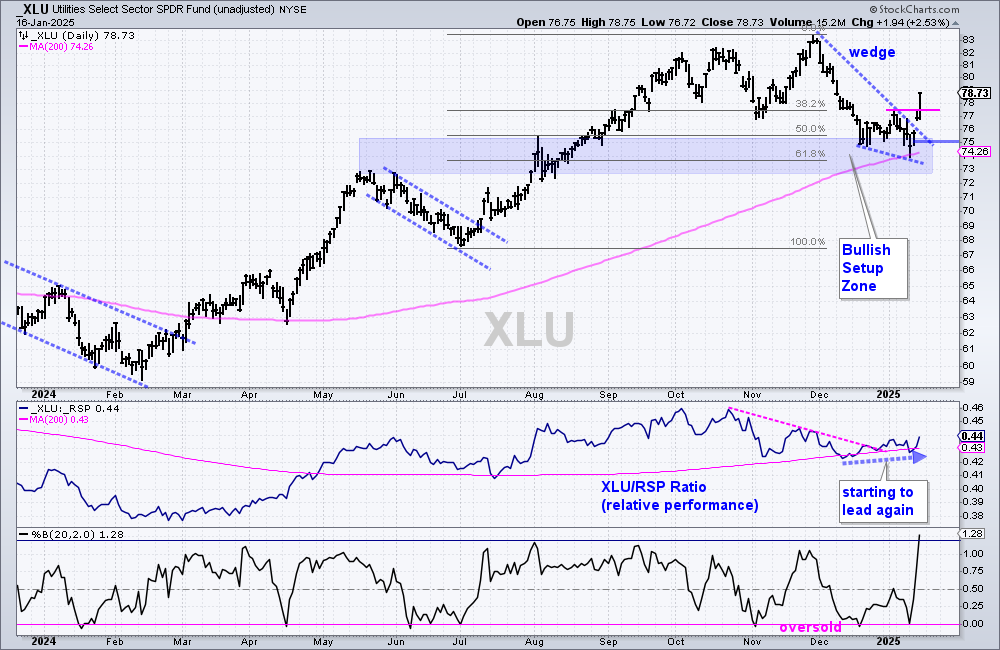
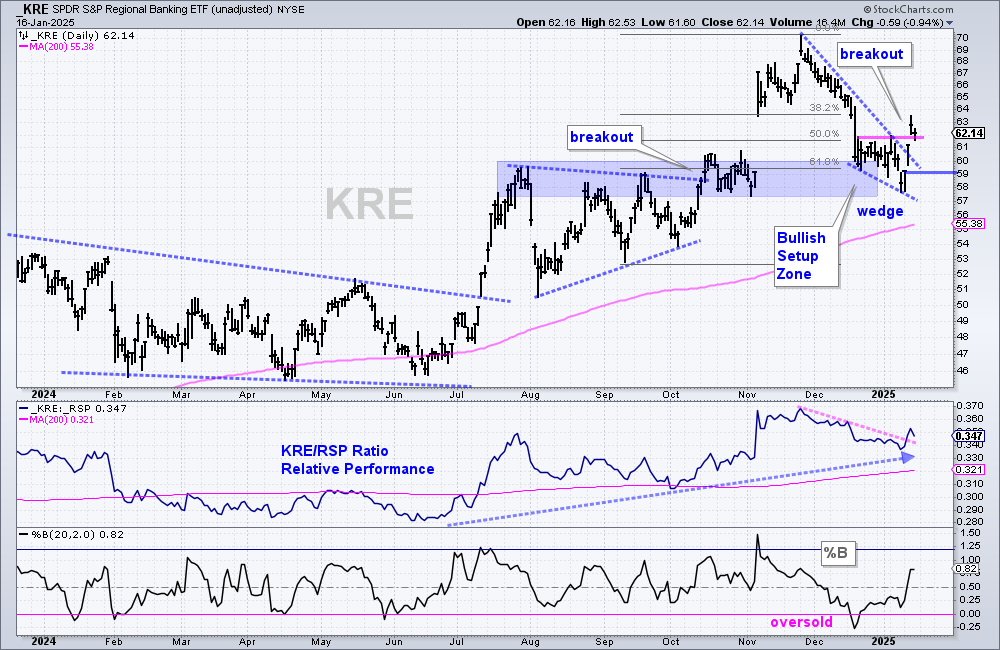
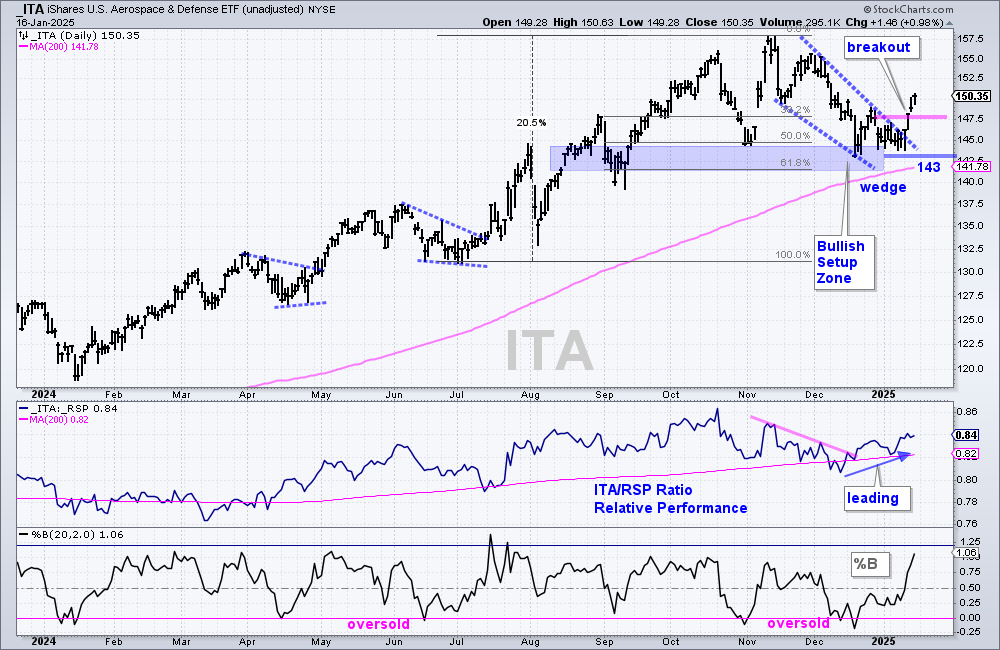
Finance, Industrials and Utilities Lead with Wedge Breakouts
The chart above shows Finance SPDR (XLF) breaking out near 49 and re-evaluation support is set at 47.50.
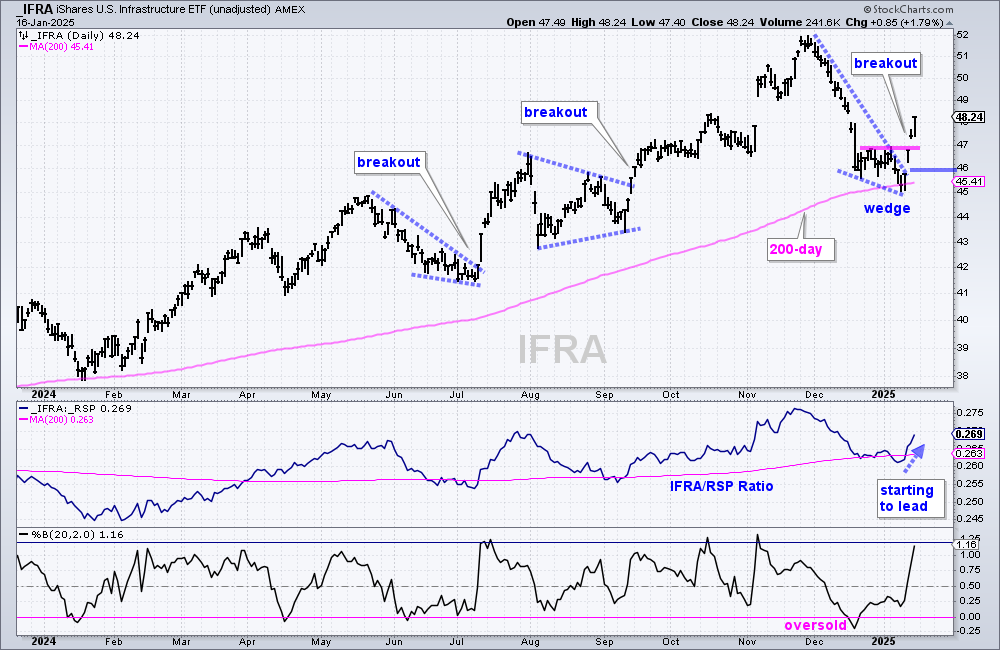
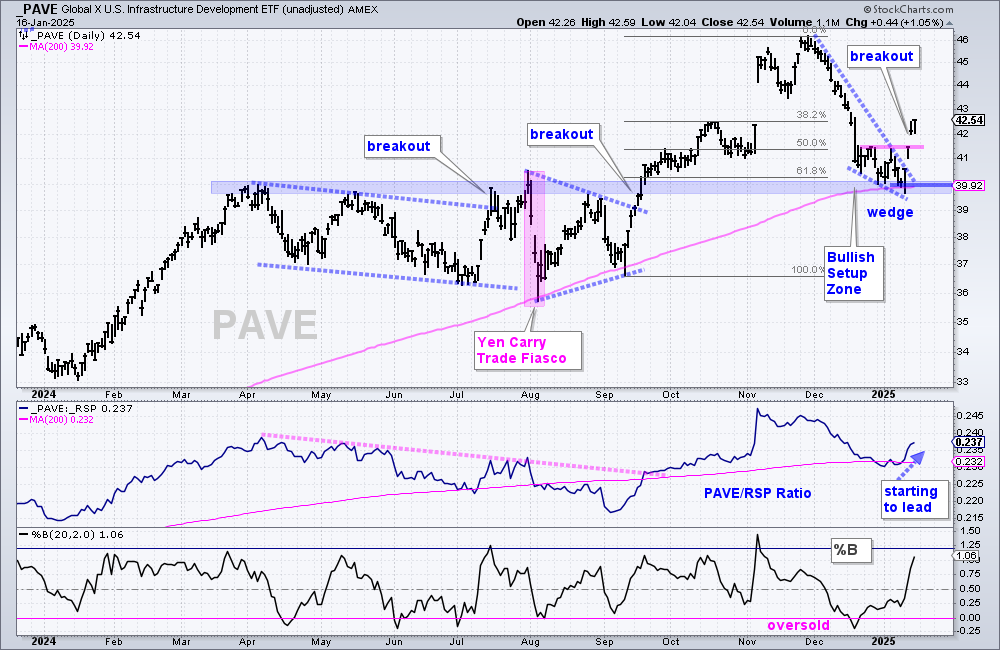
We are seeing wedge breakouts and upside leadership in several non-tech groups. Among the sectors, there is emerging leadership in the Finance SPDR (XLF), Industrials SPDR (XLI) and Utilities SPDR (XLU). ETFs related to these three sectors are also breaking out. The Regional Bank ETF (KRE) is part of the finance sector, while the Global Infrastructure ETF (PAVE) and the Aerospace & Defense ETF (ITA) are part of the industrials sector. The Infrastructure ETF (IFRA) is a hybrid with big weightings in the utilities (41 percent) and industrials (29 percent) sectors.
The following charts shows wedge breakouts in these ETFs. They are all in long-term uptrends and the falling wedge patterns represented pullbacks within these long-term uptrends. Wedge breakouts triggered as prices surged the last two days. Strong breakouts should hold so it is important that the gap-surges hold. I am marking re-evaluation support on each of these charts with blue lines. A close below these re-evaluation support levels would erase the gap-surge and negate the breakouts. For now, the breakouts are there and they are bullish until proven otherwise.
The chart above shows the Industrials SPDR (XLI) breaking out near 134 and re-evaluation support is et at 131.
14-January-2025 (Tuesday): The Industrials SPDR (XLI) is trading near a Bullish Setup Zone with a falling wedge taking shape. The blue shading marks broken resistance turned support, the 61.8% retracement and the rising 200-day SMA. This is an area to watch for support and a reversal when the bigger trend is up. Also note that Percent-B became oversold in mid December. XLI is firming, but remains short of a breakout. Resistance is set at 134 and a breakout here would be bullish. The middle window shows the price-relative (XLI/RSP ratio) turning up in January as XLI shows signs of relative strength (blue arrow). Note that a breakout in this sector would be positive for the market.
The chart above shows the Utilities SPDR (XLU) breaking out around 77.5 and re-evaluation support set at 75.
The chart above shows the Regional Bank ETF (KRE) with a breakout around 62 and re-evaluation support marked at 59.
The chart above shows the Aerospace & Defense ETF (ITA) with a breakout around 147.5 and re-evaluation support set at 143.
14-January-2025 (Tuesday): The Aerospace & Defense ETF (ITA) shows relative strength as a bullish wedge takes shape. First and foremost, the long-term trend is up because ITA hit a new high in November and price is above the rising 200-day SMA. The ETF fell from mid November to December and this is deemed a correction within the bigger uptrend. ITA hit the Bullish Setup Zone in late December and firmed into January. I am marking resistance at 148 and a breakout here would reverse the short-term downswing. The middle window shows the price-relative (ITA/RSP ratio) turning up the last few weeks as ITA starts showing relative strength again.
The chart above shows the Infrastructure ETF (IFRA) with a breakout in the 147 area and re-evaluation support marked at 56.
The chart above shows the Global Infrastructure ETF (PAVE) with a breakout around 41.50 and re-evaluation support set at 40.
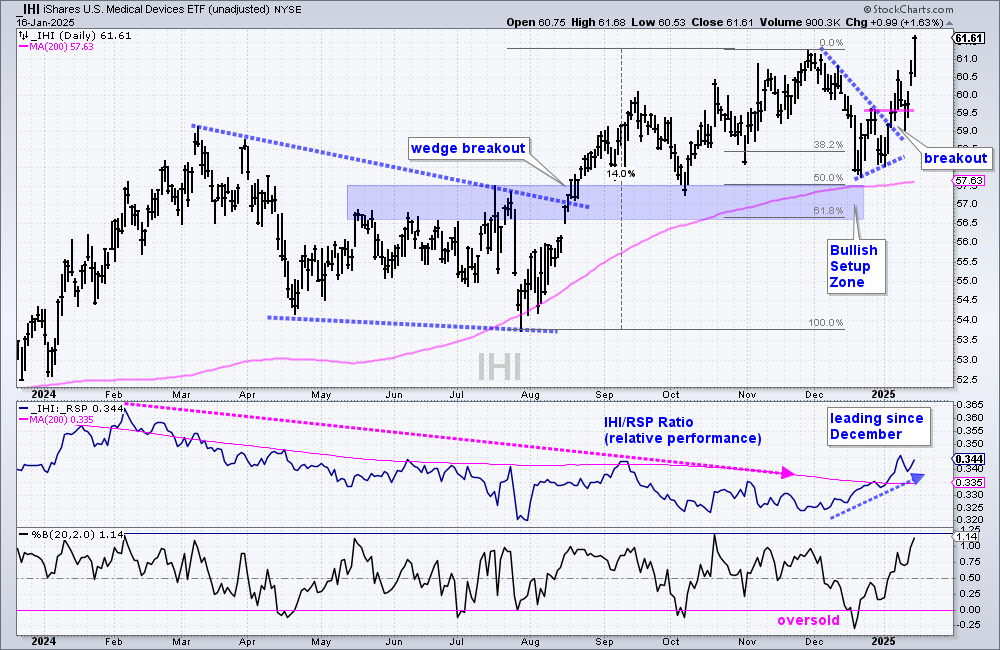
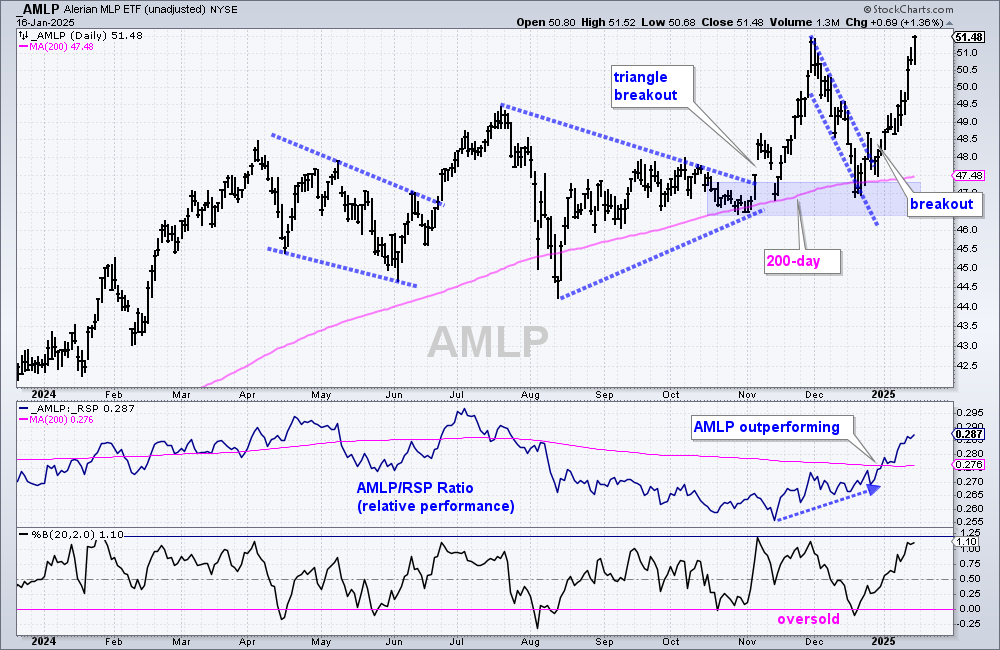
IHI and AMLP Lead with New Highs
The chart above shows the Medical Devices ETF (IHI) following through on the early January breakout. IHI tagged a new high this week. Not many stock-related ETFs are trading at new highs and this makes IHI a clear leader.
9-January-2025 (Thursday): The chart above shows the Medical Devices ETF (IHI) with a pennant breakout and continued strength the last two days. IHI is also leading since December as the price-relative moved above its 200-day SMA this year.
The chart above shows the MLP ETF (AMLP) following through on the late December breakout and hitting a new high this week. In contrast to Energy SPDR (XLE), AMLP was in an uptrend throughout 2024 and the decline in December was deemed a pullback within this uptrend. AMLP is a clear leader with a new high.
9-January-2025 (Thursday): The chart above shows the MLP ETF (AMLP) with a rather sharp pullback in December and a channel breakout in late December. AMLP extended higher in January and the AMLP/RSP ratio moved above its 200-day SMA (relative strength).
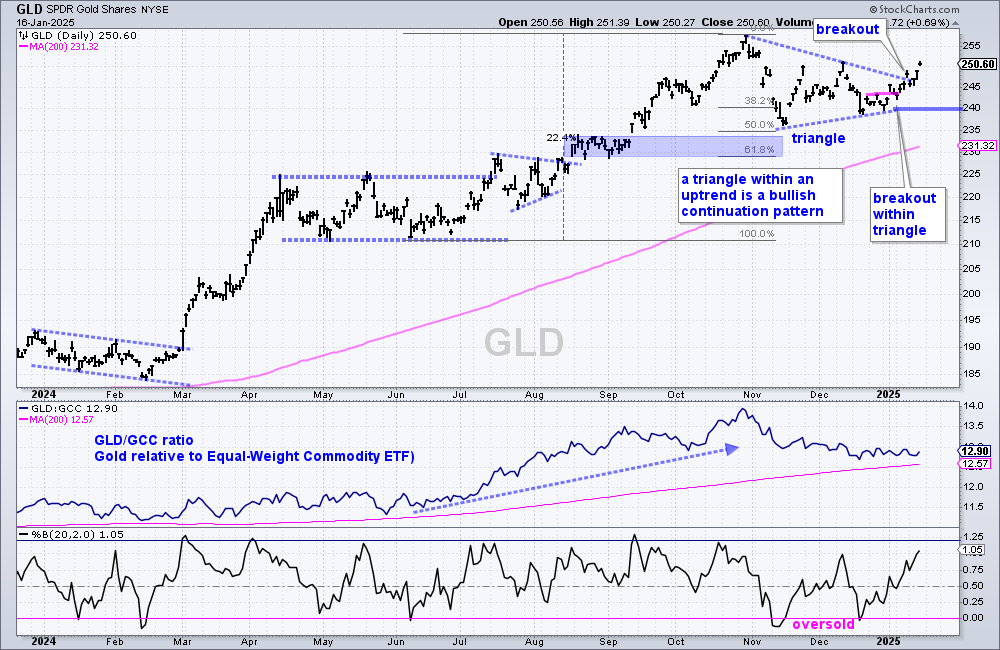
GLD Breaks out of Triangle
The chart above shows the Gold SPDR (GLD) with a triangle breakout last Friday and some follow through the last few days. GLD is in a long-term uptrend and the triangle is a consolidation within this uptrend. This makes it a bullish continuation pattern and the breakout signals a continuation of the long-term uptrend. I am marking re-evaluation support at 240. Instead of showing GLD relative to the S&P 500 EW ETF (RSP), I am showing it relative to the WisdomTree Continuous Commodity ETF (GCC), which is an equal weight commodity ETF. However, I am not sure how much relative-performance matters with commodities.
9-January-2025 (Thursday): The Gold SPDR (GLD) is forming a triangle consolidation within a long-term uptrend. GLD hit a new high in late October and then corrected with a triangle the last two months. The swing within the triangled turned down with a sharp decline in mid December, but GLD firmed around 240 and broke short-term resistance with a bounce the last two days. The swing within the triangle is now up and this increases the chances for a bigger breakout at 250. Also notice that there were two oversold readings as Percent-B dipped below 0 in mid November and mid December.
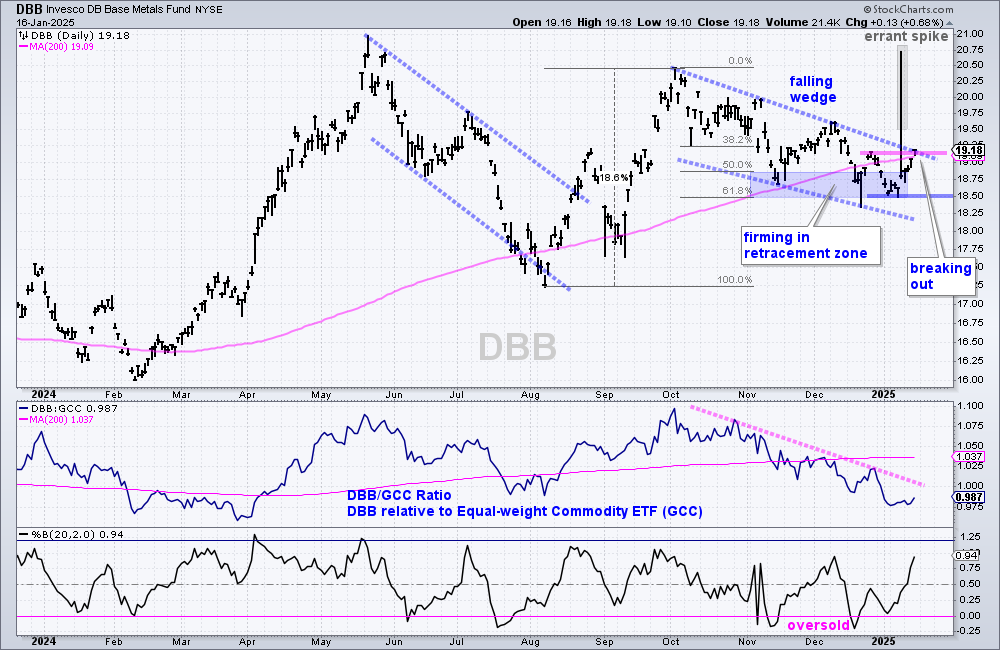
DB Base Metals ETF With a Bullish Setup
The chart above shows the DB Base Metals ETF (DBB) attempting a breakout after a normal correction. DBB surged some 18.6% in August-September and then corrected into December with a falling wedge. This wedge retraced around 61.8% with a move back to the 18.50 area. The ETF firmed in the retracement zone from November to early January and surged above 19 the last five trading days. A breakout is in the making and this would signal a continuation of the prior advance. I am marking re-evaluation support at 18.50.
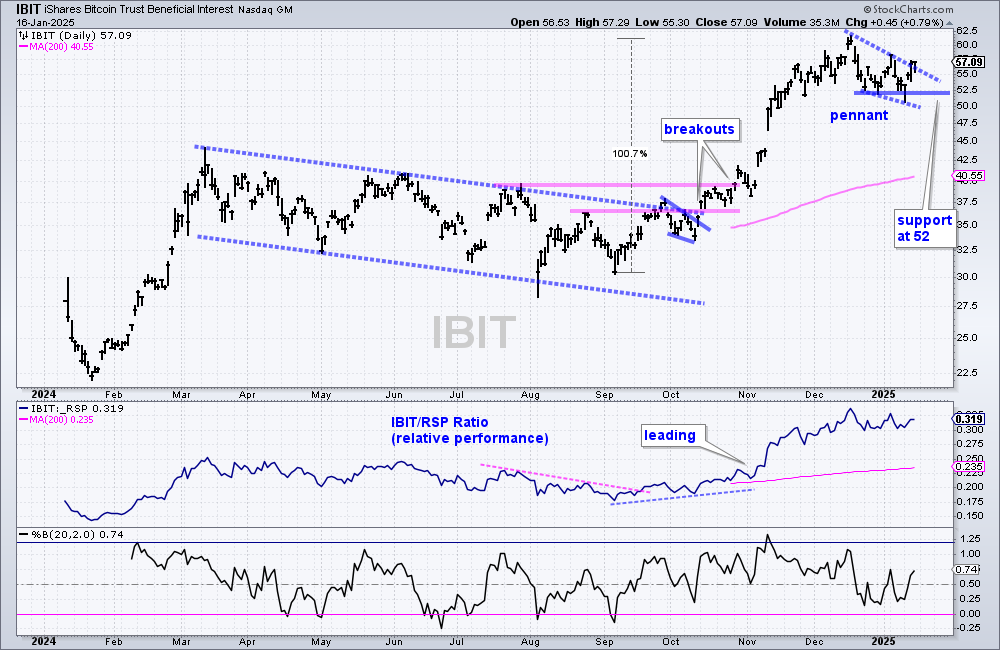
IBIT Breaks Pennant Line
The chart above shows the Bitcoin ETF (IBIT) with a redraw since January 9th. Then, I drew the pennant lines from mid to late December. I am now drawing these lines from mid December to mid January. The pattern is the same: a pennant consolidation after a sharp advance. It is a bullish continuation pattern and IBIT broke the upper line with a surge the last two days. This breakout-surge is also bullish and I am marking re-evaluation support at 52.
9-January-2025 (Thursday): The Bitcoin ETF (IBIT) doubled from early September to mid December and then fell back into yearend. The ability to double in three months tells us that this is one volatile ETF. Be prepared for a wild ride. A pennant formed with the pullback into late December and IBIT broke out with a surge above 55 to start the year. This surge is already faltering as IBIT fell back the last two days. The ETF has support from the pennant lows so the first test is at hand. A break below 52 would argue for a deep pullback, perhaps to the 50% retracement line.