The next report will be on Friday, January 17th.
The long-term breadth indicators deteriorated in December, but did not fall enough to trigger bearish signals. The absence of bearish signals means the weight of the evidence is bullish for stocks. This also means the current weakness is considered a correction within a bigger bull market. All bear market signals start with corrections, but not all corrections lead to bear market signals. Key points:
– The weight of the evidence remains bullish for stocks (bull market).
– SPY, QQQ and RSP remain in long-term uptrends (Bollinger Band signals)
– Breadth deteriorated since mid December, but no bearish signals yet.
– Yield spreads edge higher, but have yet to show serious signs of stress.
– The Fed is in easing mode since the first rate cut in mid September.
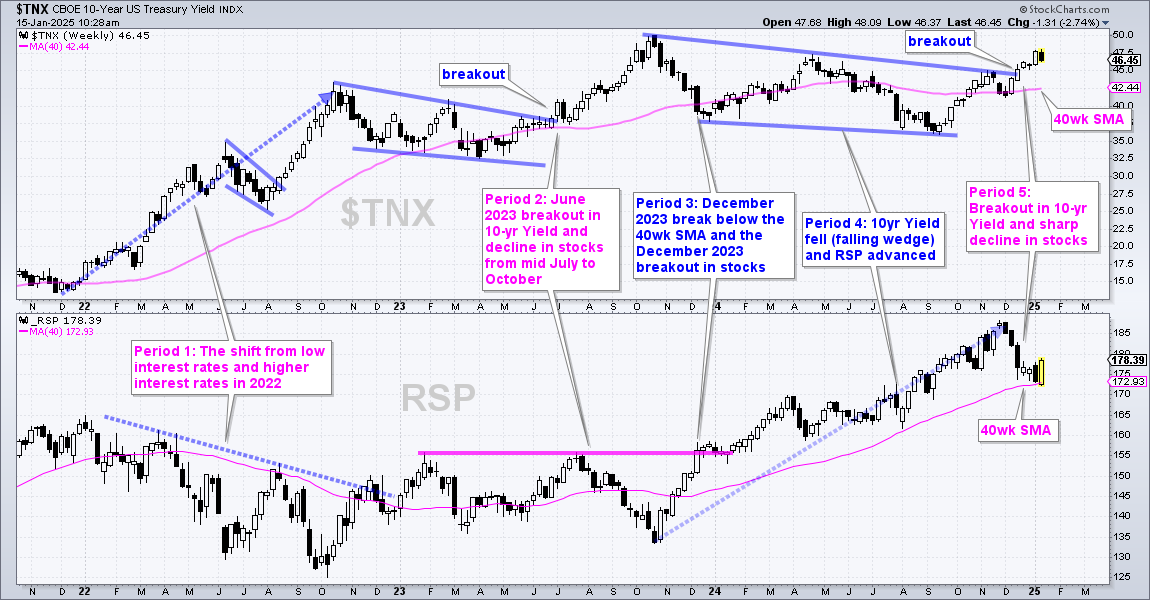
– The 10-yr Yield broke out of a large falling channel and exceeded its April 2024 high.
I am working on a Market Regime ChartList at StockCharts.
Here is a PDF file for preview. [1]
About the Charts and Indicators
The charts and indicators on this page define the market regime and answer the most important question for stock market traders. Are we in a bull or bear market? We start with the trends for three major index ETFs and their respective breadth indicators. These are the most important charts. Next we look at the yield spreads, Fed policy and the 10-yr Treasury Yield.
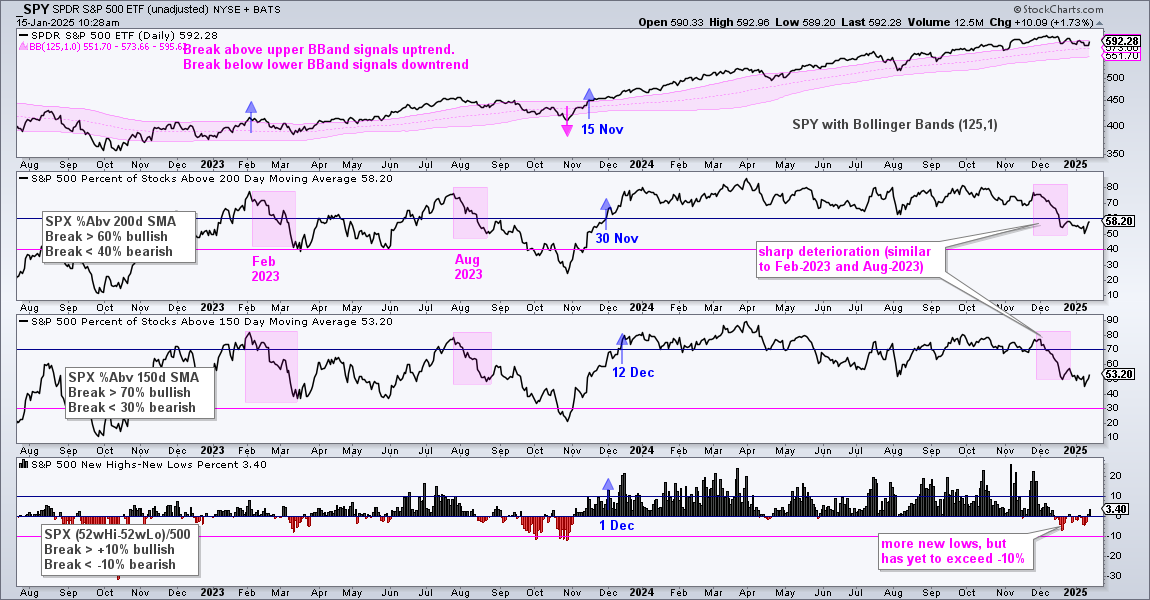
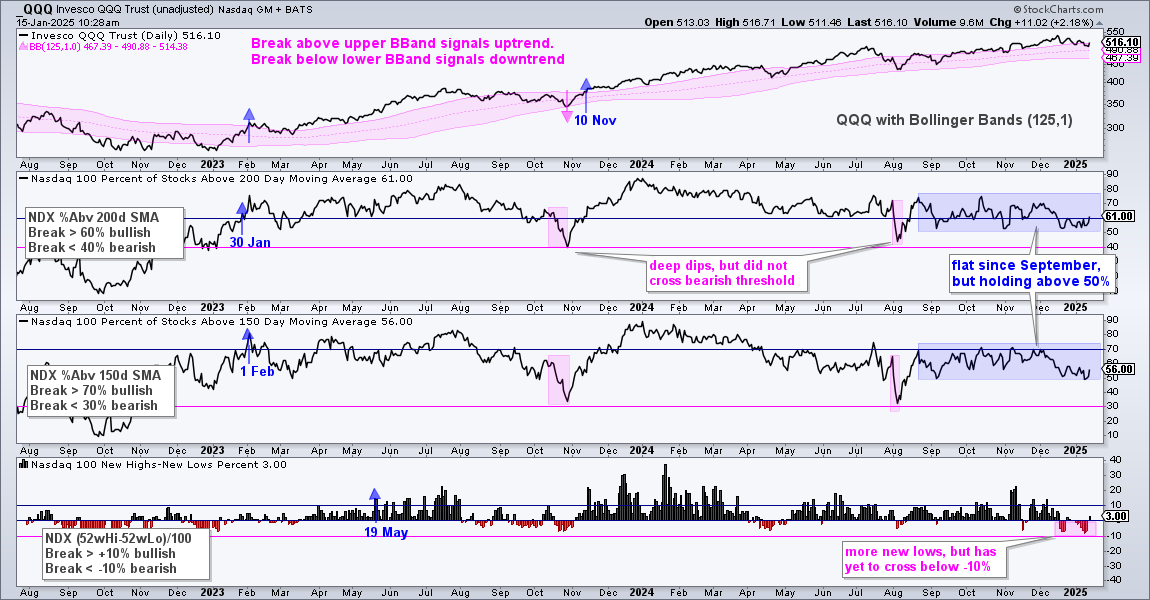
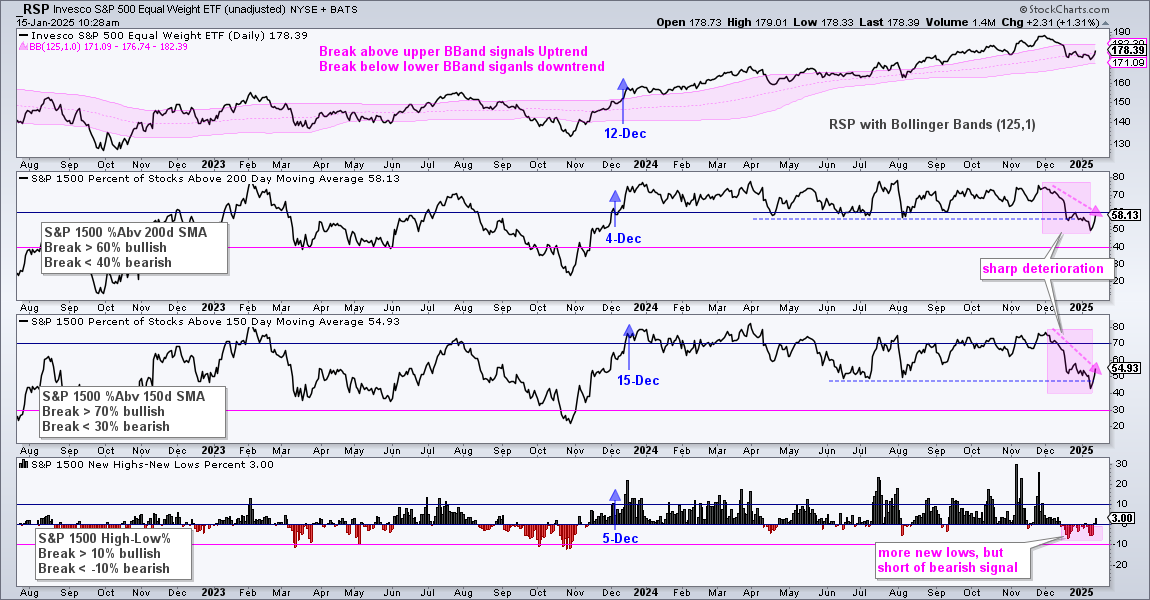
The three trend/breadth charts cover the long-term trends and breadth indicators for the S&P 500, Nasdaq 100 and S&P 1500. Bollinger Bands (125,1) define the long-term trends and three breadth indicators measure internal performance. An uptrend signals when price breaks the upper Bollinger Band and remains in place until a break below the lower band. I am using SPY with S&P 500 breadth, QQQ with Nasdaq 100 breadth and the S&P 500 EW ETF (RSP) with S&P 1500 breadth.
Each breadth indicator comes with signal thresholds to identify significant shifts and reduce whipsaws. The %Above 200-day SMA indicators turn bullish with a move above 60% and remain bullish until a move below 40%, which triggers a bearish signal. Signal thresholds are at 70% and 30% for the %Above 150-day SMA indicators, and a +10% and -10% for the High-Low Percent indicators (percentage of 52-week highs less the percentage of 52-week lows).
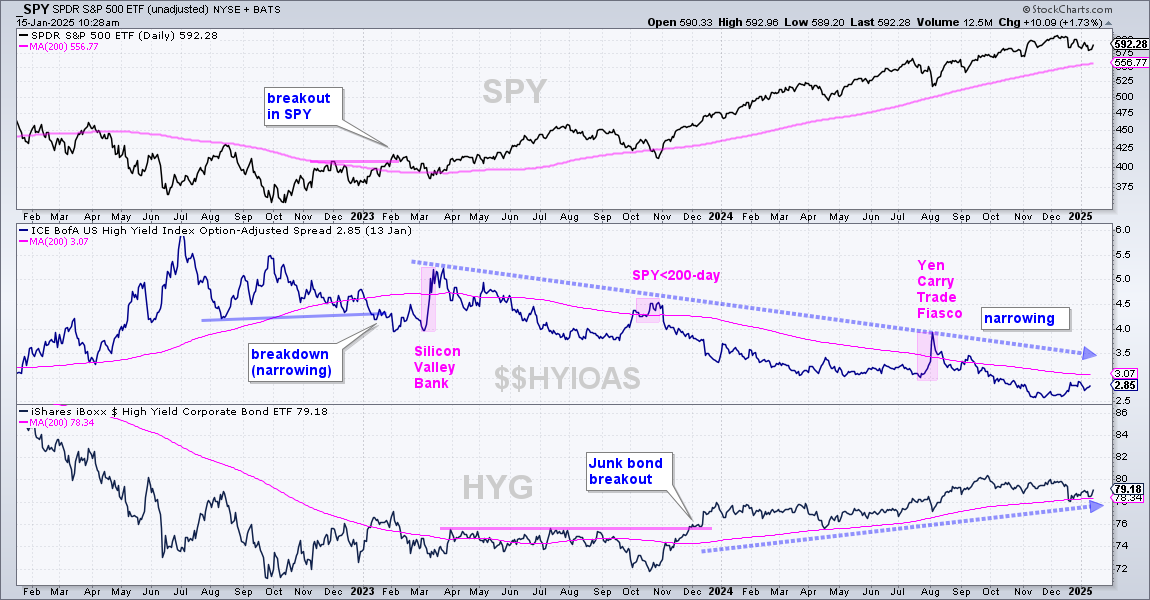
The Junk Bond yield spread (ICE BofA High Yield Index Option-Adjusted Spread) measures the different between junk bond yields and comparable yields for US Treasury bonds. This spread captures the mood of the credit markets. Spreads widen (rise) when there is stress, and this is bearish for stocks. Spreads narrow (fall) when there is confidence, and this is bullish for stocks.
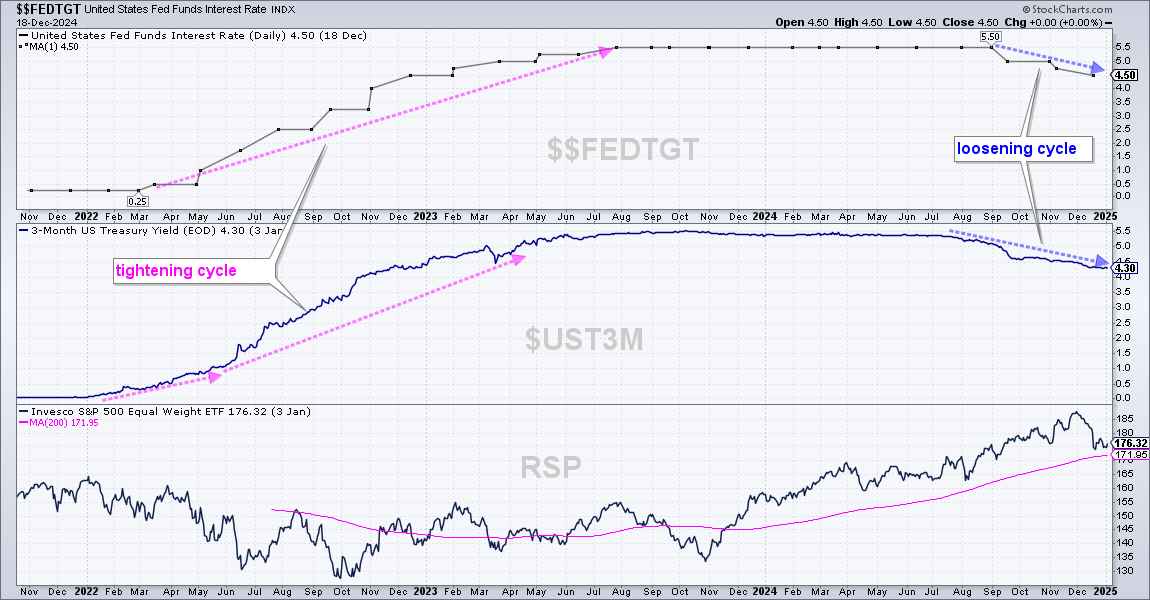
The Fed Funds target rate ($$FEDTGT) tells us the latest moves at the Fed (easing or tightening). We also show the 3-month Treasury Yield, which sometimes leads the Fed by rising ahead of a tightening cycle or falling ahead of a loosening cycle. The 10-yr Treasury Yield reflects the outlook for economic growth, the prospects for inflation and/or supply/demand dynamics in the Treasury bond market.
S&P 500 Trend and Breadth
SPY remains in an uptrend since it broke the upper Bollinger Band on 15-November-2024 and all three breadth indicators are on bullish signals. SPY fell back into the Bollinger Band zone and I view this as a correction within a bigger bullish environment. The pink shading shows breadth deteriorating since mid December, but not triggering a bearish signal. %Above 200-day needs to breach 40% for a bearish signal, while %Above 150-day needs to breach 30% and High-Low Percent needs to breach -10%. The recent deterioration looks similar to what we saw in February-March 2023 and August 2023. Stocks bottomed in March 2023, but continued lower in September and October 2023. We also saw new lows exceed new highs since mid December. Even though the High-Low Percent indicators turned negative, they did not break the -10% level.
Nasdaq 100 Trend and Breadth
QQQ remains in an uptrend since it broke the upper Bollinger Band on 10-November-2024 and all three breadth indicators are on bullish signals. The blue shading shows NDX %Above 200-day oscillating around the 60% level and failing to breach 50%. The same is true for NDX %Above 150-day. These two are just above 50%, which suggests that the cup is half full. Moves below 50% would show further deterioration and be negative.
S&P 500 EW ETF Trend and Breadth
RSP remains in an uptrend since is broke the upper Bollinger Band on 12-December-2024 and all three breadth indicators are on bullish signals. The December deterioration (pink arrows) is most pronounced here because the S&P 1500 includes the S&P MidCap 400 and S&P SmallCap 600. Mid-caps and small-caps bore the brunt of selling pressure and remain the weakest pockets in the stock market.
Junk Bond Yield Spread
The middle window on the chart above shows the Junk Bond Yield Spread ($$HYIOAS) since early 2023. There were some blips along the way, which as the Silicon Valley Bank scare in March 2023 and Yen carry-trend fiasco in August 2024. Overall, the spread remains below its 200-day SMA and the trend is for narrowing. This is positive for the credit markets and stocks.
Fed Policy
The chart above shows the Fed Funds Target Rate ($$FEDTGT) falling since September as the Fed embarked on a loosening cycle. Notice that the 3-month Treasury Yield ($UST3M) peaked in July and fell ahead of the first rate cut, which was on September 16th.
10-yr Treasury Yield
Even though the Fed is loosening, the chart above shows the 10-yr Treasury Yield breaking out of a large falling channel. There are four distinct periods on this chart. Period 1 shows the shift from low interest rates to higher interest rates in 2022, and the 2022 bear market. Period 2 shows the wedge breakout in June 2023 and the move to 5% (50 on the chart). Stocks peaked in mid July 2023 and fell sharply into October. We then have the dramatic decline in the 10-yr Treasury Yield in November-December (Period 3) and the continued decline into September 2024 (Period 4). Stocks advanced into November 2023 and then moved sharply lower in December as the 10-yr Treasury Yield broke out near 4.5% (45). This is Period 5. The breakout argues for higher yields and a move to 5%. This is a negative headwind for stocks. A move back below the 40-wk SMA would remove this headwind.