Levels to Watch for Breadth Thrusts, Small-caps Fail at Breakout Attempt, Semiconductor ETFs Break Out
Posted By
Arthur Hill, CMT
On
In
Archive |
No Comments
The next report will be on Thursday, January 9th.
The weight of the evidence remains bullish for stocks, but there are some sizable pockets of weakness and stocks have yet to recover from their December declines. Today’s report will show the deterioration in long-term breadth and the key levels to watch for short-term breadth. We will then review the breakout in the 10-yr Yield and breakdown in the Home Construction ETF. Attention then turns to the key levels for SPY, QQQ and a number of important ETFs. We close with the breakouts in the semiconductor ETFs (SMH and SOXX).
Breadth Continues to Deteriorate
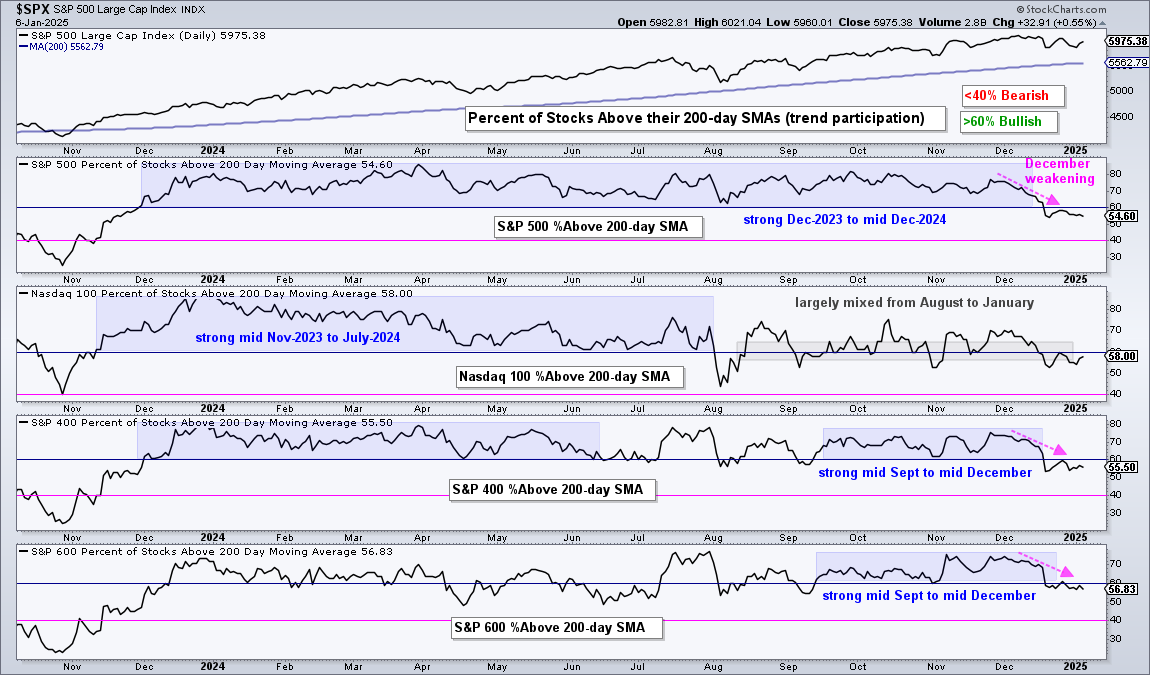
The chart below shows the percentage of stocks above their 200-day SMAs for the S&P 500, Nasdaq 100, S&P MidCap 400 and S&P SmallCap 600. The blue shading shows periods of extended strength when these indicators remained above 60%. These indicators held strong for large-caps, mid-caps and small-caps from mid September to mid December. This marked a period of broad strength. The indicators then weakened in December as all three fell below 60% (pink arrows). Stocks are now mixed with a fair percentage in long-term downtrends.
The middle window shows that Nasdaq %Above 200-day SMA was largely mixed from August to January (gray shading). This indicator took a hit in July and never fully recovered. It has since oscillated around the 60% level. Overall, these indicators are still above 50% and the cup remains half full. However, they were hit hard in December and have yet to recover. We need to see these indicators move back above 60% for signs that the bull market is broadening again. This would provide a more favorable environment for stocks and stock-based ETFs
Oversold Bounce, but No Thrust Yet
Stocks were hit hard in December as S&P 500 Percent Above 50-day SMA ($SPXA50R) fell below 20% and hit its lowest level since October 2024. This sharp increase in downside participation destabilized the stock market. To counter this destabilizing force, I am now looking for signs of a strong recovery and a breadth thrust. Stocks bounced over the last two days, but this bounce remains short of a breadth thrust.
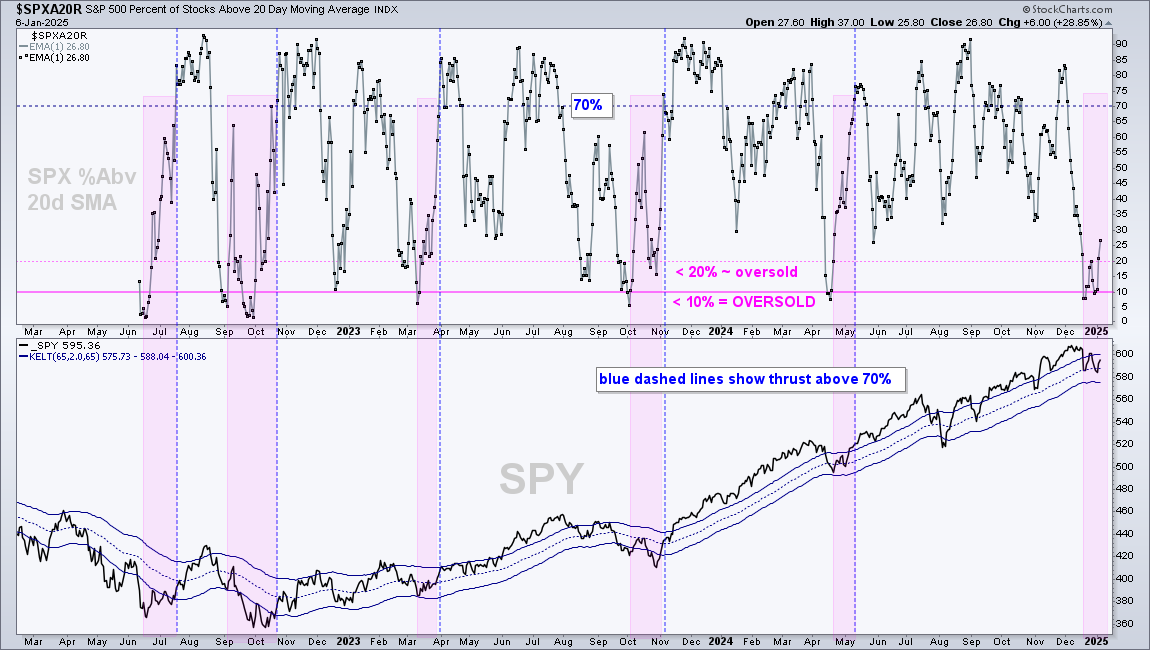
I am watching S&P 500 Percent Above 20-day SMA ($SPXA20R) for the thrust signal. The chart below shows this indicator falling below 10% to become oversold on December 17th and 30th. This indicator rebounded with a move above 25% on Monday, but remains well short of the breadth thrust needed to show a broad increase in upside participation. I am looking for a move above 70% to signal a breadth thrust. The pink shading shows when this indicator became oversold, while the blue dashed lines show the subsequent thrust signals.
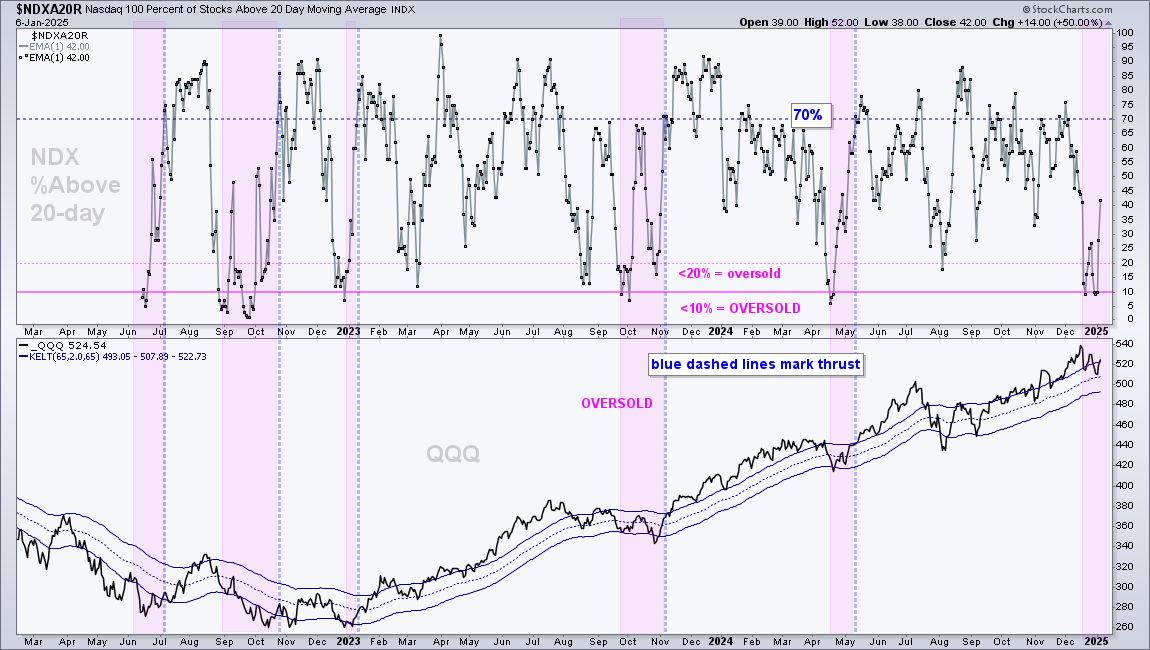
The next chart shows Nasdaq 100 %Above 20-day SMA ($NDXA20R) becoming oversold with dips below 10% on December 19th and 31st. This indicator recovered to 42% on Monday, but also remains short of a thrust that would signal a robust increase in upside participation.
10-yr Treasury Yield Breakout
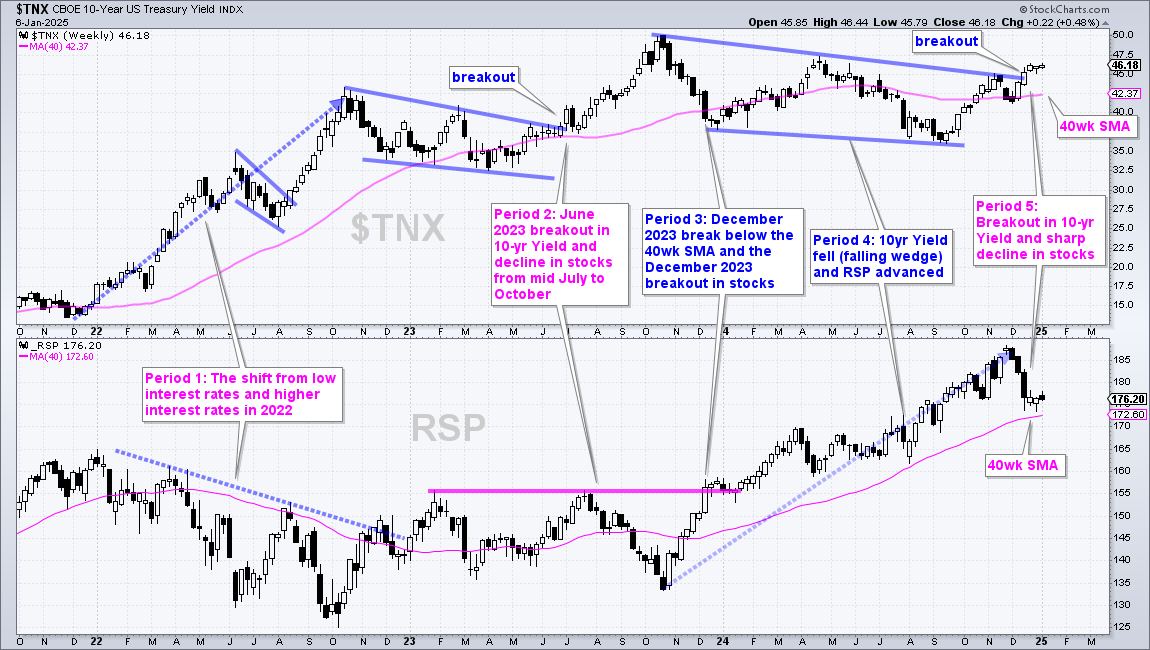
The next chart shows the 10-yr Treasury Yield in the top window and the S&P 500 EW ETF (RSP) in the lower window. There are four distinct periods on this chart. Period 1 shows the shift from low interest rates to higher interest rates in 2022, and the 2022 bear market. Period 2 shows the wedge breakout in June 2023 and the move to 5% (50 on the chart). Stocks peaked in mid July 2023 and fell sharply into October.
We then have the dramatic decline in the 10-yr Treasury Yield in November-December (Period 3) and the continued decline into September 2024 (Period 4). Stocks advanced into November 2023 and then moved sharply lower in December as the 10-yr Treasury Yield broke out near 4.5% (45). This is Period 5. The breakout argues for higher yields and a move to 5%. This is a negative headwind for stocks. A move back below the 40-wk SMA would remove this headwind.
Home Construction ETF Leading Lower
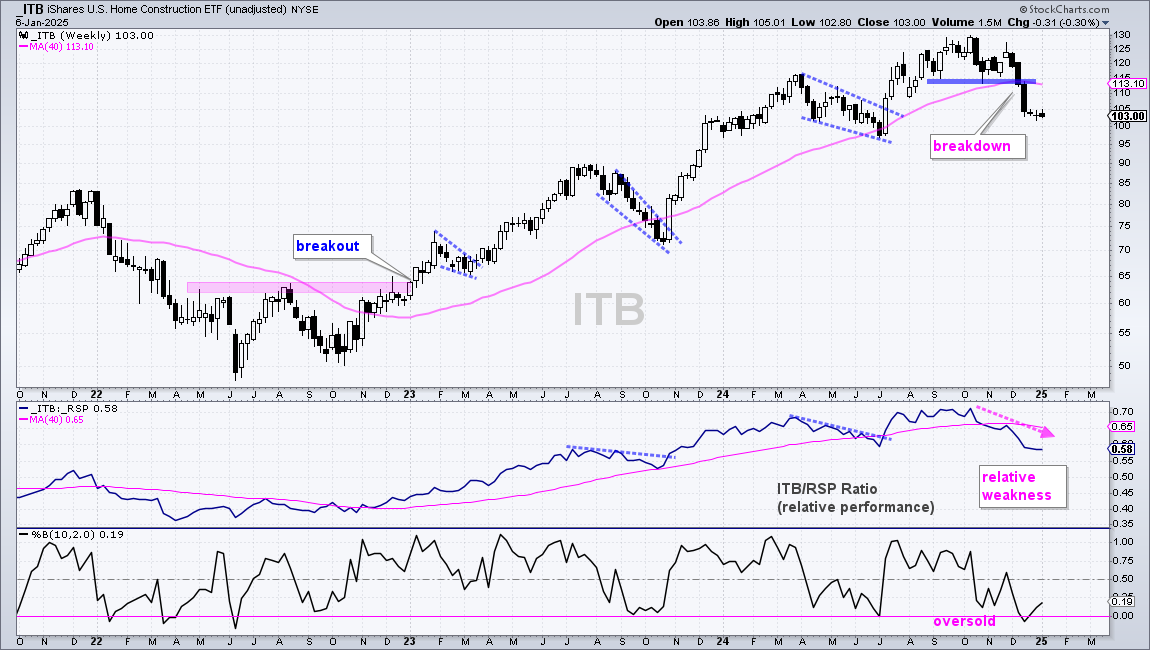
The next chart shows the Home Construction ETF (ITB) with a breakdown in December. ITB broke the September-October lows and 40-week SMA with a sharp decline. The ETF became oversold in mid December and stalled the last few weeks, but the breakdown is clear. ITB shows absolute weakness with the breakdown on the price chart and relative weakness as the price-relative turned lower (ITB/RSP Ratio). Housing is an important component of the US economy and weakness in ITB is a negative.
SPY and QQQ Work their Way Higher
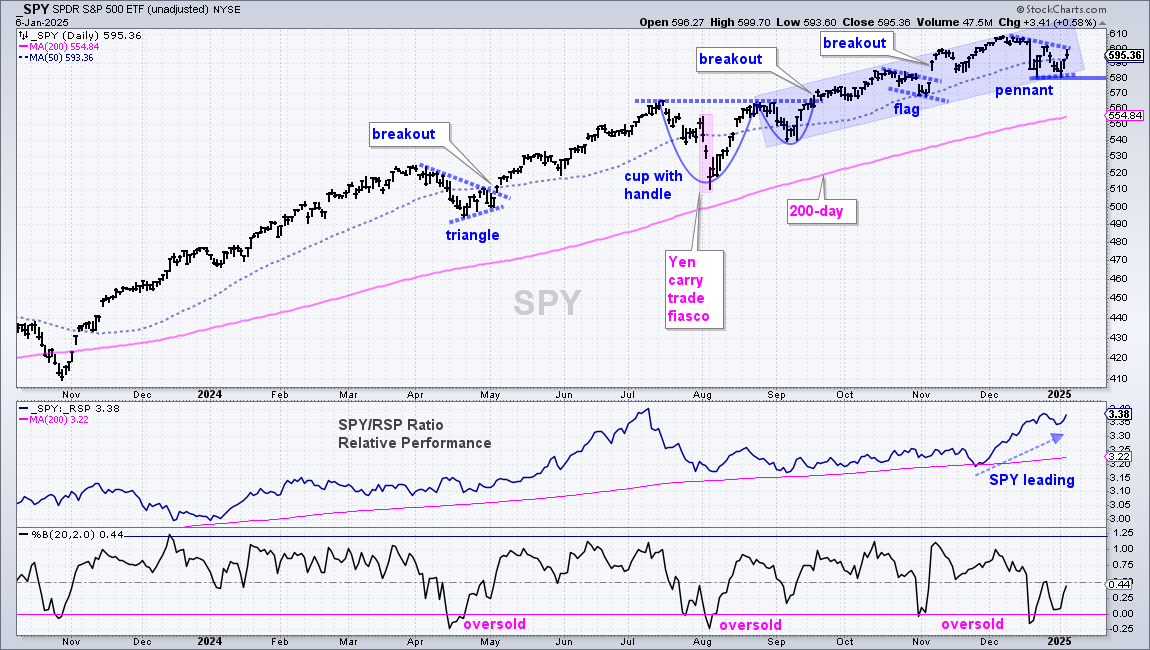
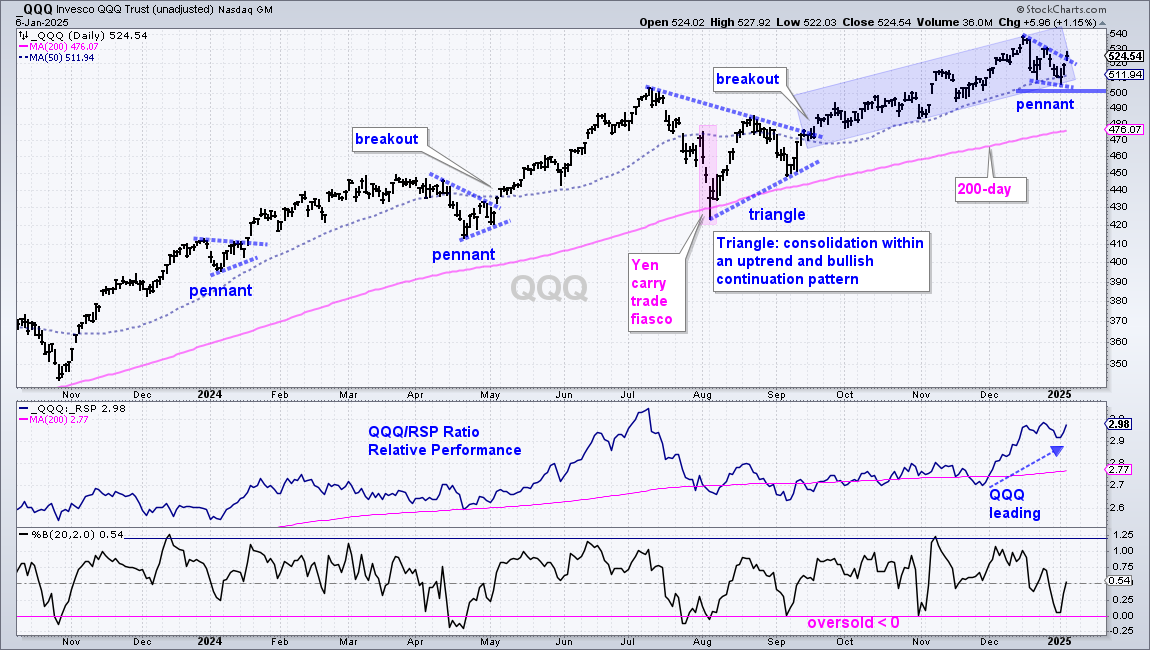
SPY and QQQ broke out in mid September and worked their way higher since the breakout. The blue shading on the charts below define these advances and the bulls get the benefit of the doubt as long as these upswing hold. Both ETFs formed pennant consolidations in late December and bounced the last 2-3 days. These bounces affirm support from the late December and early January lows. A break of these support levels would be negative and argue for a test or the rising 200-day SMAs. The first chart shows SPY with support at 580.
The next chart marks support at 500 for QQQ.
Equal-weight ETF and Small-caps Stall
There is no real change for the S&P 500 EW ETF (RSP) and the Russell 2000 ETF (IWM) because they failed to break out on Monday. Both are trading near Bullish Setup Zones marked by support areas and key retracements (blue shading). The first chart shows RSP retracing 50% of the prior advance from April to November and firming the last few weeks. This is a make or break area. An upside breakout at 178 would be bullish. Conversely, a break below the late December low would signal a continuation lower and likely lead to a break of the 200-day SMA
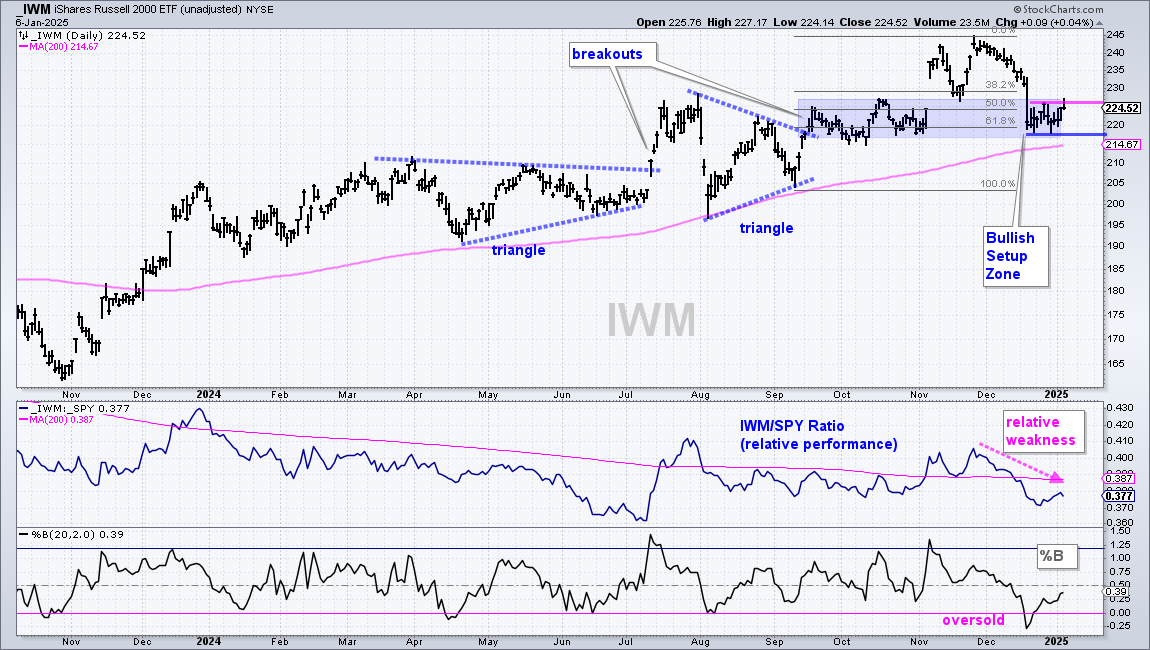
The next chart shows IWM with a chart similar to RSP. IWM attempted a break out on Monday, but fell back by the close. Overall, the ETF continues to consolidate in the Bullish Setup Zone (blue shading). A close above 226.5 would trigger a breakout, while a close below 217 would trigger a breakdown.
Key Groups Short of Breakouts (XLF, KRE, XLI, ITA)
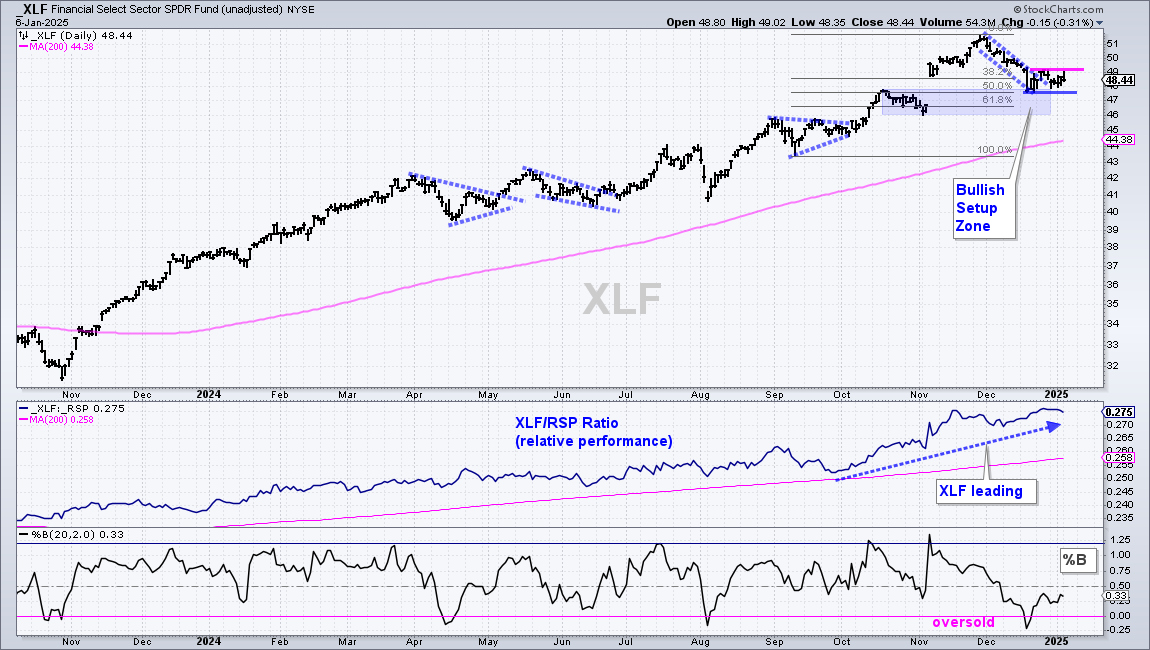
Broad strength is needed to trigger a breakout in small-caps and a breadth thrust. For signs of broad strength, I am focused on two sectors and an industry group within each. The first chart shows the Finance SPDR (XLF) with a new high in late November, a decline in December and a consolidation the last two weeks. As with RSP and IWM above, the resolution of this consolidation will dictate the next move. An upside break above the late December high (49) would be bullish and argue for a challenge to the November high. A downside break at 47.5 would be bearish and argue for a test of the rising 200-day SMA.
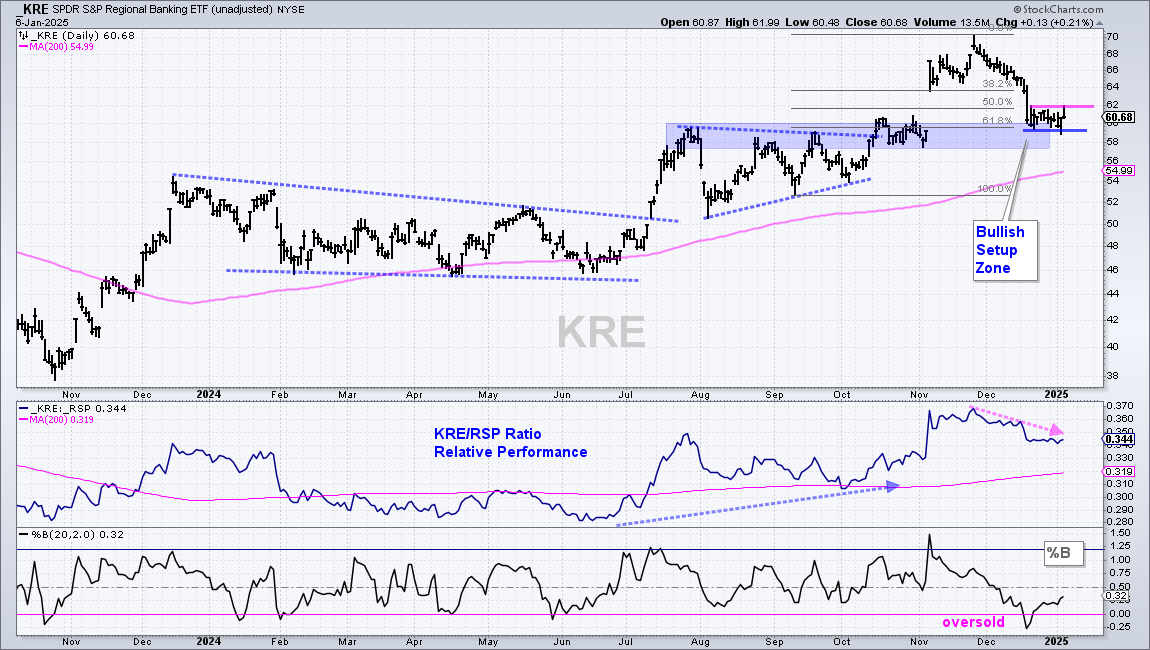
The next chart shows the Regional Bank ETF (KRE) with resistance marked at 62 and support marked at 59.
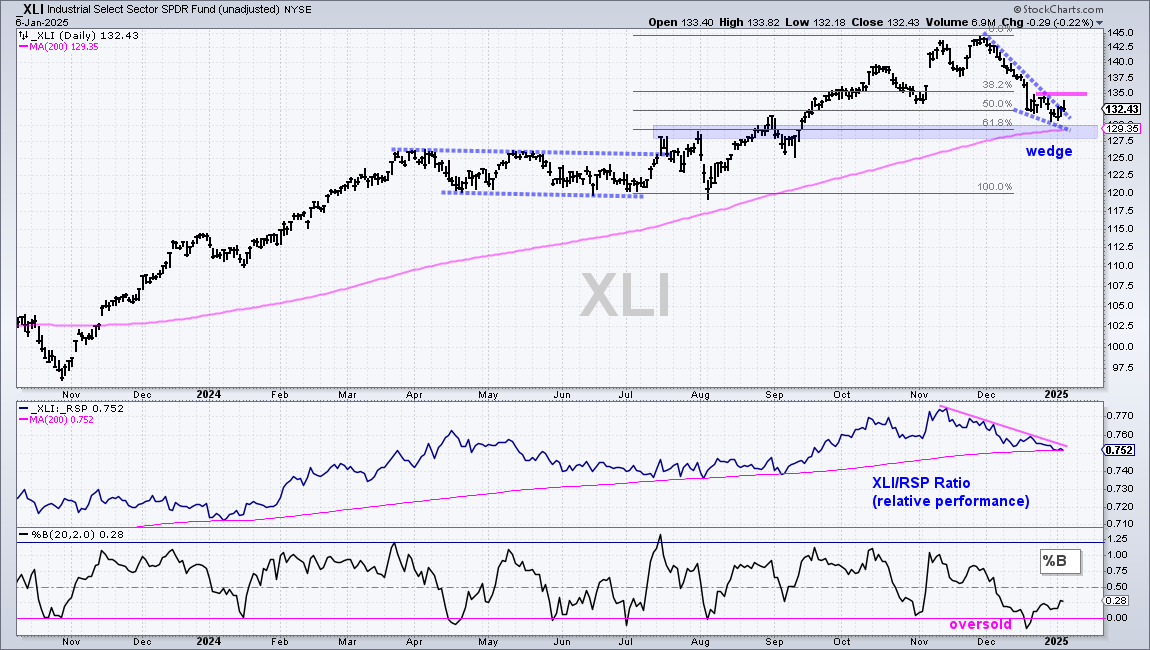
The next chart shows the Industrials SPDR (XLI) with a falling wedge since December. This looks like a correction within a bigger uptrend and the ETF is trading near a Bullish Setup Zone. The wedge, however is still falling and we have yet to see a breakout. Resistance is set at 135 and a breakout here would be bullish.
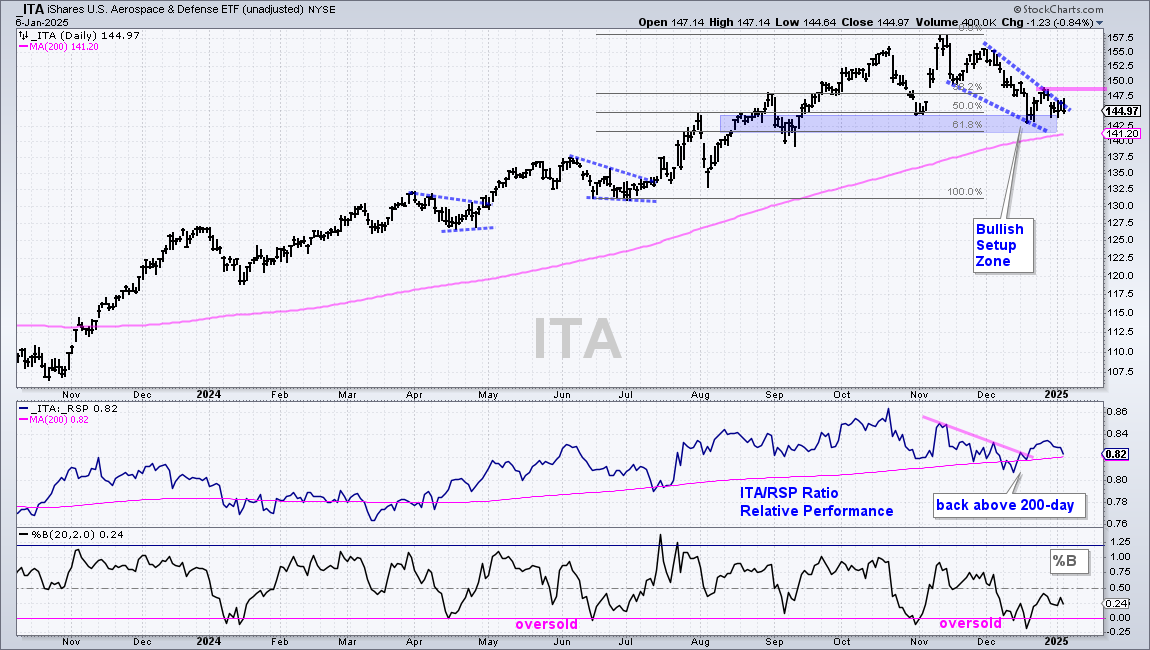
The next chart shows the Aerospace & Defense ETF (ITA), which represents one of the larger industry groups within XLI. ITA hit a new high in November and corrected into early January with a falling wedge. As with XLI, the wedge is still falling and the ETF remains short of a breakout. Resistance is set at 149 and a breakout here would be bullish.
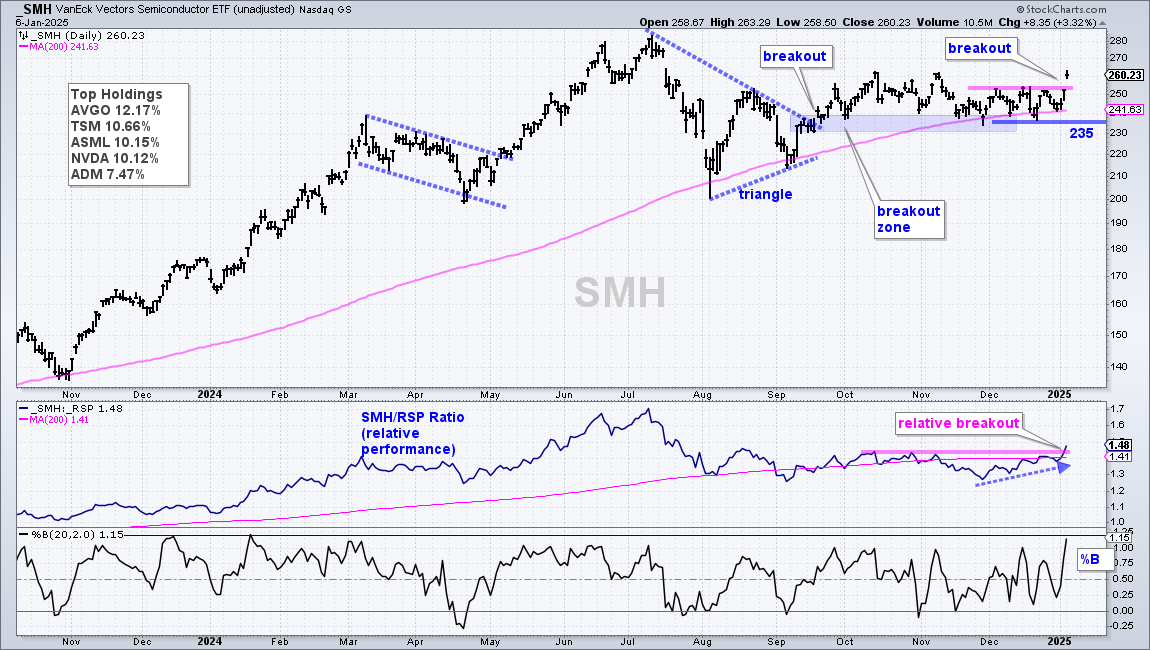
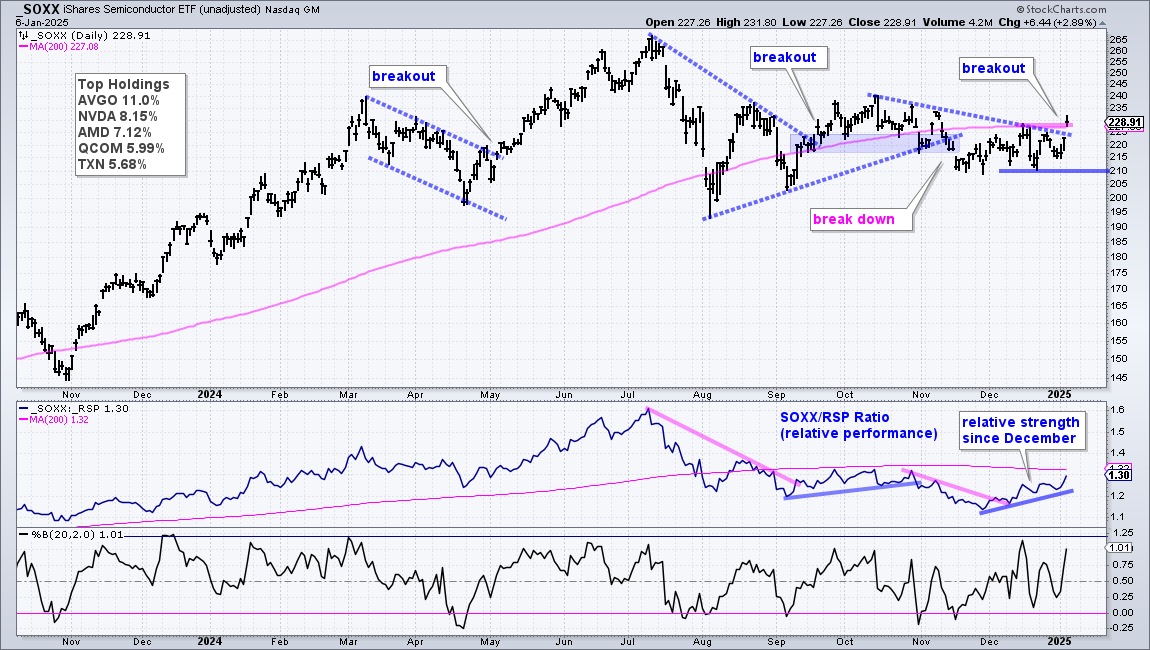
Semiconductor ETFs Surge and Break Out
The Semiconductor ETFs (SOXX and SMH) are breaking out with surges and gaps the last two days. SMH is the stronger of the two because it was already above its rising 200-day SMA. SMH is also more concentrated than SOXX with the top four holdings accounting for over 40%. These include AGVO (12.17%), TSM (10.66%), ASML (10.15%) and NVDA (10.12%). On the price chart, SMH broke triangle resistance in mid September and largely held this breakout zone into yearend. The ETF broke resistance with a three day surge and the price-relative (SMH:RSP ratio) broke its October high. Thus, SMH has absolute and relative breakouts working. I am marking support at 235.
The next chart shows the Semiconductor ETF (SOXX) breaking back above its 200-day SMA and exceeding its mid December high. This is a breakout, but SOXX is not a strong as SMH. I am marking support at 210.