The Biotech ETF (IBB) is making a bullish statement with recent developments in momentum, volume and trend. IBB is also outperforming its counter part, the Biotech SPDR (XBI), over the last two months.
The chart below shows IBB surging around 10% from the early October low to the current high. The ETF moved above its 200-day SMA, but I would not call this an important milestone because the ETF also crossed the 200-day in February, March, April and June. None of these crosses resulted in a lasting trend change.
While the significance of the 200-day break is questionable, I consider it noteworthy that IBB exceeded a resistance zone marked by the mid August and mid September highs. This means IBB could be in the early stages of a trend reversal.
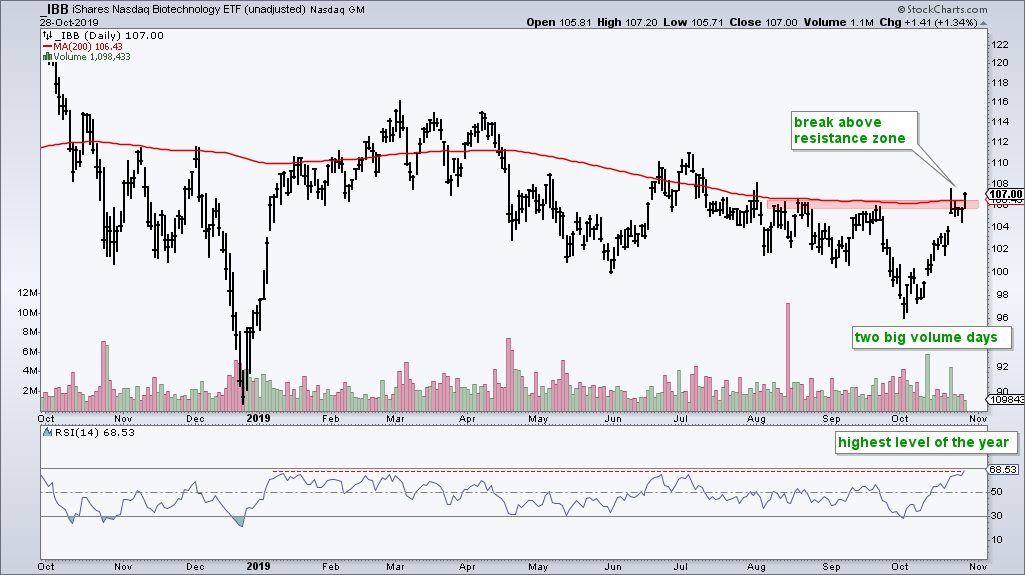
In general, I am not a big fan of volume for ETFs or exchanges, but I could not help but notice the two big volume days in October. Both volume surges occurred on up days and this shows strong buying pressure.
The lowest indicator window shows RSI(14) moving to its highest level of 2019 (68.53). This tells me that upside momentum over the last 14 days was the strongest of the year. RSI has yet to move above 70, but I would view a move above 70 as further testament to underlying strength. It takes strong upside momentum to become overbought.
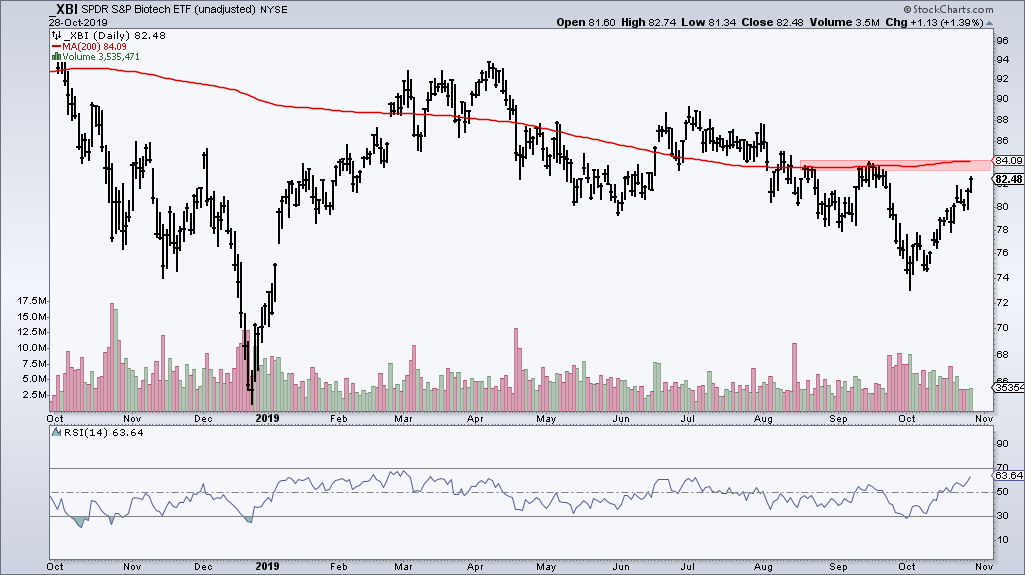
The next chart shows the Biotech SPDR (XBI) underperforming IBB over the last two months. XBI has yet to break the red resistance zone, RSI(14) is well below 70 and the volume profile is different.
What now? I would put IBB on my radar because the big trend could be turning up. This upturn is still in early stages though and IBB is not a leader. QQQ, SPY, XLK and SOXX, by comparison, hit 52-week highs this week and are the real leaders. Nevertheless, I will watch IBB and switch to RSI(10) for short-term oversold conditions. A dip into the 30s could provide an opportunity for a mean-reversion setup.